Chang Suk Chung / プロファイル
- 情報
|
10+ 年
経験
|
1
製品
|
664
デモバージョン
|
|
0
ジョブ
|
0
シグナル
|
0
購読者
|
Copyright 2009-2017, Chang Suk Chung
Chang Suk Chung


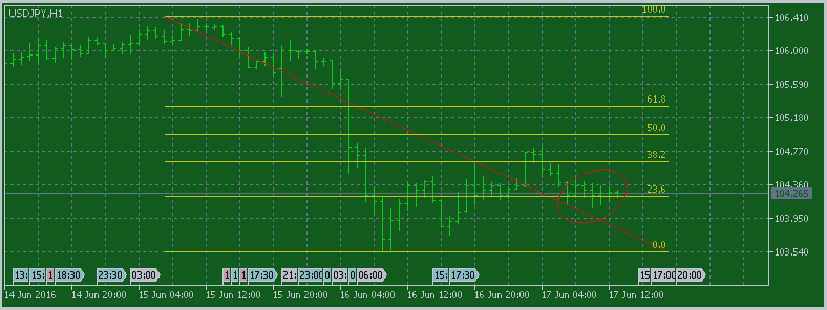
Below is USDJPY H1 chart. Please concern about circle. Chikou span is a historical price on 26 days ago of a current close price. It is crossing over historical candle. There was a buying point at that time...
ソーシャルネットワーク上でシェアする · 2
168
Chang Suk Chung

Chang Suk Chung


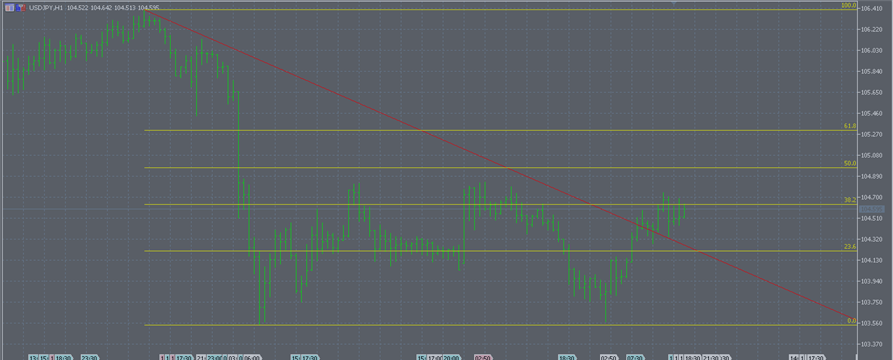
Below is usdjpy H1 chart. Ichimoku kinko hyo, heiken ashi and fibonacci retracement are showed in chart. Chikou span is touching historical candle. And now candle is moving over senkou span A. Next resistance level is located at fibonacci 38.2% retracement...
3
Chang Suk Chung


Below is usdjpy H1 chart. Ichimoku kinko hyo, heiken ashi and fibonacci retracement are showed in chart. Chikou span is touching historical candle. And now candle is moving over senkou span A. Next resistance level is located at fibonacci 38.2% retracement...
ソーシャルネットワーク上でシェアする · 3
160
Chang Suk Chung
シェアされた作者Dmitry Voronkovの記事
平均足インジケーターに基づくトレーディングシステムの例 

この記事は、トレーディングにおける平均足インジケーターの使用についての疑問を詳しく見ていきます。このインジケーターに基づき、簡単な取引システムが検討され、MQL55アドバイザーが記述されました。取引処理は、Standardクラスライブラリに基づき実行されます。トレーディング戦略のテスト結果は、履歴に基づき、内蔵MetaTrader5ストラテジーテスター使用し、取得されます。
Chang Suk Chung


This stage of USDJPY is Fibonacci 38.2% retracement. Next target point is 104.839...
ソーシャルネットワーク上でシェアする · 2
132
Chang Suk Chung


I think down trend of USDJPY is ending. Below is ichimoku kinko hyo chart. Lowest value of Chikou span is being high. I think now is buying point. What is your opinion...
ソーシャルネットワーク上でシェアする · 2
143
Chang Suk Chung
シェアされた作者Samuel Olowoyoの記事
This is the most excellent article.
You can't miss it.
You can't miss it.
MQL5でExpert Advisorを書くための初心者向けステップバイステップガイド 

MQL5のExpert Advisorプログラミングはシンプルで簡単に学べます。ステップバイステップガイドでは、策定されたトレーディングストラテジーに基づきシンプルなExpert Advisorを書くのに必要な基本的ステップを説明します。Expert Advisorの構造、内蔵 テクニカルインディケーターとトレーディング関数の使用、 デバッグモード の詳細とストラテジーテスターの使用を紹介します。
Chang Suk Chung


Parabolic SAR is magnificent to make profit. You can find trend apparently at Parabolic SAR. But in side walking phases it shows misleading signals...
ソーシャルネットワーク上でシェアする · 1
178
Chang Suk Chung
シェアされた作者Dmitriy Zabudskiyの記事
Indicator for P&F Chart for MetaTrader 5.
It is creative and innovationall.
It is creative and innovationall.
ポイントおよびグラフチャート化インディケータ 
現在マーケットの状況に関する情報を提供するチャートは数多くあります。「ポイント」や「グラフ」チャートのようにそれらの多くは遠い過去の遺産です。本稿は実時間のインディケータを用いて「ポイントとグラフ」チャート例について述べます。
Chang Suk Chung
シェアされた作者Dmitriy Zabudskiyの記事
This is a very excellent article about Three Line Break Chart.
You can gain a good inspiration.
You can gain a good inspiration.
3つのラインブレイクチャートを作成するためのインディケータ 

本稿は Steve Nison 氏が著書 "Beyond Candlesticks" で提案している「3つのラインブレークチャート」について取り上げます。このチャートの最大のメリットはそれにより前の変動に関して価格のマイナー変動にフィルターを描けることができることです。チャート作成の原則、インディケータのコード、それに基づくトレーディング戦略例についてお話していこうと思います。
Chang Suk Chung
パブリッシュされた投稿How to use Icimoku Kinco Hyo chart
Below is my opinion about using Ichimoku Kinco Hyo chart at EURUSD. This is the chart. Arrows is signals to hold positions at EURUSD. There are buying and selling signals at above chart. It is important to analize the chart...
ソーシャルネットワーク上でシェアする · 1
203
Chang Suk Chung
パブリッシュされた投稿Analysis of Ichimoku Kinco Hyo Charts at EURUSD
I am interesting at Ichimoku Kinko Hyo Chart. It shows and represents past, present and future market move. Below is the chart at EURUSD Today. After three-bottom type occurs, up-trend is progressing. And a few minutes ago candle sticks are moving upward very rapidly and sharply...
ソーシャルネットワーク上でシェアする · 2
233
:

