Anand / プロファイル
- 情報
|
10+ 年
経験
|
0
製品
|
0
デモバージョン
|
|
144
ジョブ
|
0
シグナル
|
0
購読者
|
Software Engineer
において
Self Employed
Feedbacks:
https://www.mql5.com/en/users/anand_mt4/feedbacks
Finished jobs:
https://www.mql5.com/en/users/anand_mt4/portfolio/jobs_close
Submit a new job for me:
https://www.mql5.com/en/job/new?prefered=anand_mt4
https://www.mql5.com/en/users/anand_mt4/feedbacks
Finished jobs:
https://www.mql5.com/en/users/anand_mt4/portfolio/jobs_close
Submit a new job for me:
https://www.mql5.com/en/job/new?prefered=anand_mt4
Anand
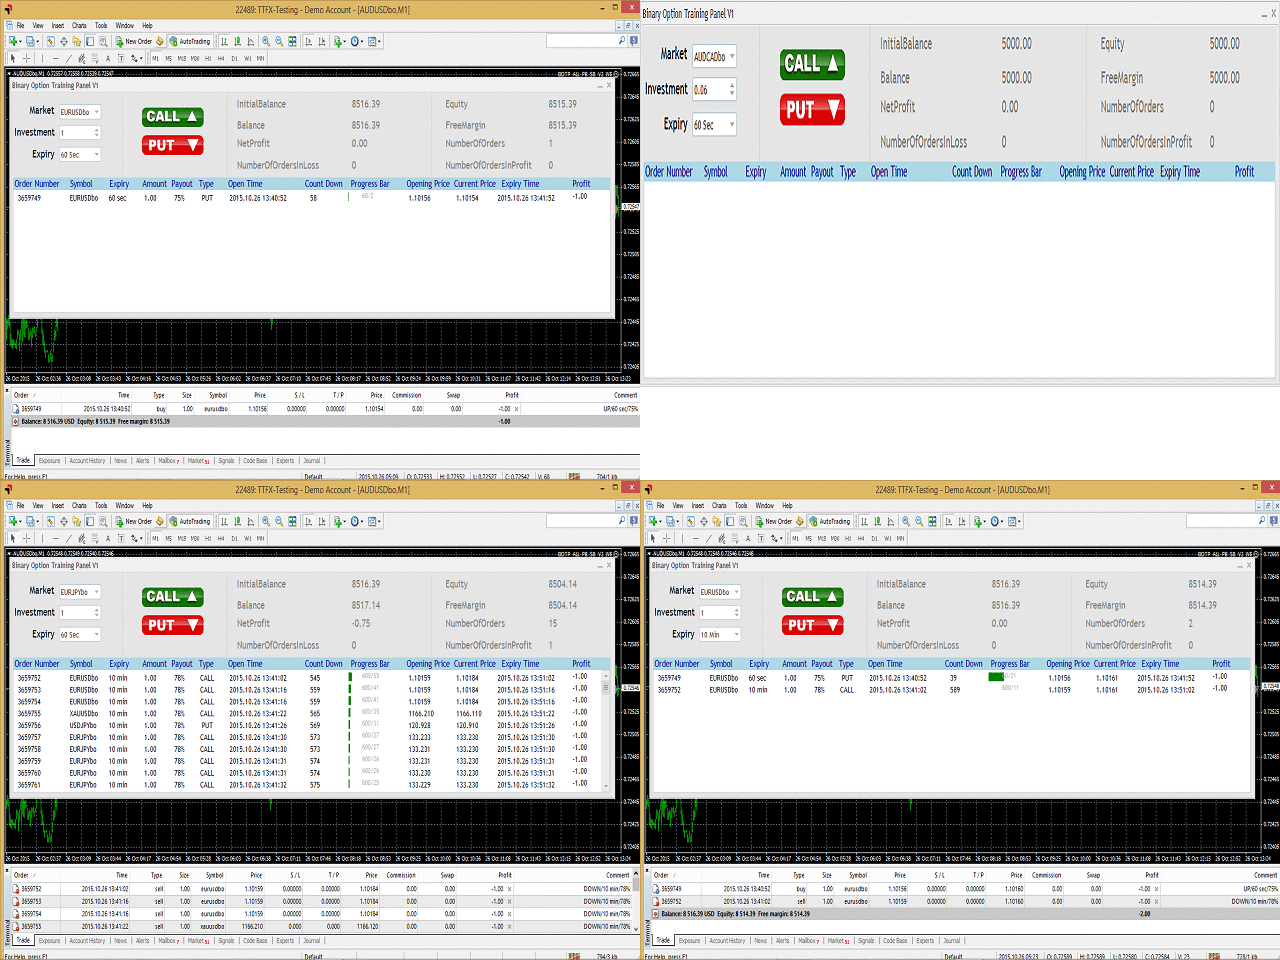
Advanced Binary Options Trading Panel
https://www.mql5.com/en/market/product/12528
Binary Option Trading Panel is the next generation trading panel that will revolutionize the way binary options are traded in MT4. This advanced trading panel allows you to place binary option trades from a single panel. The user has to just enter the binary option symbol, the investment, select the expiry time and click on the Call or Put button.

Anand
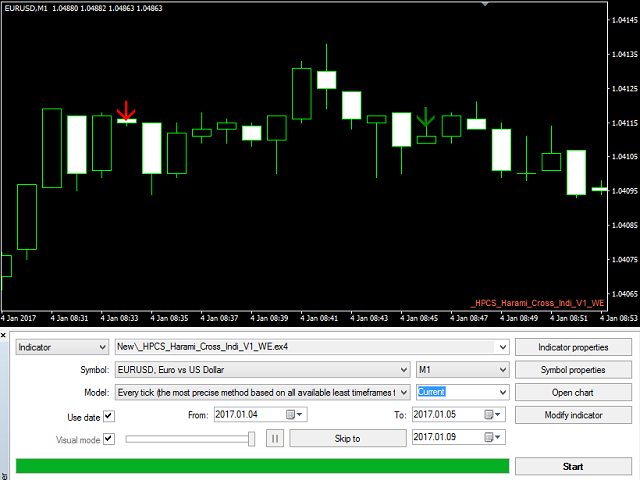
HP Harami Cross Indicator
https://www.mql5.com/en/market/product/21932
It is a trend indicated by a large candlestick followed by a doji that is located within the top and bottom of the candlestick's body.
It is a significant indicator of trend reversal, particularly when it occurs after a long body in a downtrend. It is the same as the Harami, except that the second candle is a Doji.

Anand

HP Engulfing Pattern Indicator
https://www.mql5.com/en/market/product/21927
This is a very simple indicator which identifies and displays engulfing pattern on the chart with the help of arrows.
https://www.mql5.com/en/market/product/21927
This is a very simple indicator which identifies and displays engulfing pattern on the chart with the help of arrows.

Anand
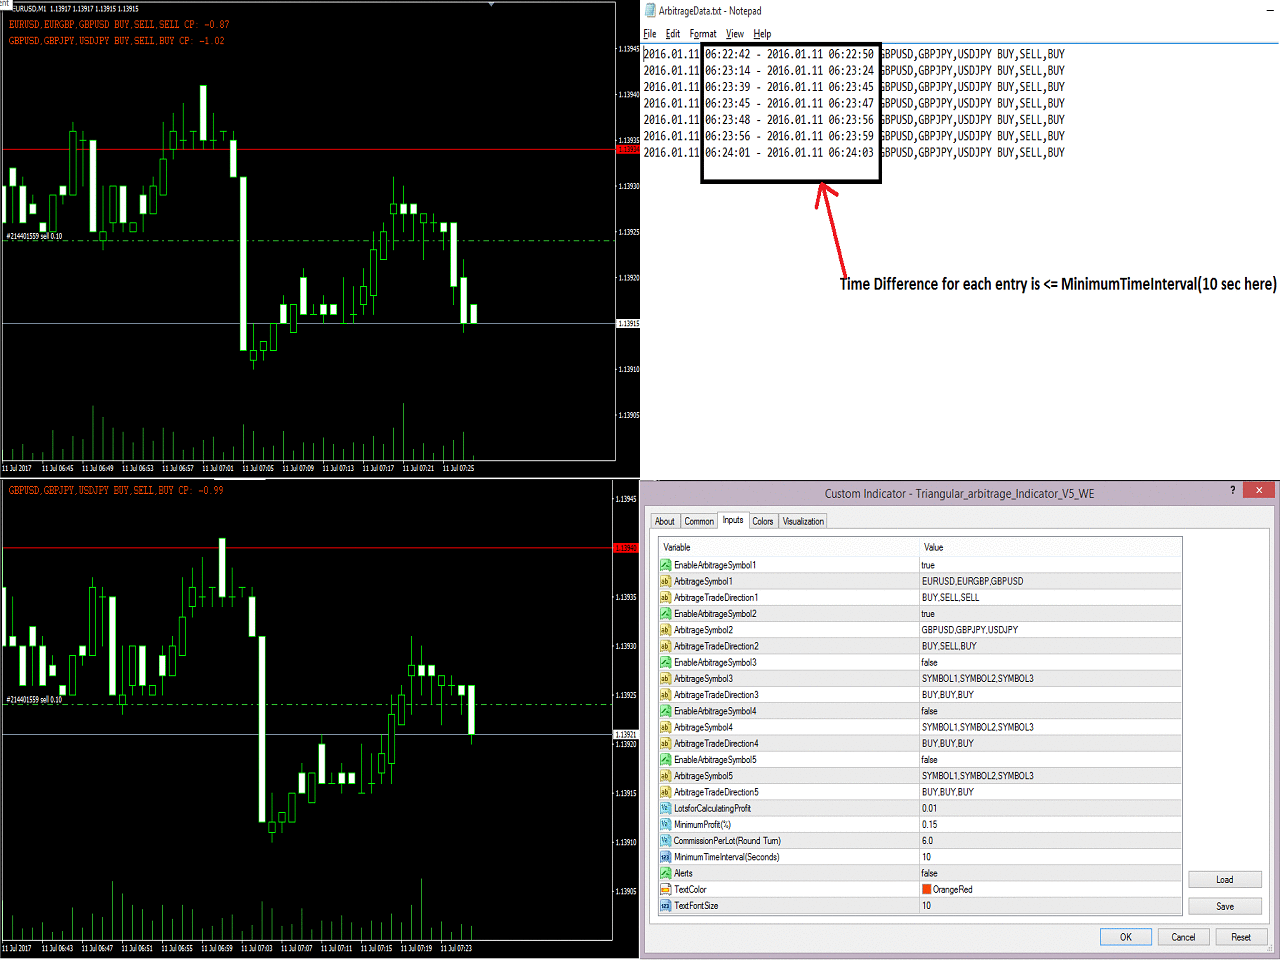
Triangular Arbitrage Indicator
https://www.mql5.com/en/market/product/15095
Triangular Arbitrage Indicator is one the most advance and efficient indicator available based on triangular arbitrage concept. Its complex algorithm calculates the profit based on different input parameters and shows directly on the chart. Also, if the minimum profit is retained for the minimum time interval (see input parameter sections) then that particular asset is written in a text file.

Anand
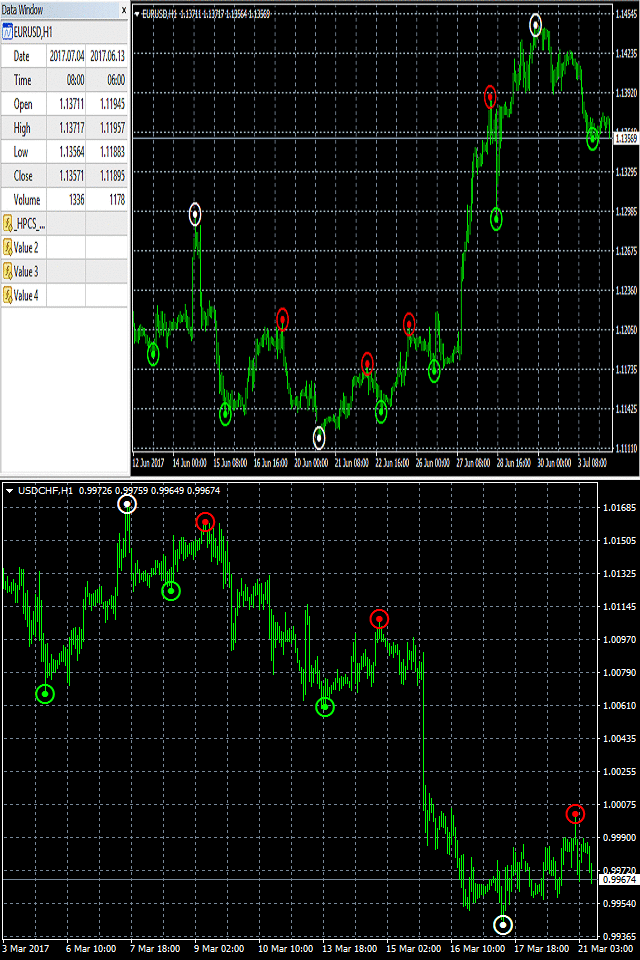
HP Wave Entry Alerts Indicator
https://www.mql5.com/en/market/product/21954
Indicator to identify and display peaks and troughs for a given time period.
This indicator is one indicator that repaints, in the sense that the actual signal is disappearing from the screen if price goes and makes a new high/new low after such a signal appears.

Anand
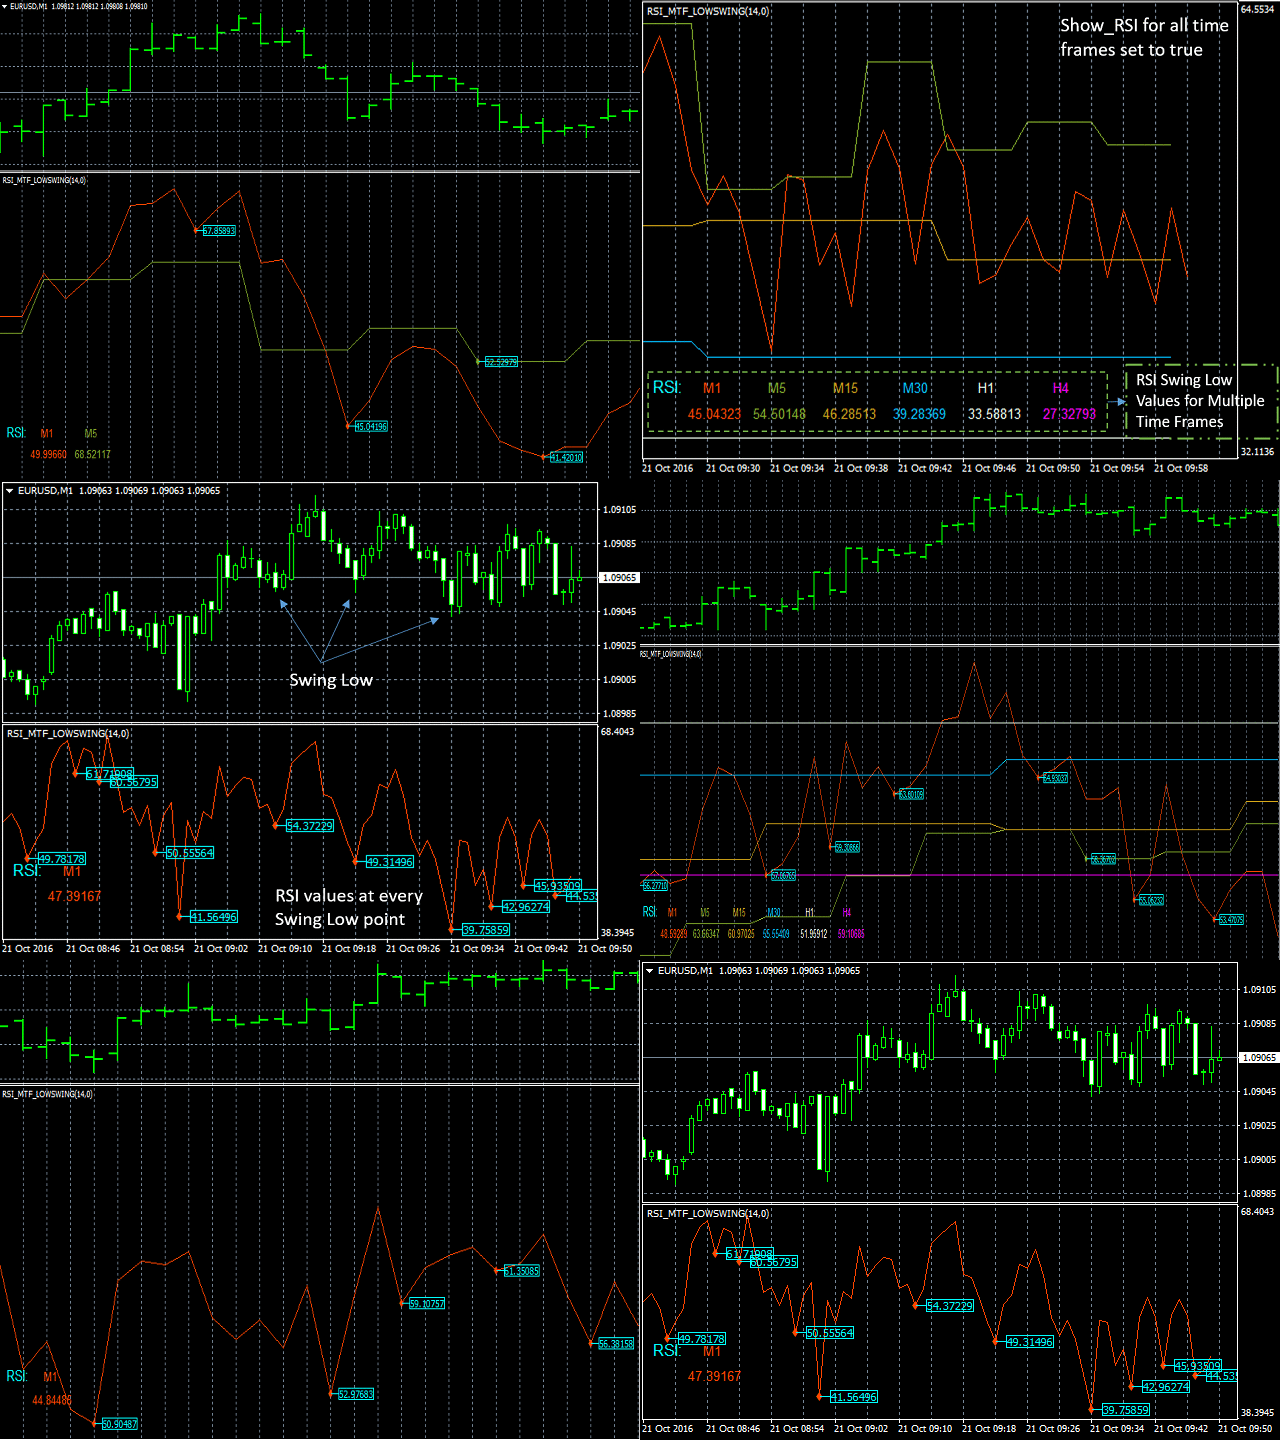
RSI Swing Low Multi Time Frame Indicator
https://www.mql5.com/en/market/product/13877
It supports multiple time frames i.e. by attaching the indicator on a single chart one can see the RSI Swing Low values for all the other time frames on a single chart.
https://www.mql5.com/en/market/product/13877
It supports multiple time frames i.e. by attaching the indicator on a single chart one can see the RSI Swing Low values for all the other time frames on a single chart.

Anand
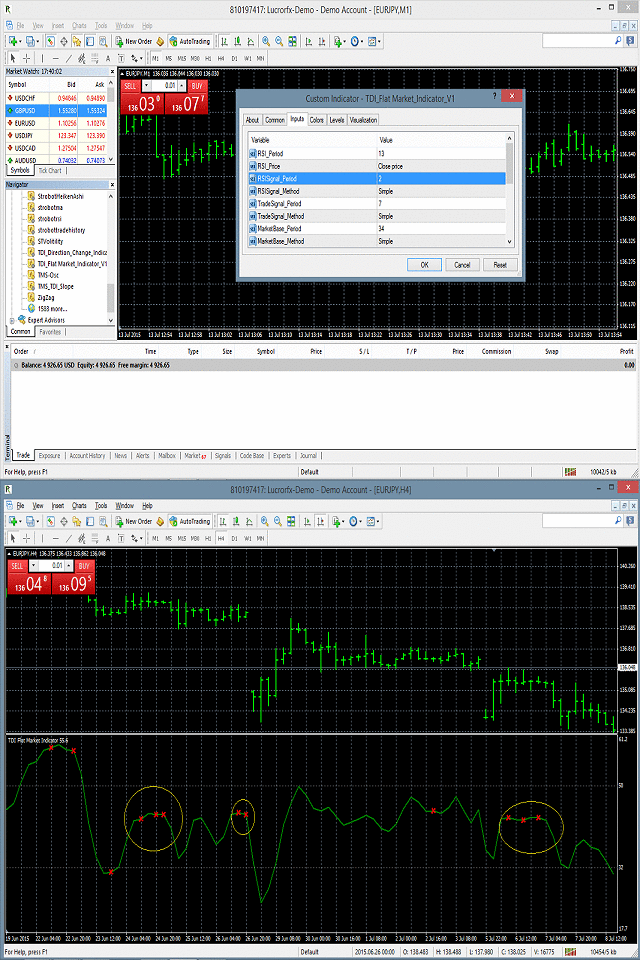
TDI Flat Market Indicator
https://www.mql5.com/en/market/product/10450
TDI Flat Market Indicator is an oscillator indicator which works in a separate window. It is based on RSI (Relative Strength Index), Trade Signal Method and Market Base Method. It identifies the flat market behavior which helps in determining when to enter the market.

Anand
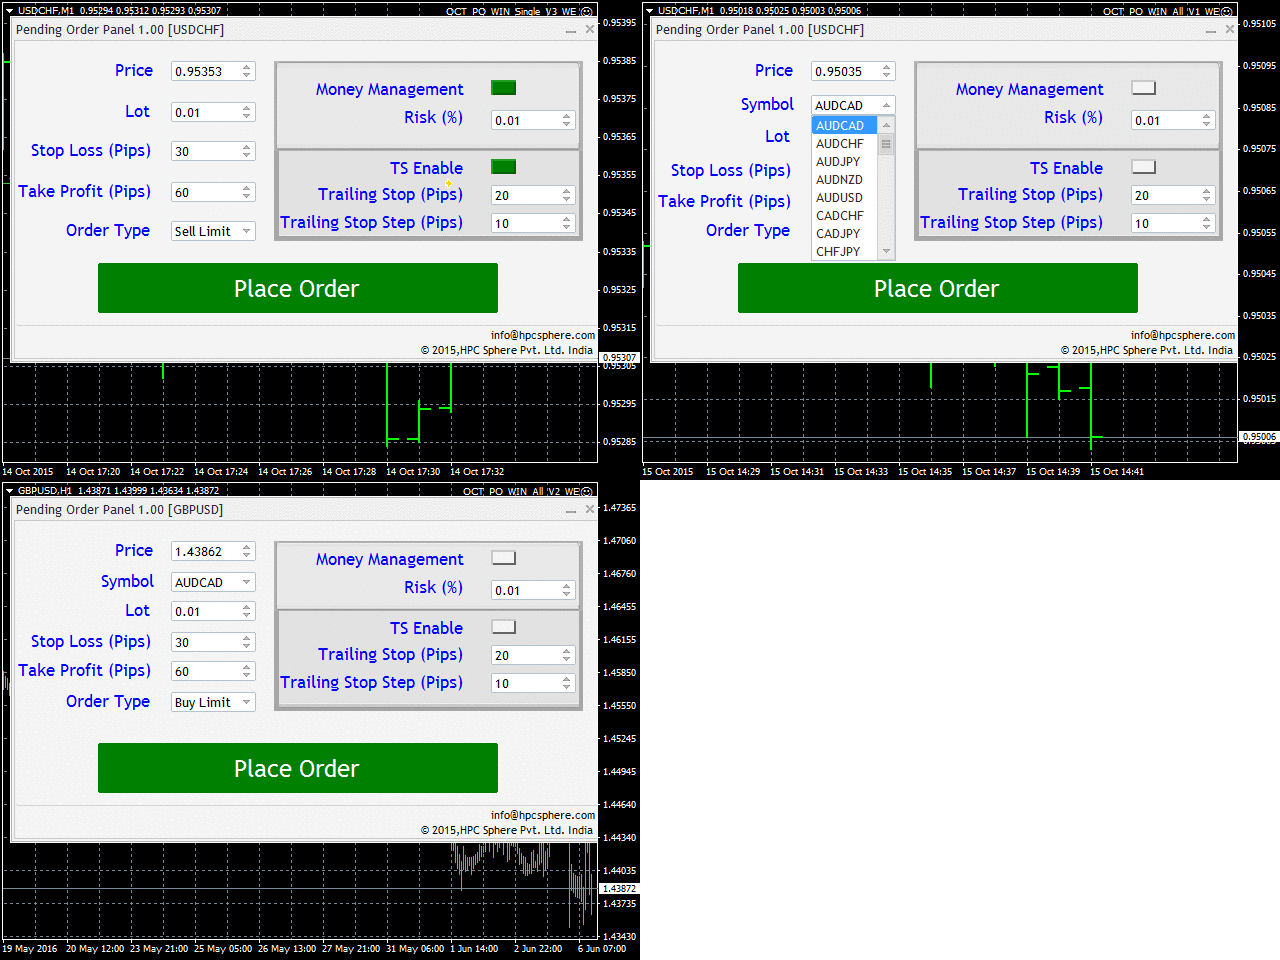
On Chart Trading Pending Order Window ALL Symbols
https://www.mql5.com/en/market/product/12355
The expert advisor (EA) generates an on-chart trading panel to place pending order(s) on any currency-pair symbol, as selected from its drop-down menu. Before clicking "Place" button, to place a pending order (PO).
https://www.mql5.com/en/market/product/12355
The expert advisor (EA) generates an on-chart trading panel to place pending order(s) on any currency-pair symbol, as selected from its drop-down menu. Before clicking "Place" button, to place a pending order (PO).

Anand
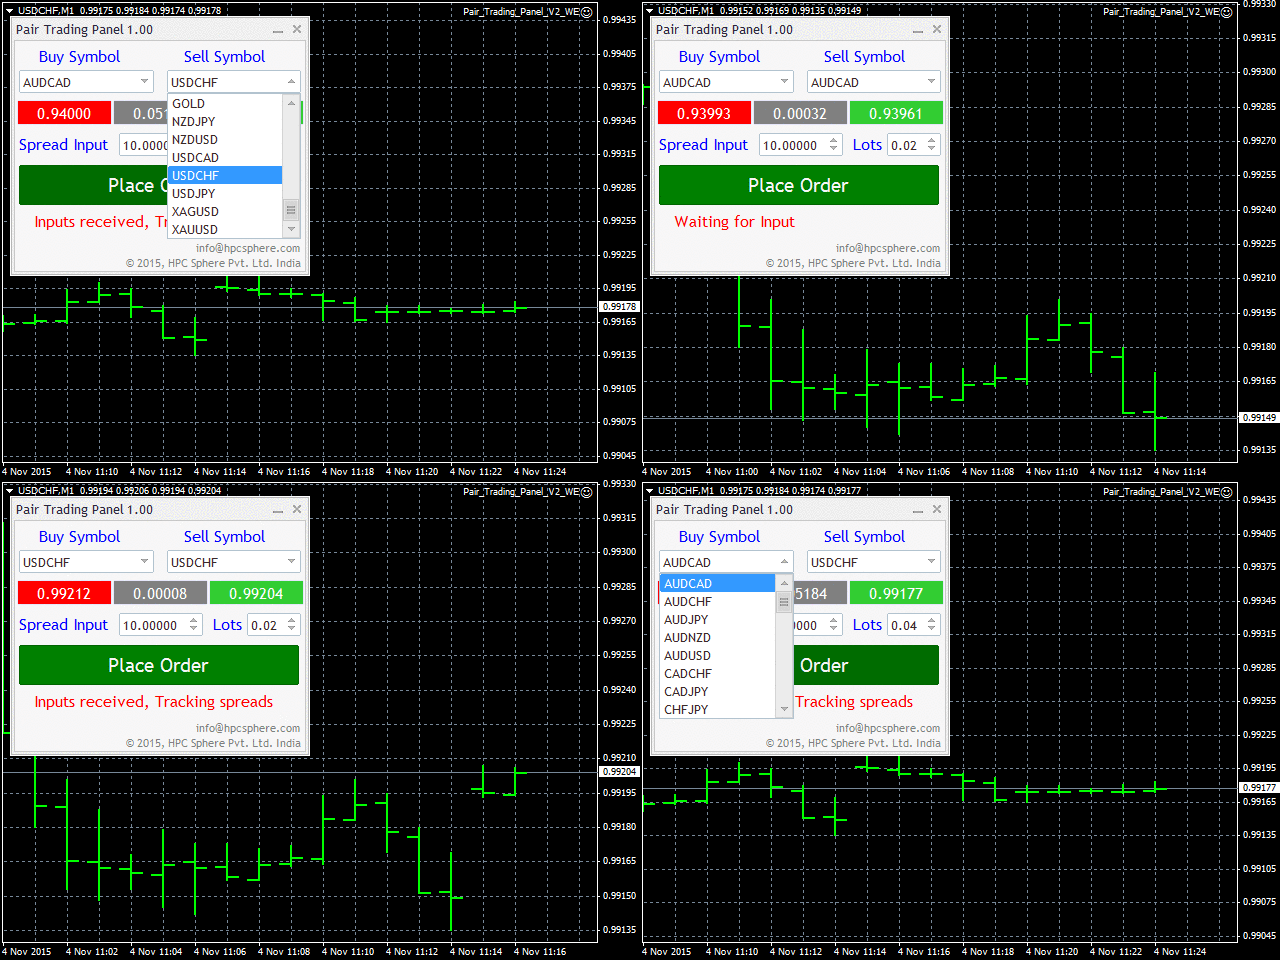
Pair Trading Panel
https://www.mql5.com/en/market/product/12651
The EA simultaneously triggers buy and sell orders whenever desired target 'spread' is achieved. The panel, generated by EA, allows one to select currency pair(s) to trade Buy and Sell orders at a desired lot. A target 'spread' price is entered and 'Place Order' button is clicked. As soon as the chosen target 'spread' is crossed, the EA places orders, that can be manually closed, on observing favorable conditions to exit.

Anand
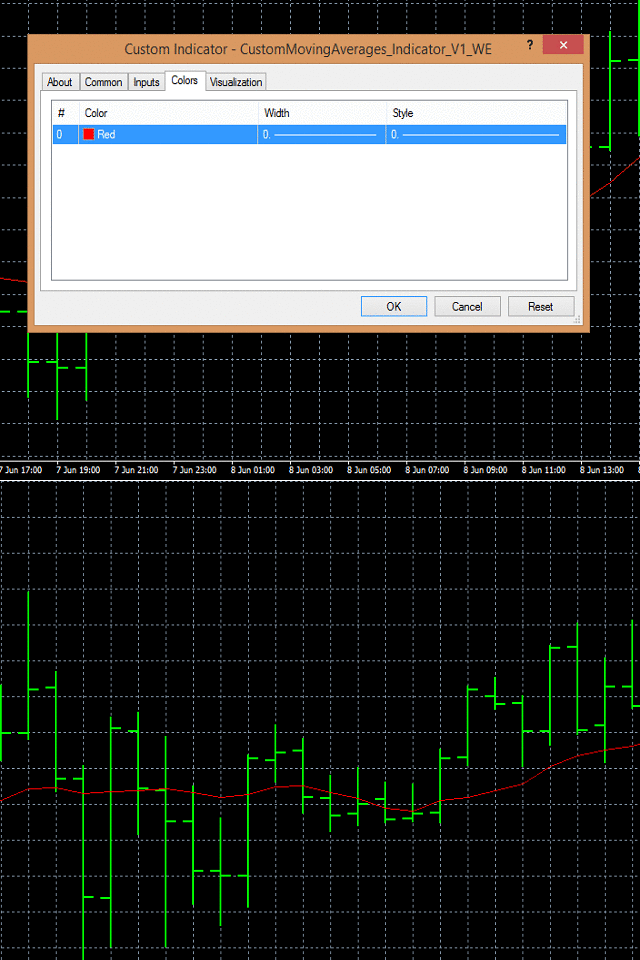
Custom Moving Average Indicator
https://www.mql5.com/en/market/product/16958
Custom Moving Average Indicator can be used to identify the direction of trend or find out potential support and resistance levels. The variable parameters such as period, shift, method and applied price can be modified as per the financial strategy.
https://www.mql5.com/en/market/product/16958
Custom Moving Average Indicator can be used to identify the direction of trend or find out potential support and resistance levels. The variable parameters such as period, shift, method and applied price can be modified as per the financial strategy.

Anand
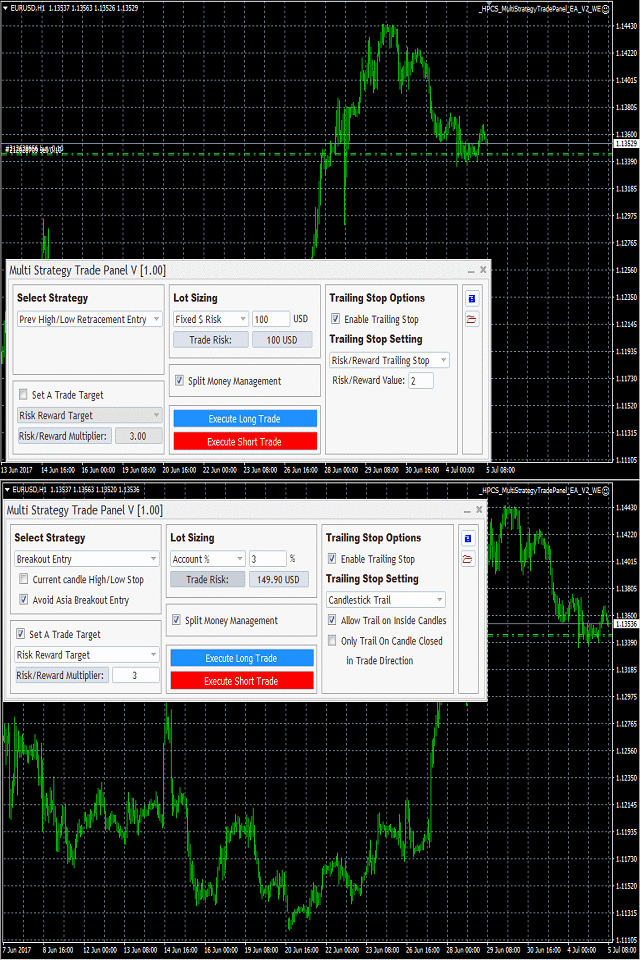
Multi Strategy Trade Panel
https://www.mql5.com/en/market/product/19738
It is one of the most advanced trading panels available.
Its advanced algorithm and feature rich user interface allows you trade on different strategies.
https://www.mql5.com/en/market/product/19738
It is one of the most advanced trading panels available.
Its advanced algorithm and feature rich user interface allows you trade on different strategies.

Anand
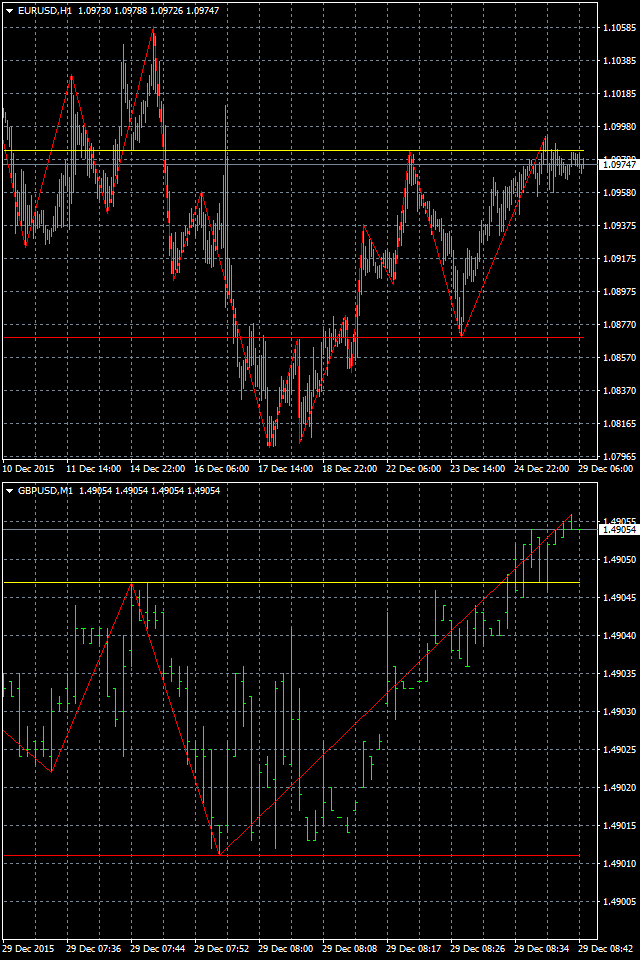
ZigZag Support Resistance Indicator
https://www.mql5.com/en/market/product/13723
This indicator indicates the highest highs, lowest lows of the market.
This indicator makes a pattern of zigzags by observing the changes in the market.
is indicator shows a Support line which observes from the zigzag pattern and places the line accordingly so that the trader can place orders.
This indicator shows a Resistance line which observes from the zigzag pattern and places the line accordingly so that the trader can place orders.

Anand
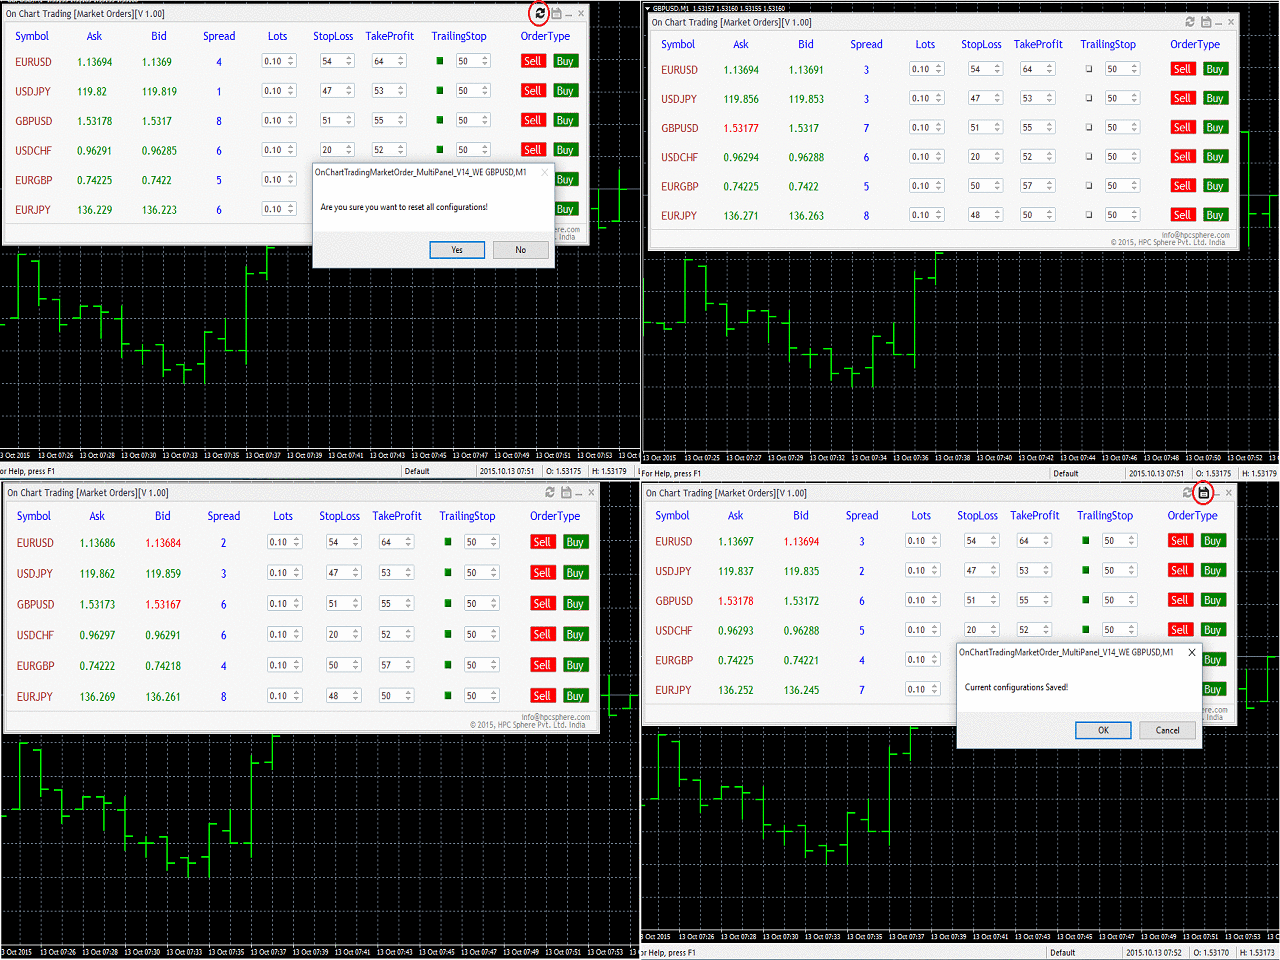
HPC Easy Spread Digger Trade Pad
https://www.mql5.com/en/market/product/12299
This panel is useful for traders dealing with several major symbols at one place (EURUSD, USDJPY, GBPUSD, USDCHF, EURGBP and EURJPY)
Traders can place orders for many symbols clicking a single button
Traders can see the live changes in the symbols (i.e., ask, bid, spread) values in this panel itself
Traders using the same configuration (inputs) for trading can save their configuration and can reset the configuration
Traders can place trades accordingly with the knowledge of live prices of the market and use buttons to simply place a buy/sell order.

Anand
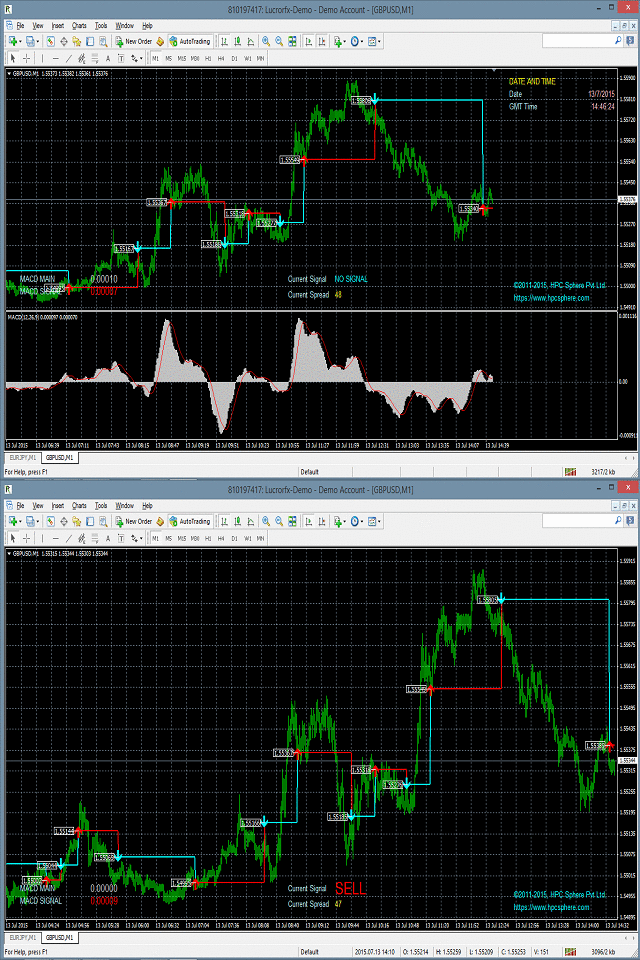
Advance MACD Indicator
https://www.mql5.com/en/market/product/10589
MACD Indicator draws line and arrow in the main chart window to identify the trade opportunity.
The number of bars used for indicator calculation are:
1. FAST EMA PERIOD-12
2. SLOW EMA PERIOD-26
3. SIGNAL SMA PERIOD-9
https://www.mql5.com/en/market/product/10589
MACD Indicator draws line and arrow in the main chart window to identify the trade opportunity.
The number of bars used for indicator calculation are:
1. FAST EMA PERIOD-12
2. SLOW EMA PERIOD-26
3. SIGNAL SMA PERIOD-9

Anand
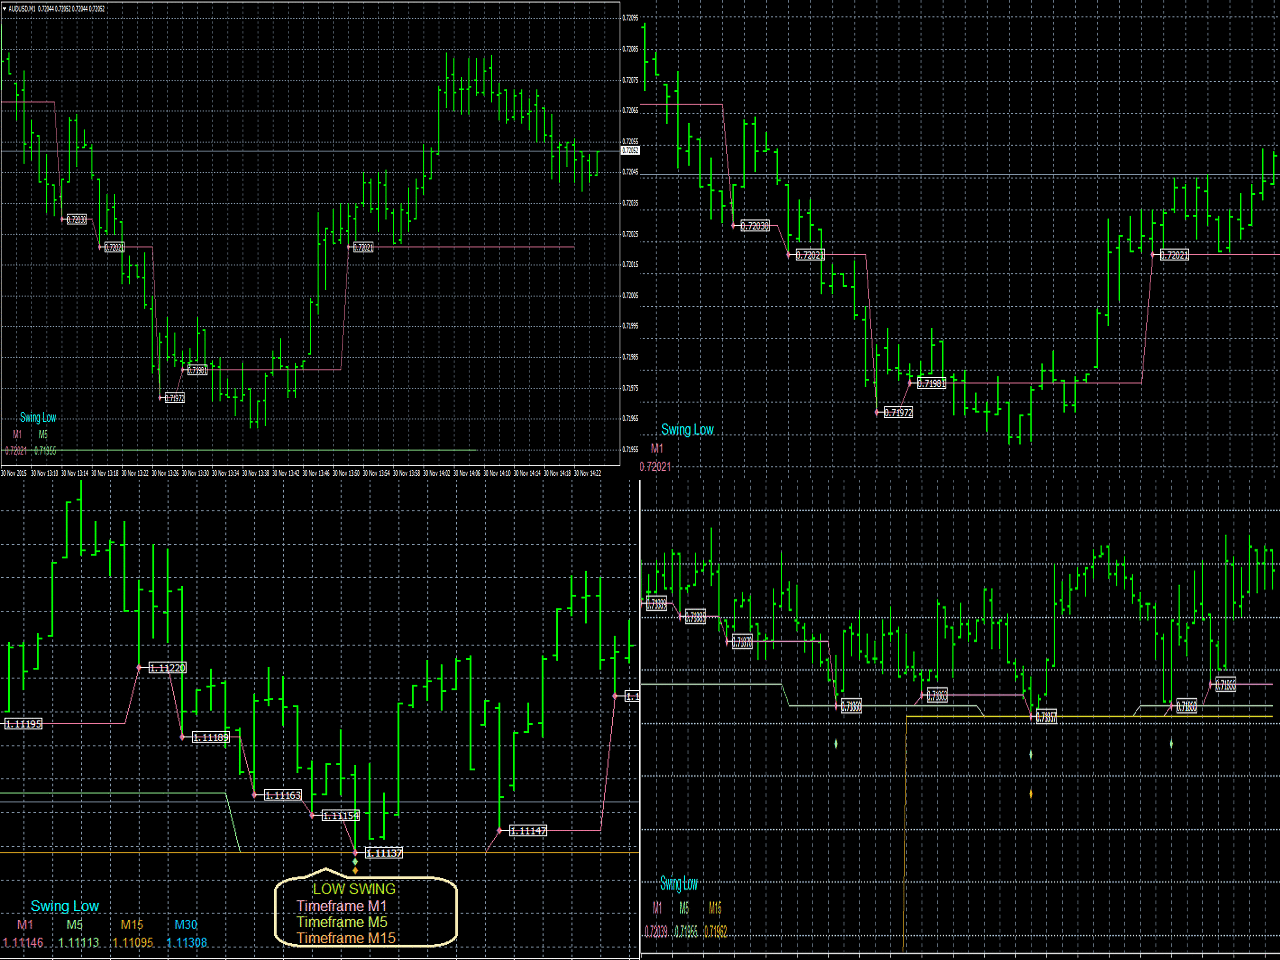
Swing Low Multi Time Frame Indicator
https://www.mql5.com/en/market/product/13139
Swing Low Multi Time Frame Indicator is one of the most advanced indicators based on Swing Low trading strategies. It supports multiple timeframes, i.e. by attaching the indicator on a single chart one can see the Swing Low values for all the other timeframes on a single chart.

Anand
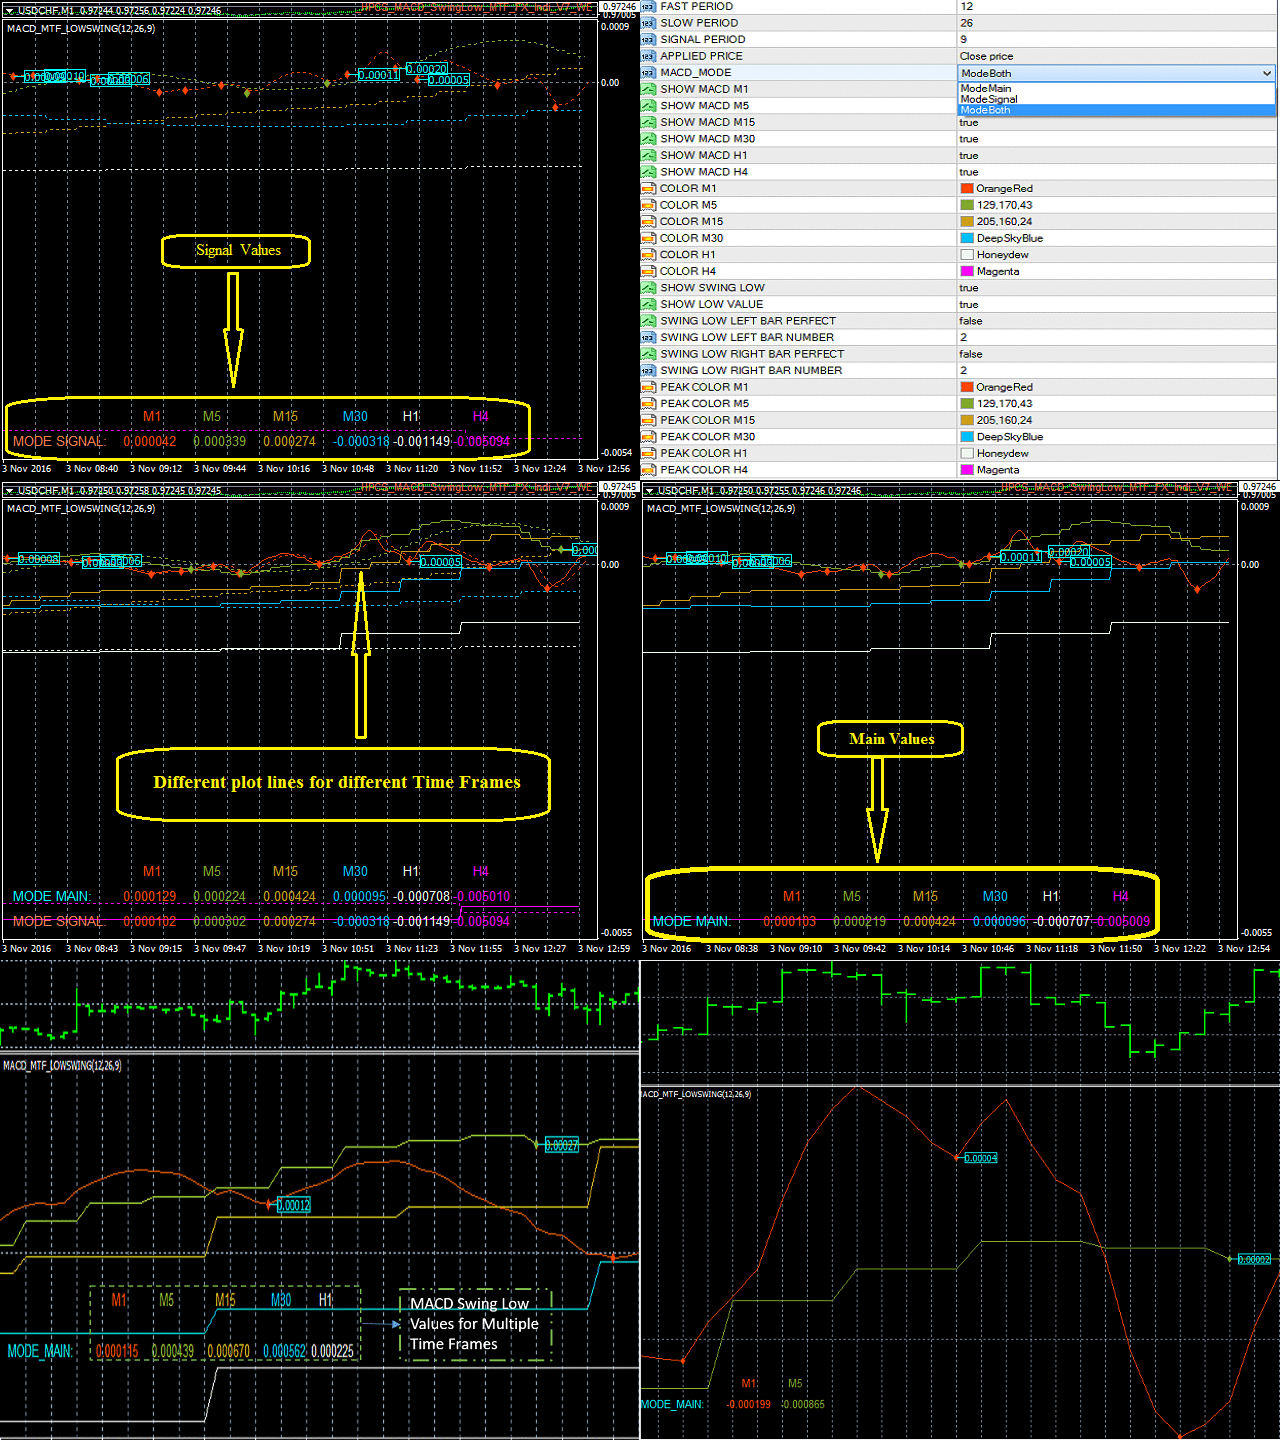
MACD Swing Low Multi Time Frame Indicator
https://www.mql5.com/en/market/product/13283
MACD Swing Low Multi Time Frame Indicator is one of the most advanced indicators based on both Swing Low and MACD trading strategies. It supports multiple timeframes, i.e. by attaching the indicator on a single chart, one can see the MACD Swing Low values for all the other timeframes on a single chart. One would just have to select the timeframes, for which he wants to see the calculated values.

Anand
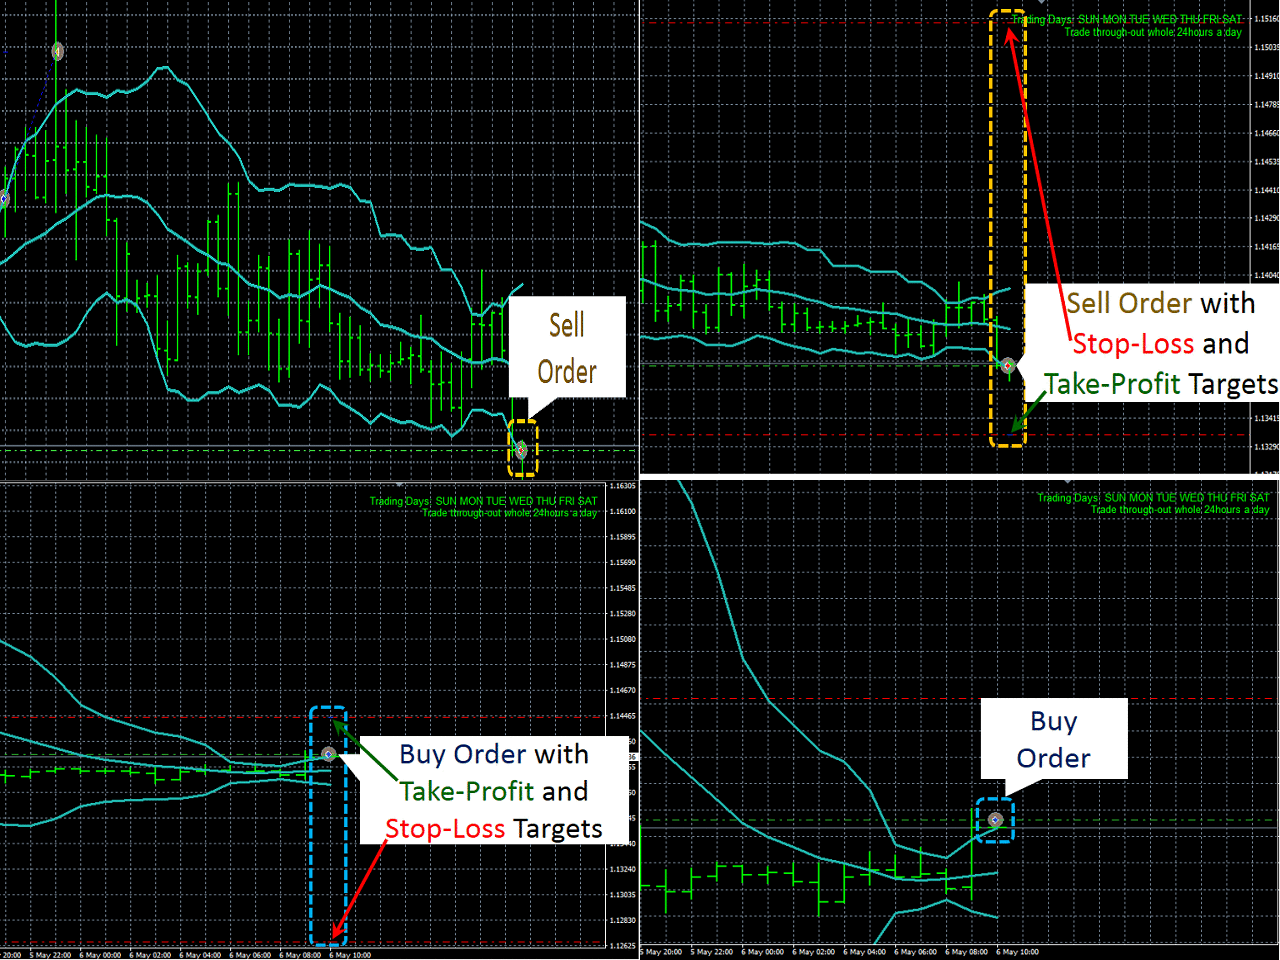
BollingerBandsIndi Based MO FX EA
https://www.mql5.com/en/market/product/16489
This is an expert advisor (EA), created in Meta-Trader 4 (MT4). It is mainly based on Bollinger bands and optionally use average true range (ATR) indicator for signal entry or exit
https://www.mql5.com/en/market/product/16489
This is an expert advisor (EA), created in Meta-Trader 4 (MT4). It is mainly based on Bollinger bands and optionally use average true range (ATR) indicator for signal entry or exit

Anand
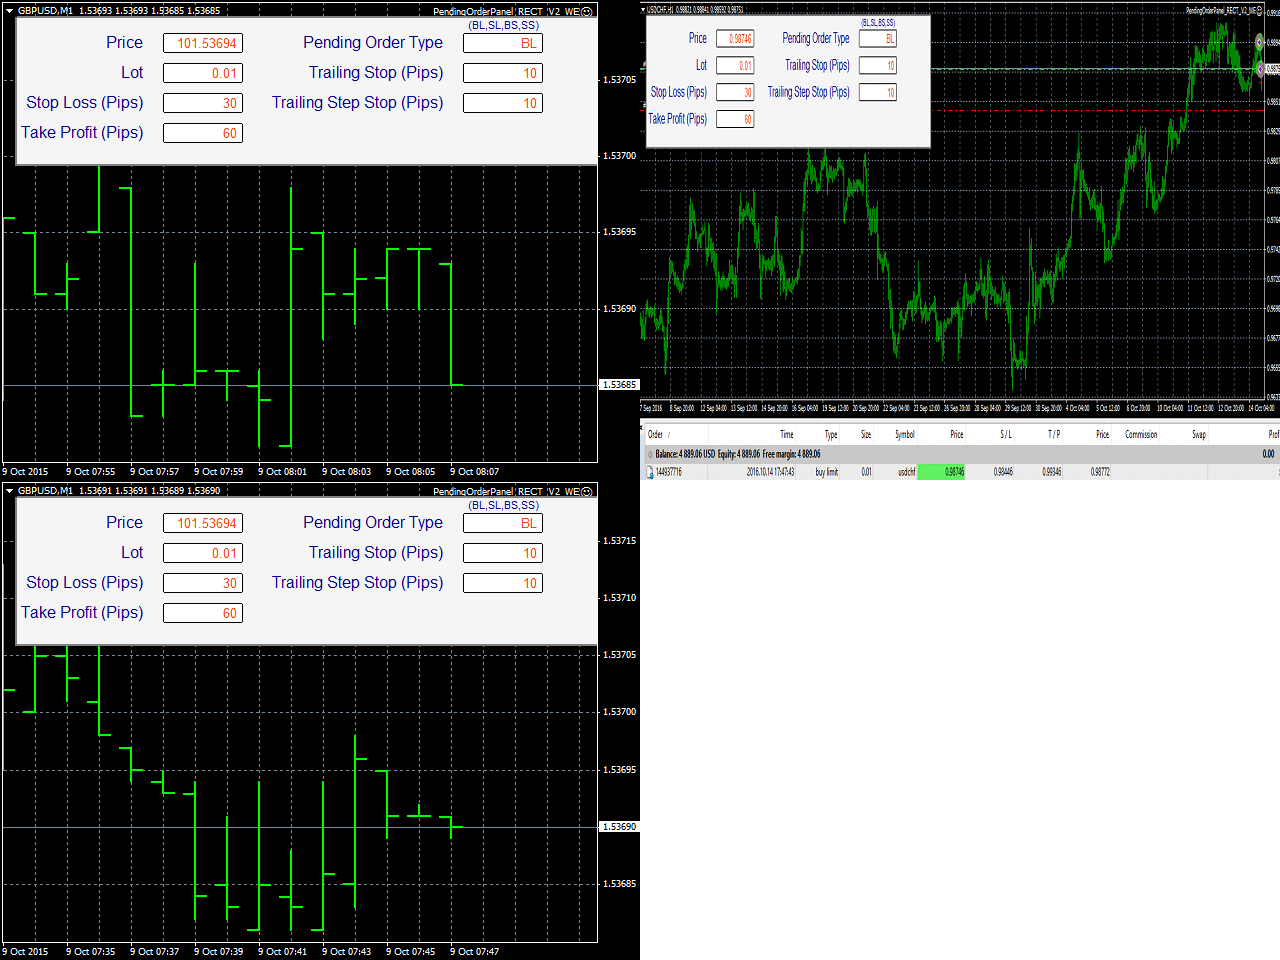
Pending Order Panel https://www.mql5.com/en/market/product/12227 Pending Order Panel is an automated trading panel which automatically places pending orders.

Anand
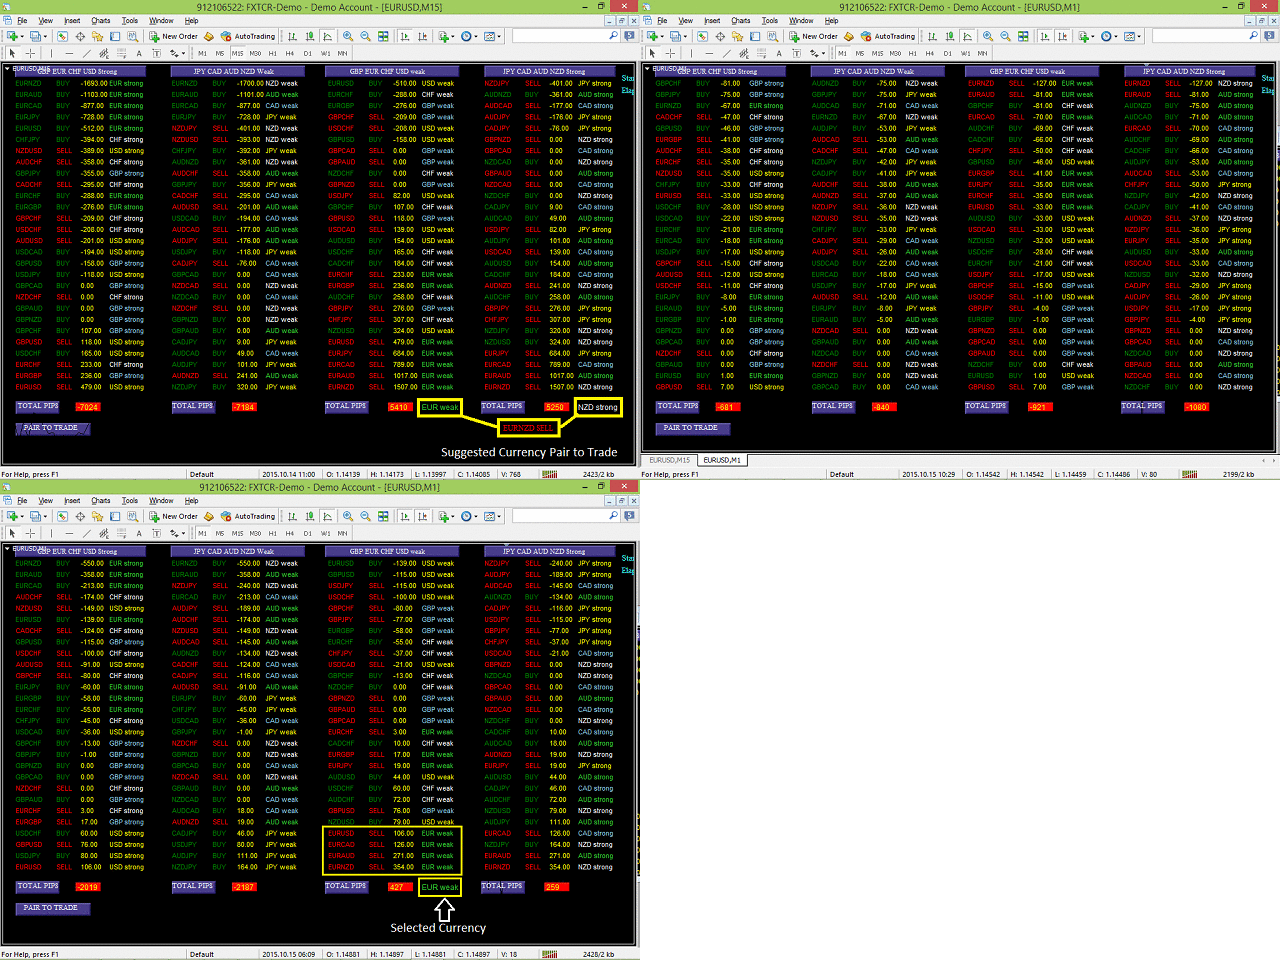
Trade Pair Optimization Dashboard
https://www.mql5.com/en/market/product/10741
When attached to a chart, it creates a dashboard, that displays profit/loss (in pips) information for different currency pairs with buy or sell trade operation. Profit or loss is calculated, assuming all the shown currency pairs are traded (as per displayed trade type) at the time the script is attached to a chart.

Anand
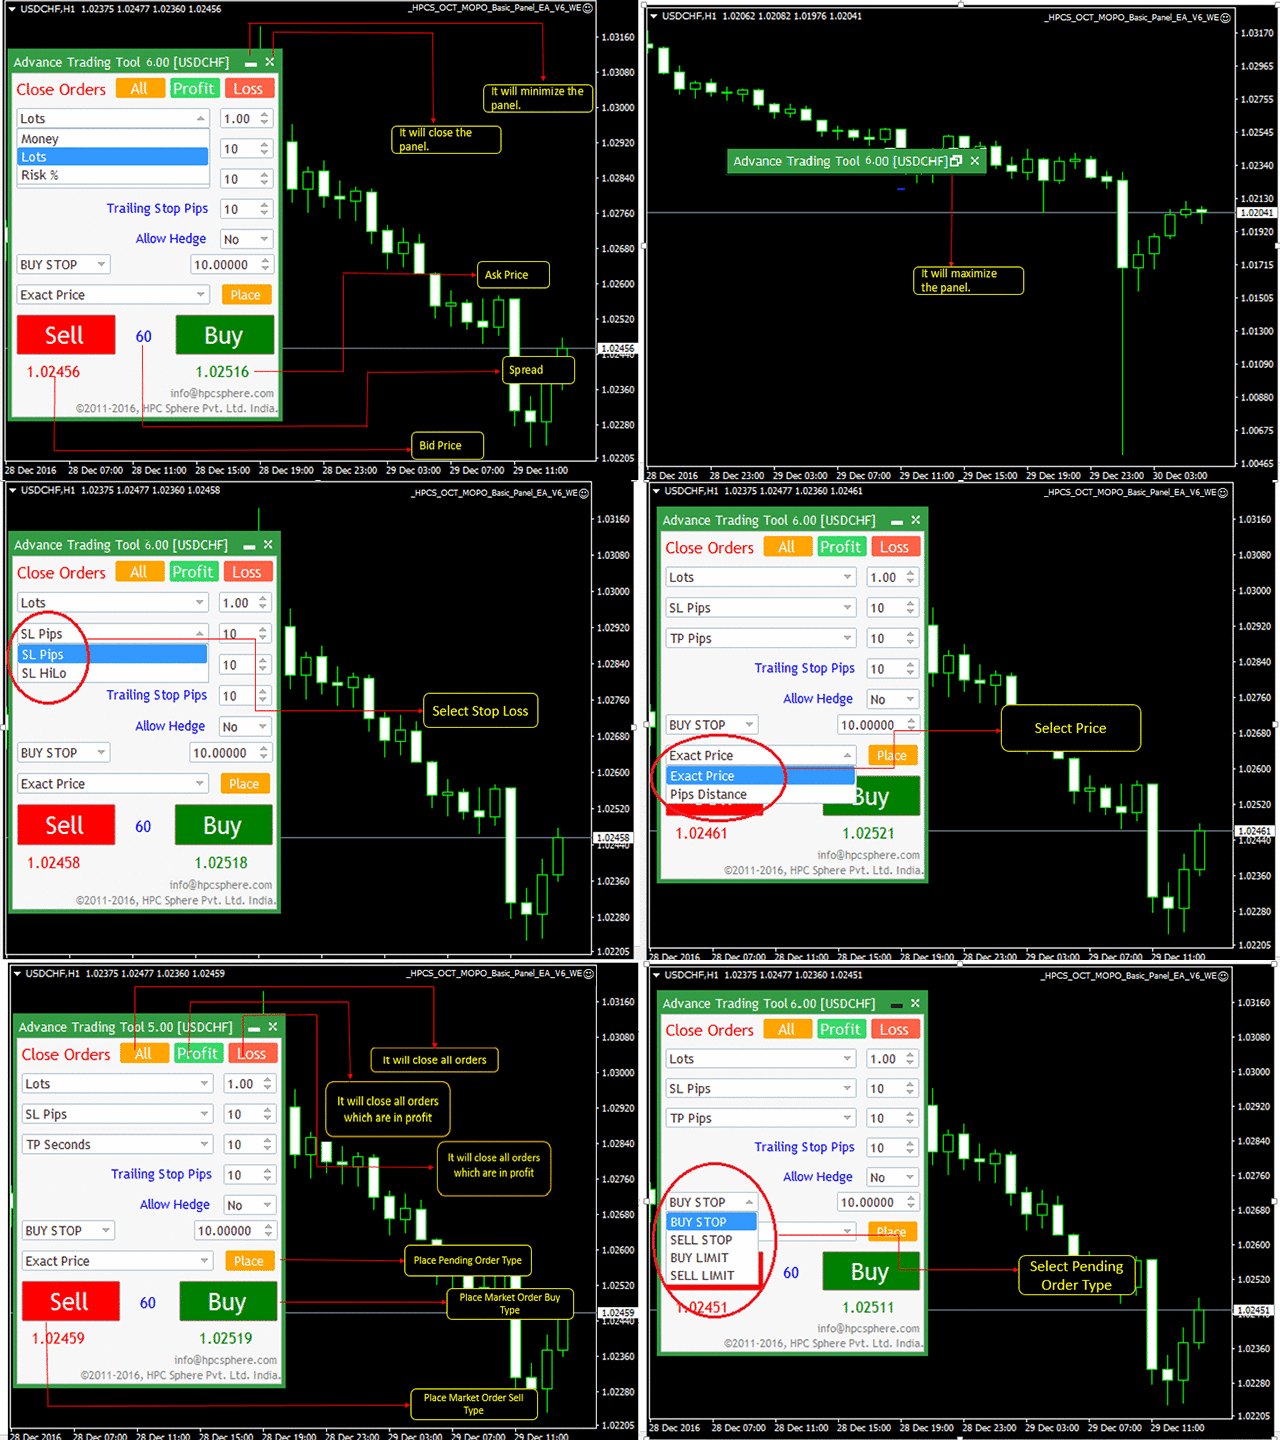
HPC Smart Traders Panel
https://www.mql5.com/en/market/product/23803
This panel is a one stop solution to all your trading problems
Trading made easy. This panel allows trader to place orders (instant or pending) and close the respective orders (ALL, PROFIT, LOSS) just from one panel
Traders can use it to make any type of trade on the chart itself

: