Trend Scalper MT4
- インディケータ
- バージョン: 1.1
- アップデート済み: 26 6月 2023
- アクティベーション: 5

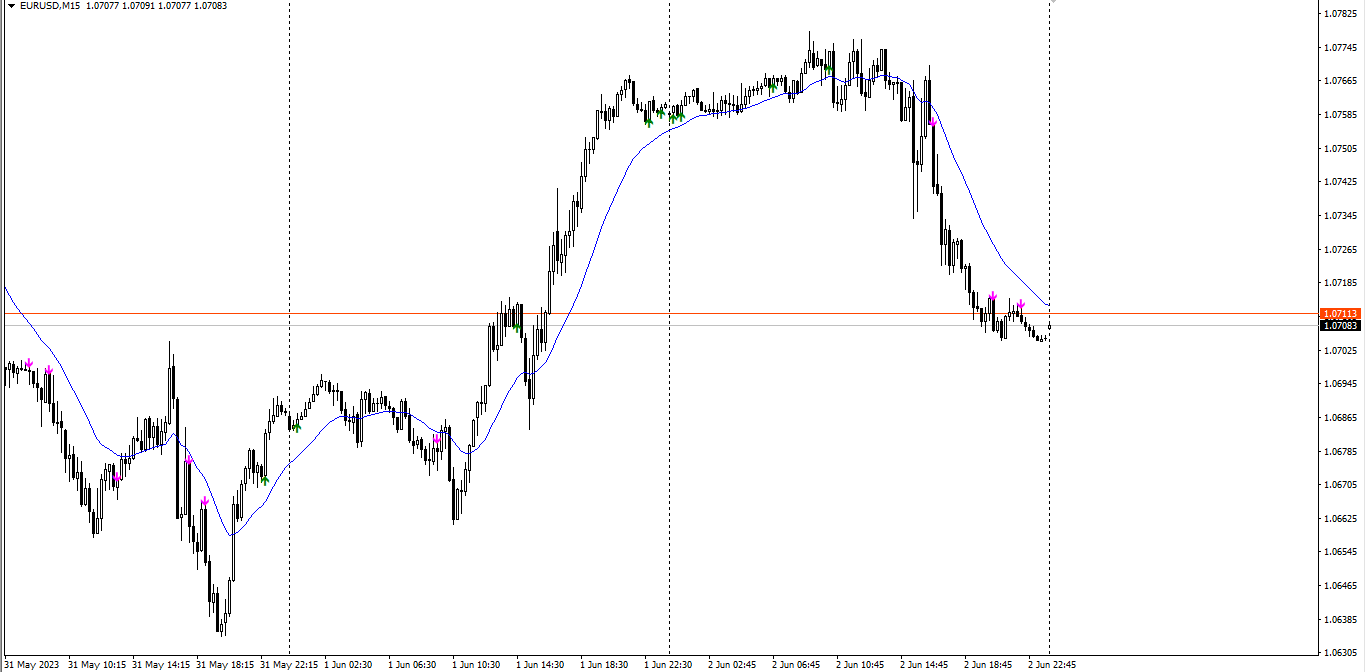
Indicator show best signals for buy and sell orders.
Indicator uses only 3 inputs:
DEMA Fast Period - fast double exponential moving average period
DEMA Slow Period - slow double exponential moving average period
DEMA Trend Period - trend double exponential moving average period
Position of price according to trend double double exponential moving average and crossings of fast and slow double double exponential moving averages shows buy and sell signals, which are drawn as green and magenta arrows respectively.