Market Rider Tools MT5
- インディケータ
- Stefan Petkov
- バージョン: 1.0
- アクティベーション: 10
An Ultimate Tool for quick and efficient market analysis. Unique combination of solid indicators defining market direction for trend tracking and filtration designed for you to stay on the right side of the market.
Market Rider Tools gives you access to one of the most used from professional trades indicators on worldwide, which were not build in for MT4 and MT5 terminals . These are unique non-repainting indicators
designed to be used on all time frames for all instruments classes: Forex, CFDs, Futures, Crypto and Stock equities (all instruments offered in Metatrader terminals).
To complete the full market analysis supported by various world known oscillators used by numerous professional traders you should use Market Rider Oscillators
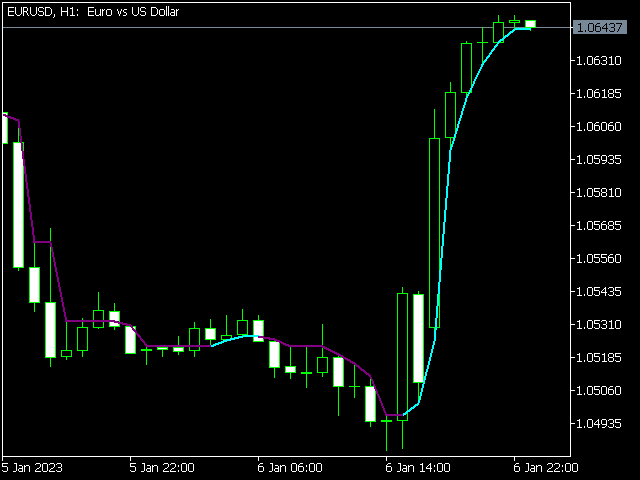
- ClearMethod
- Gann_Hilo
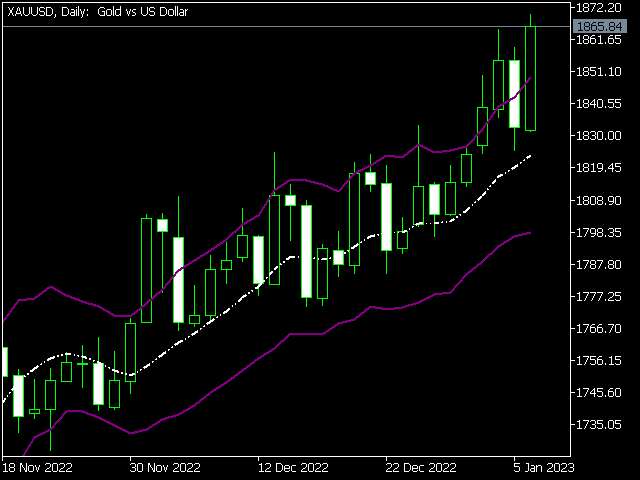
- Keltner channel
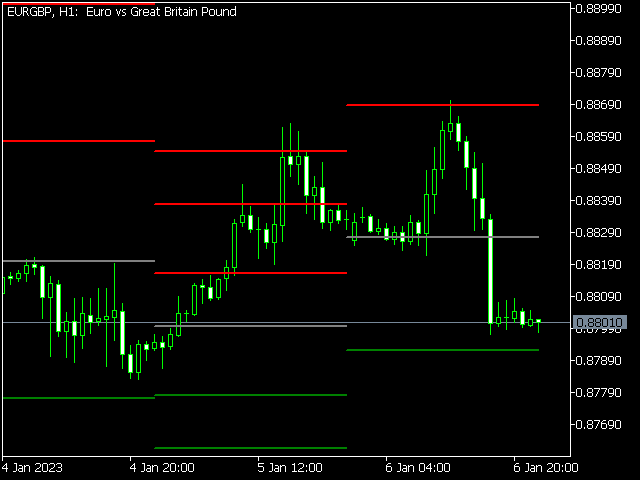
- HighsLows
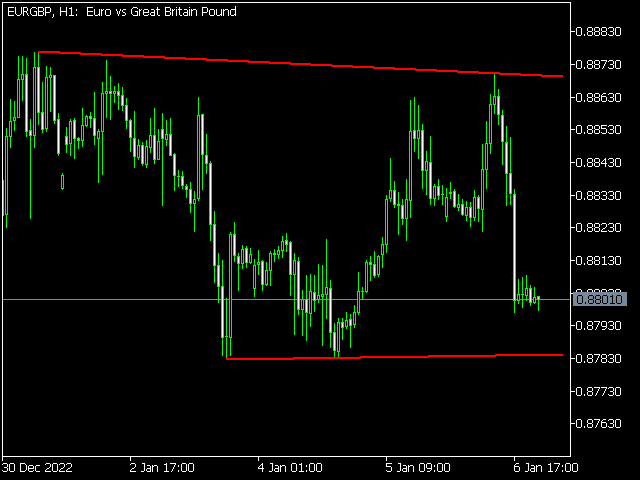
- Automatic Trendlines
- Average Price Per Bar
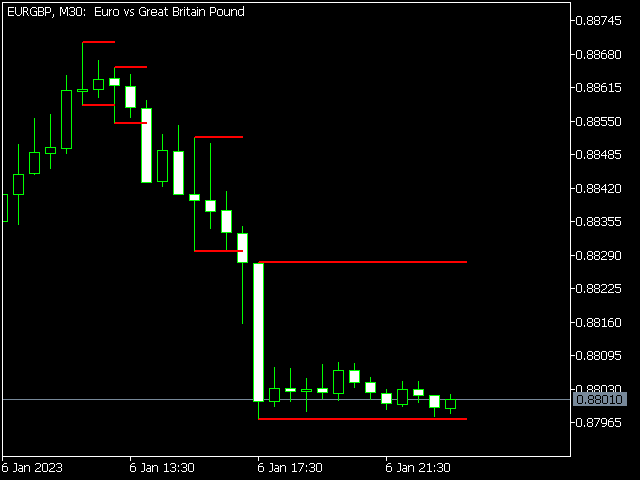
- High Low Per N Bars
- InsideBars
- Pivot Points
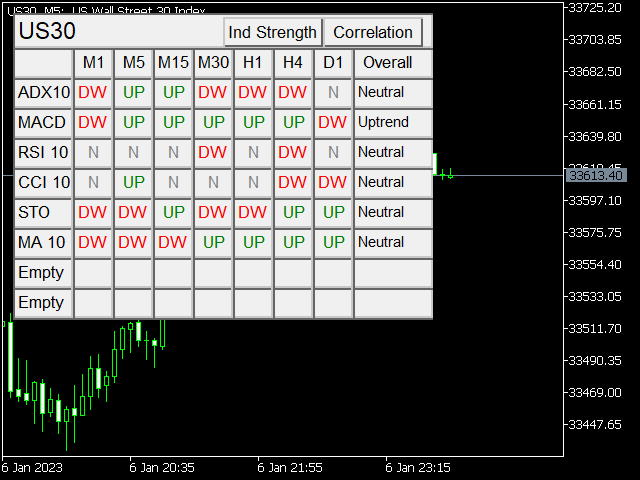
- Currency Correlation Monitoring
- Indicator Strength Analysis
Complete guide of the indicators and instructions for using them: https://www.mql5.com/en/blogs/post/751377
You can find MT4 version here : https://www.mql5.com/en/market/product/92082
First 10 buyers of Market Rider Tools will receive Market Rider Oscillators for free !