• 概要
  • レビュー
  • コメント

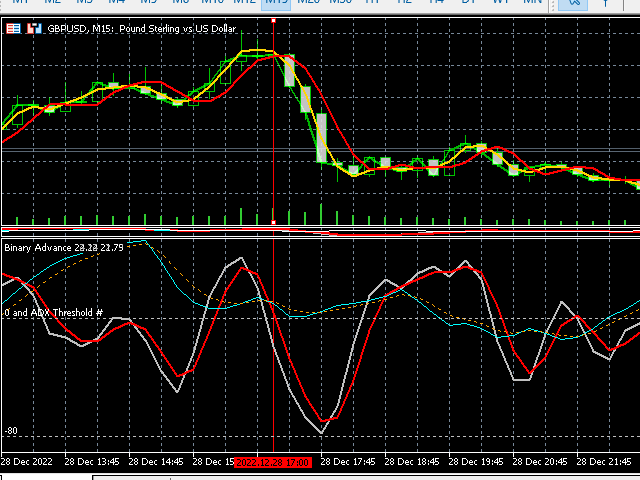
Binary Advance Light version

This is a Lite version of my Binary Wave Advance Oscillating indicator: https://www.mql5.com/en/market/product/90734

It reduces the less useful indicators, while keeping it's predictive modifications to make each indicator within better than their stock counter part. I reduced it and made it simpler, in the hopes it would be less overwhelming and more approachable.

Contains:

  • ADX
  • Chaikin
  • Money Flow Index

Each have separate smoothing controls to tame faster periods, as well as the Main has it's own smoothing period, so you could double smooth the values, if desired. The ADX line has a signal for use with trigger points of when the market is ready to reverse it's trend or force, etc. Signal line just makes it easier to keep track of.

This is by no means a stock indicator. The predictive/pre-emptive moving nature alone in each one has to be worth some value to your charts, perhaps. Any other details can be read on the Advanced version of this indicator. Thank you.

おすすめのプロダクト
Modified Rainbow
Rafael Alejandro Rey Alves
Modified Rainbow   The Modified Rainbow indicator is intended to work in different scenarios. The indicator uses a combination of technical indicators to detect buy or sell opportunities (different Moving Averages and other technical indicators). The indicator works with any currency pair, stocks, cryptocurrencies and synthetic indices. The indicator can be used for both traditional trading and binary options. The indicator works with any time frame, from M1 to MN. When the blue arrow
30 USD
Alpha Binary Pro
Rafael Alejandro Rey Alves
1 (1)
The Alpha Binary Pro indicator is intended to work in different scenarios. This indicator uses a combination of technical indicators to detect buy or sell opportunities. The indicator works with any currency pair, stocks, cryptocurrencies and synthetic indices. The indicated can be used for both traditional trading and binary options. The indicator works with any time frame, from M1 to MN. When the blue arrow is pointing upwards this indicates that the signal is to buy. When the red
30 USD
Noize Absorption Index - is the manual trading system that measures the difference of pressure between bears forces and bulls forces. Green line - is a noize free index that showing curent situation. Zero value of index shows totally choppy/flat market.Values above zero level shows how powerfull bullish wave is and values below zero measures bearish forces.Up arrow appears on bearish market when it's ready to reverse, dn arrow appears on weak bullish market, as a result of reverse expectation.
199 USD
The indicator generates early signals basing on ADX reading data combined with elements of price patterns. Works on all symbols and timeframes. The indicator does not redraw its signals. You see the same things on history and in real time. For better visual perception signals are displayed as arrows (in order not to overload the chart). Features The best results are obtained when the indicator works on two timeframes. For example: M30 – the indicator shows the main trend; M5 – the indicator ge
30 USD
Improved version of the free HMA Trend indicator (for MetaTrader 4) with statistical analysis. HMA Trend is a trend indicator based on the Hull Moving Average (HMA) with two periods. HMA with a slow period identifies the trend, while HMA with a fast period determines the short-term movements and signals in the trend direction. The main differences from the free version: Ability to predict the probability of a trend reversal using analysis of history data. Plotting statistical charts for analyz
30 USD
A powerful oscillator that provide Buy and Sell signals by calculating the investor liquidity. The more liquidity the more buy possibilities. The less liquidity the more sell possibilities. Please download the demo and run a backtest! HOW IT WORKS: The oscillator will put buy and sell arrow on the chart in runtime only . Top value is 95 to 100 -> Investors are ready to buy and you should follow. Bottom value is 5 to 0 -> Investors are ready to sell and you should follow.
49 USD
PipFinite Trend PRO MT5
Karlo Wilson Vendiola
4.86 (657)
Breakthrough Solution For Trend Trading And Filtering With All Important Features Built Inside One Tool! Trend PRO's smart algorithm detects the trend, filters out market noise and gives entry signals with exit levels. The new features with enhanced rules for statistical calculation improved the overall performance of this indicator. Important Information Revealed Maximize the potential of Trend Pro, please visit www.mql5.com/en/blogs/post/713938 The Powerful Expert Advisor Version Automa
98 USD
Volality Index scalper indicator  Meant for Volality pairs such as Volality 10, 25, 50, 75 and 100 The indicator works on all timeframes from the 1 minute to the monthly timeframe the indicator is non repaint the indicator has 3 entry settings 1 color change on zero cross 2 color change on slope change 3 color change on signal line cross Orange line is your sell signal Blue line is your buy signal.
35 USD
Magic Channel MT5は、MetaTrader5ターミナルのチャネルインジケーターです。この指標により、最も可能性の高いトレンド反転ポイントを見つけることができます。 ほとんどのチャネルインジケータとは異なり、Magic Channelは再描画しません。 アラートシステム(アラート、電子メール、プッシュ通知)は、複数の取引商品を同時に監視するのに役立ちます。 インジケーターをチャートに添付すると、シグナルが発生するとアラートがトリガーされます。 私たちのアラートシステムを使用すると、単一のポジション開始信号を見逃すことはありません! 利点 スキャルピングに最適です。 トレンドの逆転を特定するのに最適です。 初心者や経験豊富なトレーダーに適しています。 すべての時間枠で動作します。 インジケーターは再描画されません。 柔軟なアラートシステム。 チャートのカスタマイズ(線のサイズと色)。 使用上の推奨事項 価格がインジケーターの下線を上向きに横切ったときに購入します(スクリーンショット1を参照、エントリーポイントは丸で囲まれています)。 価格が
35 USD
Magic Finger can help you identify trends and trading opportunities clearly. The finger points to the open position signal, and the discoloration line is confirmed by the trend. If you are a day trader, you can choose to trade during a period of active trading, referring to the discoloration line as the basis for the next order, finger signal as a filter. If you are a trend trader, you can choose a period above H1, wait for the appearance of the finger signal in the key price area, and enter
188 USD
Alpha Trend MT5 is a trend indicator for the MetaTrader 5 platform; it has been developed by a group of professional traders. The Alpha Trend MT5 indicator finds the most probable tendency reversal points, which allows making trades at the very beginning of a trend. This indicator features notifications, which are generated whenever a new signal appears (alert, email, push-notification). This allows you to open a position in a timely manner. Alpha Trend does not redraw, which makes it possible t
35.90 USD
PipFinite Exit EDGE MT5
Karlo Wilson Vendiola
4.88 (34)
Did You Have A Profitable Trade But Suddenly Reversed? In a solid strategy, exiting a trade is equally important as entering. Exit EDGE helps maximize your current trade profit and avoid turning winning trades to losers. Never Miss An Exit Signal Again Monitor all pairs and timeframes in just 1 chart www.mql5.com/en/blogs/post/726558 How To Trade You can close your open trades as soon as you receive a signal Close your Buy orders if you receive an Exit Buy Signal. Close your Sell orde
88 USD
このインジケーターは、チャート上のすべての注文 (トランザクション/注文ラインにクローズ) に対して既に設定した TP および SL 値 (その通貨で) を表示し、すべての注文の利益と損失を見積もるのに大いに役立ちます。また、PIP 値も表示されます。表示されている形式は、「利益または損失の通貨値 / PIP 値」です。 TP 値は緑色で表示され、SL 値は赤色で表示されます。 ご質問や詳細については、fxlife.asia@hotmail.com で販売者にお気軽にお問い合わせください。 (そして、近日中にインジケータに追加される次の機能は、「自動または半自動の TP および SL 設定」であり、お客様は無料で更新バージョンを入手できます。よろしくお願いします。) (または、表示に何か機能を追加すべきだと思われる場合は、お気軽にお申し付けください)
99 USD
Renko Gold
Ignacio Agustin Mene Franco
Renko Gold! clearly indicates the floors and ceilings where it goes from 4 lines, the line below that marks the floor in green confirming with the thinnest line clarifies the purchase entry, the same is for sale, the top line marks the ceiling and the thinnest red line marks the sale, This indicator works for all temporalities! For Forex and Synthetic Indices markets! It also works for crypto markets! Good profit! World Investor.
40 USD
An indicator of pattern #31 ("Long Island") from Encyclopedia of Chart Patterns by Thomas N. Bulkowski. The second gap is in the opposite direction. Parameters: Alerts - show alert when an arrow appears   Push - send a push notification when an arrow appears (requires configuration in the terminal) GapSize - minimum gap size in points ArrowType - a symbol from 1 to 17 ArrowVShift - vertical shift of arrows in points   ShowLevels - show levels ColUp - color of an upward line ColDn - color of a
30 USD
Follow The Line MT5
Oliver Gideon Amofa Appiah
4.26 (23)
This indicator obeys the popular maxim that: "THE TREND IS YOUR FRIEND" It paints a GREEN line for BUY and also paints a RED line for SELL. (you can change the colors). It gives alarms and alerts of all kinds. IT DOES NOT REPAINT and can be used for all currency pairs and timeframes. Yes, as easy and simple as that. Even a newbie can use it to make great and reliable trades. NB: For best results, get my other premium indicators for more powerful and reliable signals. Get them here: https://www.m
FREE
A scalping indicator based on mathematical patterns, which on average gives signals with relatively small SL, and also occasionally helps to catch big moves in the markets (more information in the video) This indicator has three main types of notifications: The first type warns of a possible/upcoming signal on the next bar The second type indicates the presence of a ready signal to enter the market/open a position The third type is for SL and TP levels - you will be notified every time price r
1 350 USD
The trend is your friend! Look at the color of the indicator and trade on that direction. It does not  repaint. After each candle is closed, that's the color of the trend. You can focus on shorter faster trends or major trends, just test what's most suitable for the symbol and timeframe you trade. Simply change the "Length" parameter and the indicator will automatically adapt. You can also change the color, thickness and style of the lines. Download and give it a try! There are big movements
99 USD
Be notified of every color change of Heiken Ashi (HA) candles. The indicator will trigger past and new signals every time that HA candles change their colors. ( Note : this tool is based on the code of Heiken Ashi indicator developed by MetaQuotes Software Corp.) Features The signals are triggered at closing of last bar/opening of a new bar; Any kind of alerts can be enabled: Dialog Box, Email message, SMS notifications for smartphones and tablets, and Sound alerts; By default, up arrows are p
35 USD
プレミアムレベルは、正しい予測の精度が80%を超える独自の指標です。 この指標は、最高のトレーディングスペシャリストによって2か月以上テストされています。 あなたが他のどこにも見つけられない作者の指標! スクリーンショットから、このツールの正確さを自分で確認できます。 1は、1キャンドルの有効期限を持つバイナリーオプションの取引に最適です。 2はすべての通貨ペア、株式、商品、暗号通貨で機能します 手順: 赤い矢印が表示されたらすぐにダウントレードを開き、青い矢印が表示されたら閉じます。青い矢印の後に開くこともできます。 試してテストしてください!推奨設定はデフォルトです! 日足チャートで最高の精度を示します! インディケータは、2600 Pipsの収益性に対して、約10Pipsという非常に小さなマージンを使用します。
1 100 USD
Laguerre SuperTrend Clouds   adds an Adaptive Laguerre averaging algorithm and alerts to the widely popular SuperTrend indicator. As the name suggests,   Laguerre SuperTrend Clouds (LSC)   is a trending indicator which works best in trendy (not choppy) markets. The SuperTrend is an extremely popular indicator for intraday and daily trading, and can be used on any timeframe. Incorporating Laguerre's equation to this can facilitate more robust trend detection and smoother filters. The LSC uses the
30 USD
The Universal Trend indicator was created to detect trends in price movement and allows you to quickly determine not only the direction of the trend, but also understand the levels of interaction between buyers and sellers. The indicator works on all timeframes and currency pairs. The indicator gives fairly accurate signals and it is customary to use it both in trending and flat markets. It is advisable to use the indicator in combination with other tools for more reliable signals and making a
111 USD
Support & Resistance indicator is a modification of the standard Bill Williams' Fractals indicator. The indicator works on any timeframes. It displays support and resistance levels on the chart and allows setting stop loss and take profit levels (you can check the exact value by putting the mouse cursor over the level). Blue dashed lines are support level. Red dashed lines are resistance levels. If you want, you can change the style and color of these lines. If the price approaches a support lev
30 USD
MT5インジケーター。 3つのレベルのフィボナッチサポートとレジスタンスレベルが自動的に描画されます。 彼らです: 月レベル:ミディアムオーキッド ウィークリーレベル:オレンジレッド デイラインレベル:ターコイズ 色はパラメータで調整できます。 この指標は主に、より良いトレード分析のために将来のサポートとレジスタンスレベルを分析するために使用されます。 サポートレベルが何度も効果的にサポートされている場合、市場は以前の最高点を突破し、効果的なトレンドブレイクアウトは長くなります。 下降後、市場は何度も圧力レベルを超えることはできず、その後下降して以前の低価格を再び突破し、効果的なトレンドはショートポジションを突破します。 市場が過去の高値または安値の領域に達すると、チャートには2レベルのFibonacii線のみが描画され、インジケーターは市場の特定のスペースを待つ必要があるため、通常のレベルのプロンプトは表示されません。描画する前に引き戻すには、インジケーターが自動的に描画します。高価格帯でのフィルター処理された小さな変動は、短期間の有効なサポ
40 USD
Buy Sell Strength (BSS) is a technical analysis oscillator, showing bullish (buy) and bearish (sell) strength by comparing upward and downward stock momentum movements. The BSS is easy to interpret: 1. When BBS Histogram is Green, it is bullish, when it is Red, it is bearish. 2. BSS is considered overbought when it is closer to Top Line and oversold when it is closer to Bottom Line. 3. When it shows Buy signal near the Bottom line, it is a more reliable signal. 4. Sound, Pop-up message, Push
35 USD
This is an advanced multi-timeframe version of the popular Hull Moving Average (HMA) Features Two lines of the Hull indicator of different timeframes on the same chart. The HMA line of the higher timeframe defines the trend, and the HMA line of the current timeframe defines the short-term price movements. A graphical panel with HMA indicator data from all timeframes at the same time . If the HMA switched its direction on any timeframe, the panel displays a question or exclamation mark with a tex
30 USD
トレンドサイド - トレンドを決定するためのテクニカル指標。これは、いくつかの本格的な取引戦略のセットです。このインジケーターは、高度なトレンド フィルタリング システムを使用し、統計パネルを備え、エントリー レベルとエグジット レベルを計算し、動的トレーリング ストップ レベルを計算します。あらゆるタイプのシンボルに適しており、シグナルと結果を再描画しません。プロのトレンド取引のための包括的なツール。 トレンド サイド インディケータのセットには、Andrews トレンド スキャナも含まれています - マルチ通貨およびマルチタイムフレーム トレンド スキャナ、通貨強度アナライザ、可能な反転の分析を備えたマルチタイムフレーム トレンド アナライザ。 3 つのトレンド アナライザーが 1 つの製品に組み込まれています。 インジケーターを購入した後、私に連絡して無料のアンドリュース トレンド スキャナー インジケーター キットを入手してください。 インジケーターとすべての追加パネルについては、完全な説明で詳しく説明されています。このマニュアルでは、インディケータ、すべての入力変数、お
50 USD
To download MT4 version please click here . - This is the exact conversion from TradingView: "Trend Direction Force Index - TDFI [wm]" By "causecelebre". - This indicator uses multiple levels of averaging to detect trend strength. - You can optimize filter low and filter high levels to achieve best results. - You have access to buffers to use in EAs. - This is a light-load processing and non-repaint indicator. - You can message in private chat for further changes you need.
40 USD
This indicator searches for candlestick patterns. Its operation principle is based on Candlestick Charting Explained: Timeless Techniques for Trading Stocks and Futures by Gregory L. Morris. If a pattern is detected, the indicator displays a message at a bar closure. If you trade using the MetaTrader 4 terminal, then you can download the full analogue of the " Candle Pattern Finder for MT4 " indicator It recognizes the following patterns: Bullish/Bearish (possible settings in brackets) : Hamme
30 USD
Cumulative delta indicator As most traders believe, the price moves under the pressure of market buying or selling. When someone redeems an offer standing in the cup, the deal is a "buy". If someone pours into the bid standing in the cup - the deal goes with the direction of "sale". The delta is the difference between purchases and sales. A cumulative delta - the difference between the cumulative sum of purchases and sales for a certain period of time. It allows you to see who is currently contr
50 USD
このプロダクトを購入した人は以下も購入しています
これはMT5のインジケーターで、再描画なしで取引に参入するための正確なシグナルを提供します。 外国為替、暗号通貨、金属、株式、インデックスなど、あらゆる金融資産に適用できます。かなり正確な見積もりを提供し、取引を開始して終了するのに最適な時期を教えてくれます。1つのシグナルを処理しただけでインジケーターの元が取れた例の 動画 (6:22)をご覧ください。Entry PointsPro インジケーターの助けを借りたほとんどのトレーダーの最初の1週間の結果が改善しています。 Telegramグループ に登録してください。Entry Points Proインジケーターのメリットは次の通りです。 再描画のないエントリーシグナル 再描画されるインジケーターでは一度表示されたシグナルが削除されて大きな金銭的損失につながることがありますが、これと異なり、表示されて確認されたシグナルは消えることがありません。 エラーなしの取引開始 インジケーターアルゴリズムによって取引を開始する(資産を売買する)理想的な瞬間を見つけることができます。それを使用するすべてのトレーダーの成功率が向上します。
125 USD
ICT, SMC, SMART MONEY CONCEPTS, SMART MONEY, Smart Money Concept, Support and Resistance, Trend Analysis, Price Action, Market Structure, Order Blocks, BOS/CHoCH,   Breaker Blocks ,  Momentum Shift,   Supply&Demand Zone/Order Blocks , Strong Imbalance,   HH/LL/HL/LH,    Fair Value Gap, FVG,  Premium  &   Discount   Zones, Fibonacci Retracement, OTE, Buy Side Liquidity, Sell Side Liquidity, BSL/SSL Taken, Equal Highs & Lows, MTF Dashboard, Multiple Time Frame, BigBar, HTF OB, HTF Market Structur
63 USD
Gold Stuff mt5
Vasiliy Strukov
4.97 (105)
Gold Stuff mt5 は、金専用に設計されたトレンド指標であり、あらゆる金融商品にも使用できます。 インジケーターは再描画せず、遅れません。 推奨時間枠 H1. 設定と個人的なボーナスを得るために、購入後すぐに私に連絡してください!   設定 矢印を描く - オンオフ。 チャートに矢印を描く。 アラート - 可聴アラートのオンオフ。 メール通知 - オンオフ。 電子メール通知。 プチ通知 - オンオフ。 プッシュ通知。 次に、色域を調整します。 Gold Stuff mt5 は、金専用に設計されたトレンド指標であり、あらゆる金融商品にも使用できます。 インジケーターは再描画せず、遅れません。 推奨時間枠 H1. 設定と個人的なボーナスを得るために、購入後すぐに私に連絡してください!   設定 矢印を描く - オンオフ。 チャートに矢印を描く。 アラート - 可聴アラートのオンオフ。 メール通知 - オンオフ。 電子メール通知。 プチ通知 - オンオフ。 プッシュ通知。 次に、色域を調整します。
149 USD
1 つのシステムでのトレンド レベルとブレイクダウン レベルの組み合わせ。高度なインジケーター アルゴリズムは、市場のノイズをフィルター処理し、トレンド、エントリー ポイント、および可能なエグジット レベルを決定します。インジケーターシグナルは統計モジュールに記録されるため、最適なツールを選択してシグナル履歴の有効性を示すことができます。この指標は、テイクプロフィットとストップロスのマークを計算します。 マニュアルと説明書 ->   ここ / MT4 バージョン ->   ここ インジケーターで取引する方法: Trend Predictor での取引は、たった 3 つの簡単なステップです。 ステップ 1 - ポジションを開く 70% 以上の成功率で買いシグナルが受信されました ステップ 2 - ストップロスの決定 逆信号でトランクを選択 ステップ 3 - テイクプロフィット戦略の定義 戦略 1: TP1 に到達したらポジション全体をクローズする 戦略 2: TP1 に達した時点でポジションの 50% をクローズし、TP2 に達した時点で残りの 50% をクローズします。 戦略 3:
55 USD
トレンドインジケーター、1つのツールに組み込まれたすべての重要なトレンド機能を備えたトレンドトレーディングとフィルタリングのための画期的なユニークなソリューション! これは、すべてのシンボル/商品(外国為替、商品、暗号通貨、インデックス、株式)で使用できる100%再描画されていないマルチタイムフレームおよびマルチ通貨インジケーターです。 トレンドスクリーナーは、チャート内のドットで矢印トレンドシグナルを提供するインジケーターに続く効率的なインジケーターです。 トレンド分析インジケーターで使用できる機能: 1.トレンドスキャナー。 2.最大利益分析を備えたトレンドライン。 3.トレンド通貨強度メーター。 4.アラート付きのトレンド反転ドット。 5.アラート付きの強いトレンドドット。 6.トレンド矢印 毎日の分析例、毎日のシグナルパフォーマンス...など、トレンドスクリーナーインジケーターを使用して、ここで見つけることができます: ここをクリックしてください トレンドスクリーナーMT4バージョンはこちらから入手できます: https://www.mql5.com/en/market/pro
50 USD
インジケーターガイド  |  Owl Smart Levels戦略   |   MT4版  |  インストールする方法?   |   FAQ Owl Smart Levels Indicator は、 Bill Williams の高度なフラクタル、市場の正しい波構造を構築する Valable ZigZag、エントリの正確なレベルをマークする Fibonacci レベルなどの一般的な市場分析ツールを含む 1 つのインジケーター内の完全な取引システムです。 利益を得るために市場と場所に。 取引システムの詳細な説明については、 Owl Trend Strategy - Smart Levels の記事を参照してください  力はシンプルさにあります! Owl Smart Levels 取引システムは非常に使いやすいので、専門家にも、市場を勉強し始めて自分で取引戦略を選択し始めたばかりの人にも適しています。 戦略と指標に秘密の数式や計算方法が隠されているわけではなく、すべての戦略指標は公開されています。 Owl Smart Levels を使用すると、取引を開始するためのシグナルをすばやく
97 USD
Matrix Arrow Indicator MT5
Juvenille Emperor Limited
5 (11)
マトリックスアローインジケーターMT5は、すべてのシンボル/商品(外国為替、商品、暗号通貨、インデックス、株式)で使用できる100%再描画されていないマルチタイムフレームインジケーターに続くユニークな10in1トレンドです。マトリックスアローインジケーターMT5は、初期段階で現在のトレンドを判断し、最大10の標準インジケーターから情報とデータを収集します。 平均方向移動指数(ADX) 商品チャネルインデックス(CCI) クラシック平研アシキャンドル 移動平均 移動平均収束発散(MACD) 相対活力指数(RVI) 相対力指数(RSI) 放物線SAR ストキャスティクス ウィリアムズのパーセント範囲 すべてのインジケーターが有効な買いまたは売りシグナルを与えると、対応する矢印がチャートに印刷され、次のろうそく/バーの開始時に強い上昇トレンド/下降トレンドを示します。ユーザーは、使用するインジケーターを選択し、各インジケーターのパラメーターを個別に調整できます。マトリックスアローインジケーターMT5は選択されたインディケーターからのみ情報を収集し、それらのデータのみに基づいてアローを印
75 USD
ブレーカートレーダーになり、価格が反転すると市場構造からの利益が変化します。 注文ブロックブレーカーインジケーターは、トレンドまたは価格の動きが枯渇に近づいており、逆転の準備ができていることを識別します。通常、反転または大規模なプルバックが発生しようとしているときに発生する市場構造の変化について警告します。 この指標は、ブレイクアウトと価格の勢いを識別する独自の計算を使用します。使い果たされる可能性のあるポイントの近くで新しい高値が形成されるたびに、インディケーターはその高値の作成を担当する最後の注文ブロックを描きます。次に、移動する価格とともに注文ブロックを追跡します。その後、価格が反対方向にシフトし、その注文ブロックを突破すると、新しい市場構造を作成し、トレンドまたは大きな後退の可能性のある反転の開始を警告します。 注文ブロックは、高値/安値が作成される前の最後の反対色のろうそくであり、価格がこれらの重要な領域を下抜けすると、トレンドの短期的ま​​たは長期的な反転の兆候です。 特徴 重要な枯渇点での市場構造の変化を警告します 価格が使い果たされるレベルに近づくと、
49 USD
TPA True Price Action indicator reveals the true price action of the market makers through 100% non-repainting signals strictly at the close of a candle! TPA shows entries and re-entries, every time the bulls are definitely stronger than the bears and vice versa. Not to confuse with red/green candles. The shift of power gets confirmed at the earliest stage and is ONE exit strategy of several. There are available now two free parts of the TPA User Guide for our customers. The first "The Basics"
168 USD
Market Profile defines a number of day types that can help the trader to determine market behaviour. A key feature is the Value Area, representing the range of price action where 70% of trading took place. Understanding the Value Area can give traders valuable insight into market direction and establish the higher odds trade. It is an excellent addition to any system you may be using. Blahtech Limited presents their Market Profile indicator for the MetaTrader community. Inspired by Jim Dalton’s
99 USD
Auto Order Block with break of structure Detect Break of Structure , Mark Order Block and draw Entry / Stop and Risk to Reward lines when Order block is touch by price with Alert. Trend is Manually set to filter signals in a direction by a button on the chart. Entry / Stop and Risk to Reward lines can also be switch on / off by button on chart. Futures Auto Mark Break of Structure Auto Mark Order block Auto Mark higher time frame Point Of  Interest ( POI ) Popup Alert when BoS , Order block
55 USD
XQ Indicator MT5
Marzena Maria Szmit
5 (1)
The signal conditions are a combination of three indicators, and XQ Forex Indicators only display  medium and long-term trends . The indicator's efficacy has been improved with the addition of a filter that blocks out false signals. The XQ Forex Indicator can be used on  FX pairs, CFDs, and Cryptocurrencies . There are two type of signals:  Buy or Sell and Big Long or Big Short It is possible to enable sending emails when a major trend-change signal is detected, as well as to display the alerts
189 USD
サポートと抵抗のレベルは、長い間、市場分析のための強力なツールとなっています。 強力なサポート指標は、現地価格の最小値に基づいてサポートレベルをプロットし、現地価格の最大値に基づいて抵抗レベルをプロットします。 私の他の開発はここで見ることができます これは、トレンドに応じて取引し、同時に統合またはトレンド反転のゾーンを決定し、ストップロスを設定し、サポートと抵抗レベルで利益を取ることがで 設定と個人的なボーナスを受け取るために購入後すぐに私に連絡してください! 受信パラメータ - インジケータは複雑な設定を必要とせず、主なパラメータはカラースケールの調整です。 サポートと抵抗のレベルは、長い間、市場分析のための強力なツールとなっています。 強力なサポート指標は、現地価格の最小値に基づいてサポートレベルをプロットし、現地価格の最大値に基づいて抵抗レベルをプロットします。 私の他の開発はここで見ることができます これは、トレンドに応じて取引し、同時に統合またはトレンド反転のゾーンを決定し、ストップロスを設定し、サポートと抵抗レベルで利益を取ることがで
149 USD
現在33%オフ 初心者にもエキスパートトレーダーにも最適なソリューション このインジケーターは独自の機能と新しい公式を多数内蔵しており、ユニークで高品質かつ手頃な取引ツールです。このアップデートでは、2つの時間枠ゾーンを表示できるようになります。より長いTFだけでなく、チャートTFとより長いTF(ネストゾーンを表示)の両方を表示できます。すべてのSupply Demandトレーダーの皆さんのお気に召すはずです。:) 重要情報の公開 Advanced Supply Demandの可能性を最大化するには、 https://www.mql5.com/ja/blogs/post/720245 にアクセスしてください。   エントリーまたはターゲットの正確なトリガーポイントを正確に特定できれば取引がどのように改善されるか想像してみてください。新しい基盤となるアルゴリズムに基づいて構築されているため、買い手と売り手の間の潜在的な不均衡をさらに簡単に特定できます。これは、最も強い需要と供給のゾーンと、過去のパフォーマンス(古いゾーンを表示)がグラフィカルに表現されるためです。これらの機能は、最適
199 USD
MetaBands M5
Vahidreza Heidar Gholami
5 (2)
MetaBandsは、強力でユニークなアルゴリズムを使用してチャンネルを描画し、トレンドを検出して、トレーダーに取引の入出ポイントを提供することができます。チャンネル指標に加えて、強力なトレンド指標でもあります。入力パラメータを使用して新しいチャンネルを作成するために、異なるタイプのチャンネルを統合することができます。MetaBandsは、市場のイベントについてユーザーに通知するために、すべてのタイプのアラートを使用します。 特徴 ほとんどのチャンネルアルゴリズムをサポート 強力なトレンド検出アルゴリズム 異なるタイプのチャンネルを統合する能力 マルチタイムフレームおよびマルチカレンシー(シグナルマトリックス) すべてのタイプのアラート機能(サウンド、画面フラッシャー、プッシュ通知、メール、ポップアップ、矢印) 再描画しない トレンド検出 MetaBandsは、チャネル内を振動する青いラインを使用してトレンドを検出します。ラインがチャネルの上部バンドに達すると、下降トレンドの開始を示し、下部バンドに達すると上昇トレンドの開始を示します。青いラインが中心ラインに近づくと、市場はコンソ
129 USD
トレンドラインマップインジケーターは、トレンドスクリーナーインジケーターのアドオンです。トレンドスクリーナー(トレンドラインシグナル)によって生成されたすべてのシグナルのスキャナーとして機能します。 これは、トレンドスクリーナーインジケーターに基づくトレンドラインスキャナーです。 Trend Screener Pro インジケーターがない場合、Trend Line Map Proは機能しません。 It's a Trend Line Scanner based on Trend Screener Indicator. If you don't have Trend Screener Pro Indicator,     the Trend Line Map Pro will not work . ブログにアクセスすると、トレンドラインマップインジケーターの無料バージョンをダウンロードできます。 Metatrader Testerの制限なしで、購入する前に試してみてください。 :  ここをクリック 1.簡単になる利点 通貨と時間枠に基づいて売買シグナルを表示し
50 USD
Introduction to X3 Chart Pattern Scanner X3 Cherart Pattern Scanner is the non-repainting and non-lagging indicator detecting X3 chart patterns including Harmonic pattern, Elliott Wave pattern, X3 patterns, and Japanese Candlestick patterns. Historical patterns match with signal patterns. Hence, you can readily develop the solid trading strategy in your chart. More importantly, this superb pattern scanner can detect the optimal pattern of its kind. In addition, you can switch on and off individu
250 USD
**   All Symbols   x   All Timeframes   scan just by pressing scanner button ** *** Contact me immediately after the purchase to send you instructions and add you in "Market Structure group" for sharing or seeing experiences with other users. CURRENT PRICE $39..... Future Price $200 Introduction: Market structure is important for both new and professional traders since it can influence the liquidity and price action of a market. It’s also one of the most commonly used techniques to understand tr
39 USD
Royal Scalping Indicator is an advanced price adaptive indicator designed to generate high-quality trading signals. Built-in multi-timeframe and multi-currency capabilities make it even more powerful to have configurations based on different symbols and timeframes. This indicator is perfect for scalp trades as well as swing trades. Royal Scalping is not just an indicator, but a trading strategy itself. Features Price Adaptive Trend Detector Algorithm Multi-Timeframe and Multi-Currency Trend Low
149 USD
Forex Master Pattern
Alberto Gauer Borrego
4.8 (10)
The Forex Master Pattern  is an alternative form of technical analysis that provides a framework which will help you to find and follow the hidden price pattern that reveals the true intentions of financial markets. This algorithm here does a good job detecting the Phase 1 of the Forex Master Pattern cycle, which is the contraction point (or Value).  On Phase 2 we get higher timeframe activation (also called Expansion), which is where price oscillates above and below the average price defined
49 USD
BUY INDICATOR AND GET EA FOR FREE AS A BONUS + SOME OTHER GIFTS! ITALO VOLUME INDICATOR  is the best volume indicator ever created, and why is that? The Indicator works on all time-frames and assets, indicator built after 6 years of experience on forex and many other markets. You know many volume indicators around the internet are not complete, does not help, and it's difficult to trade, but the Italo Volume Indicator is different , the Italo Volume Indicator shows the wave volume, when market
65 USD
Supply Demand uses previous price action to identify potential imbalances between buyers and sellers. The key is to identify the better odds zones, not just the untouched ones. Blahtech Supply Demand indicator delivers functionality previously unavailable on any trading platform. This 4-in-1 indicator not only highlights the higher probability zones using a multi-criteria strength engine, but also combines it with multi-timeframe trend analysis, previously confirmed swings and engulfing detecto
99 USD
支持線と抵抗線、そしてローソク足のギャップをチャート上に自動的に表示するため、価格が次に向かう可能性のある場所や反転する可能性のある場所を確認することができます。 このインジケーターは、私のウェブサイト(The Market Structure Trader)で教えているポジショントレード手法の一部として使用するように設計されており、ターゲットとエントリーの可能性のための重要な情報を表示します。 MT4 Version:  https://www.mql5.com/en/market/product/97246/ このインジケーターには、2つのコア機能と4つの追加機能があります: コア機能1 - 日足、週足、月足のサポートラインとレジスタンスラインの自動表示 このインジケーターは、直近2日間、最大6週間前、数ヶ月前のサポートレベルとレジスタンスレベルを自動的に引き込みます。これらのレベルの見た目は完全にカスタマイズすることができ、いくつ表示されるかを表示することもできます。これらの重要な水準は、しばしば主要な支持線と抵抗線として機能し、価格が転換して引き戻されたり反転したりする場
49 USD
トレンド スキャナーは、マルチシンボルおよびマルチタイム フレームから市場トレンドをスキャンし、チャート上の可動パネルに表示します。分析にはゴールド スタッフ インジケーターを使用します。機能には、アラート、電子メール、およびプッシュ通知が含まれます。 トレーダーは、自分が選んだペアを複数選択して表示できます。 トレンド スキャナーは、トレンドの方向性を確認するための優れたツールであり、トレンドに従って売買注文のみを許可することで、手動取引または EA 取引に使用できます。 機能には、アラート、電子メール、およびプッシュ通知が含まれます。 トレーダーは、自分が選んだペアを複数選択して表示できます。 トレンド スキャナーは、トレンドの方向性を確認するための優れたツールであり、トレンドに従って売買注文のみを許可することで、手動取引または EA 取引に使用できま リアルタイム結果はこちらからご覧いただけます。 設定と個人的なボーナスを得るために、購入後すぐに私に連絡してください!
149 USD
Buy and sell signals based on Larry Williams's exponential moving average strategies 9.1, 9.2, 9.3 and 9.4 for trend reversals and continuations. To understand the logic and how to trade the signals, please check: Setup 9.1:  https://www.mql5.com/pt/market/product/50986 Setup 9.2:  https://www.mql5.com/pt/market/product/52268 Setup 9.3:  https://www.mql5.com/pt/market/product/52269 Setup 9.4:  https://www.mql5.com/pt/market/product/52273 Notices:  - This indicator displays a lot of signals.
199 USD
Stargogs Spike Catcher V3.11 This Indicator is Developed To milk the BOOM and CRASH indices . Send me Message if you need any help with the indicator.  CHECK OUT THE STARGOGS SPIKE CATCHER EA/ROBOT V3: CLICK HERE ALSO CHECK OUT SECOND TO NONEFX SPIKE CATCHER:   CLICK HERE STARGOGS SPIKE CATCHER V3.11 WHATS NEW! Brand New Strategy. This is the Indicator you need for 2023. The Indicator Gives you an Entry at a time when conditions are met and you should use TP & SL. New Trendline that changes col
100 USD
ADR反転インジケーターは、通常の1日の平均レンジに関連して価格が現在取引されている場所を一目で示します。価格が選択した平均範囲とレベルを超えると、ポップアップ、電子メール、またはプッシュを介して即座にアラートを受け取るため、プルバックと逆転にすばやくジャンプできます。インディケータは、チャート上に1日の平均レンジの極値で水平線を描画し、それらを超える価格の数学的確率が付加されているレベルを超える延長も描画します。詳細については、以下をご覧ください... インジケーターとモニターを補完するADRアラートダッシュボードここでも利用可能なすべてのペア:https:// www.mql5.com/en/market/product/66316 MT4バージョンはこちらからも入手できます:https:// www.mql5.com/en/market/product/62757 通常の1日平均レンジ(ADR)内で価格が取引され、これらのレベルを上回っている時間の約60%は、通常、その後の引き戻し(利益確定)の動きを伴う急激な価格の動きの指標です。毎日の範囲の上部または下部からのプルバ
49 USD
Introduction to Fractal Pattern Scanner Fractal Indicator refers to the technical indicator that makes use of the fractal geometry found in the financial market. Fractal Pattern Scanner is the advanced Fractal Indicator that brings the latest trading technology after the extensive research and development work in the fractal geometry in the financial market. The most important feature in Fractal Pattern Scanner is the ability to measure the turning point probability as well as the trend probabil
185 USD
** All Symbols x All Timeframes scan just by pressing scanner button ** *** Contact me after the purchase to send you instructions and add you in "ABCD scanner group" for sharing or seeing experiences with other users. Introduction This indicator scans AB=CD retracement patterns in all charts. The ABCD is the basic foundation for all harmonic patterns and highly repetitive with a high success rate . The ABCD Scanner indicator is a scanner reversal ABCD pattern that helps you identify when the pr
39 USD
Dark Power  is an Indicator for intraday trading. This Indicator is based on   Trend Following  strategy, also adopting the use of an histogram to determine the right power . We can enter in good price with this Indicator, in order to follow the   strong trend   on the current instrument. The histogram is calculated based on the size of the bars and two moving averages calculated on the histogram determine the direction of the signal Key benefits Easily visible take profit/stop loss lines Int
49 USD
作者のその他のプロダクト
Three Triple Exponential Average oscillators merged into one. Fast period will pull on the slower period, and the slower will smooth out the faster and avoid early positions. You can use 2 fast and 1 slow, or Fibonacci range or 2 slow, 1 fast. NOW FREE. But please consider supporting me by buying my 2 for sale indicators. You can use this as an entry indicator and exit indicator. Open when the tripleTRIX line crosses the zero line and close when it starts to reverse. When the peaks get bigger,
FREE
TVf Channel
Nicholas C Weber
5 (1)
I really like this indicator. But I made it, so of course I would.. NOW FREE. But please consider supporting me by buying my 2 for sale indicators. You can multiply the weight of each indicator used to give more emphasis on it's value when averaging between the 3. Boost fast TEMA and it can move the indicator faster. Boost slow FrAMA and watch it smooth out. I like to use them as open/close lines and set them up so they move quick, but have the FrAMA smooth it out more.  Check out my other ind
FREE
This is 3 pre-filtered CCI, Commodity Channel Index, indicators pre-filtered by your choice of 3 Smoothing and/or Averaging methods. I have found certain settings to be very reliable and I plan to incorporate this into an Expert Advisor in the future. I have added a new form of Averaging: Smoothed TEMA, or Triple Smoothed EMA, Exponential Moving Average. It gives less noise than the TEMA, but provides the smoothing of the Double Smoothed EMA, so it should be a slight bit quicker. PLEASE Download
30 USD
Update 2.2: Added MFI with predictive mod. Updated all indicators to reflect similar values, to combine multiple ones to rest well on overbought/oversold lines. Update 2.3: Minor bug fixes. Update 2.4: Removed buggy indicators DeMarker, and MACD, as it was too complicated and not as accurate as the rest due to it's nature. Added Awesome Oscillator. removed spreads, as it bogged the indicator down. Added other features, like indicator value compensators to match each other's levels when combine
42 USD
Update 2.0: Added the option to change LWMA to the other 3 basic MA modes. I also added Smoothing to it, to tame it a bit. You can input 1 as smoothing period and no smoothing will be applied. Update 2.1: Removed Trend Typical Open/Close as is was the same behavior as Trend Open/Close. Trend follow works by averaging the high/low with close/open. If Close is above Open, Trend Close = Close+High/2, averaging between close and high, and when Close drops below Open, it's calculation automatically
42 USD
This is similar in it's idea as the Binary Advance/Lite indicator, but this is intended to use as a levels indicator, as well as trend reversal and how ranging the market is. It takes several useful indicators and combines them in such a way as to declutter your charts, yet prove even more useful together, than separate. RSI, RVI, DeMarker, MACD are added together then multiplied by ATR and StdDev to reveal multiple factors: How far the price has changed, and as the price slows down and reverses
30 USD
LIQUID SLAM! QUENCH your portfolio's thirst!  This is based on a trading strategy I developed using volume, price action of 2 timeframes and a custom oscillator indicator I made and posted on the market called Dr Oscillator:  https://www.mql5.com/en/market/product/91487 This has very basic controls but is very powerful. I just created it, but the testing results are looking good. I'm posting just in case any one wants to try it out. Has a LOT of account protection features. Choose days to trad
30 USD
フィルタ:
レビューなし
レビューに返信