• 概要
  • レビュー (3)
  • コメント
  • 最新情報

Gartley Hunter Multi MT4

4.67

Gartley Hunter Multi - An indicator for searching for harmonic patterns simultaneously on dozens of trading instruments and on all classic timeframes: (m1, m5, m15, m30, H1, H4, D1, Wk, Mn).

Manual (Be sure to read before purchasing) | Version for MT5

Advantages

1. Patterns: Gartley, Butterfly, Shark, Crab. Bat, Alternate Bat, Deep Crab, Cypher

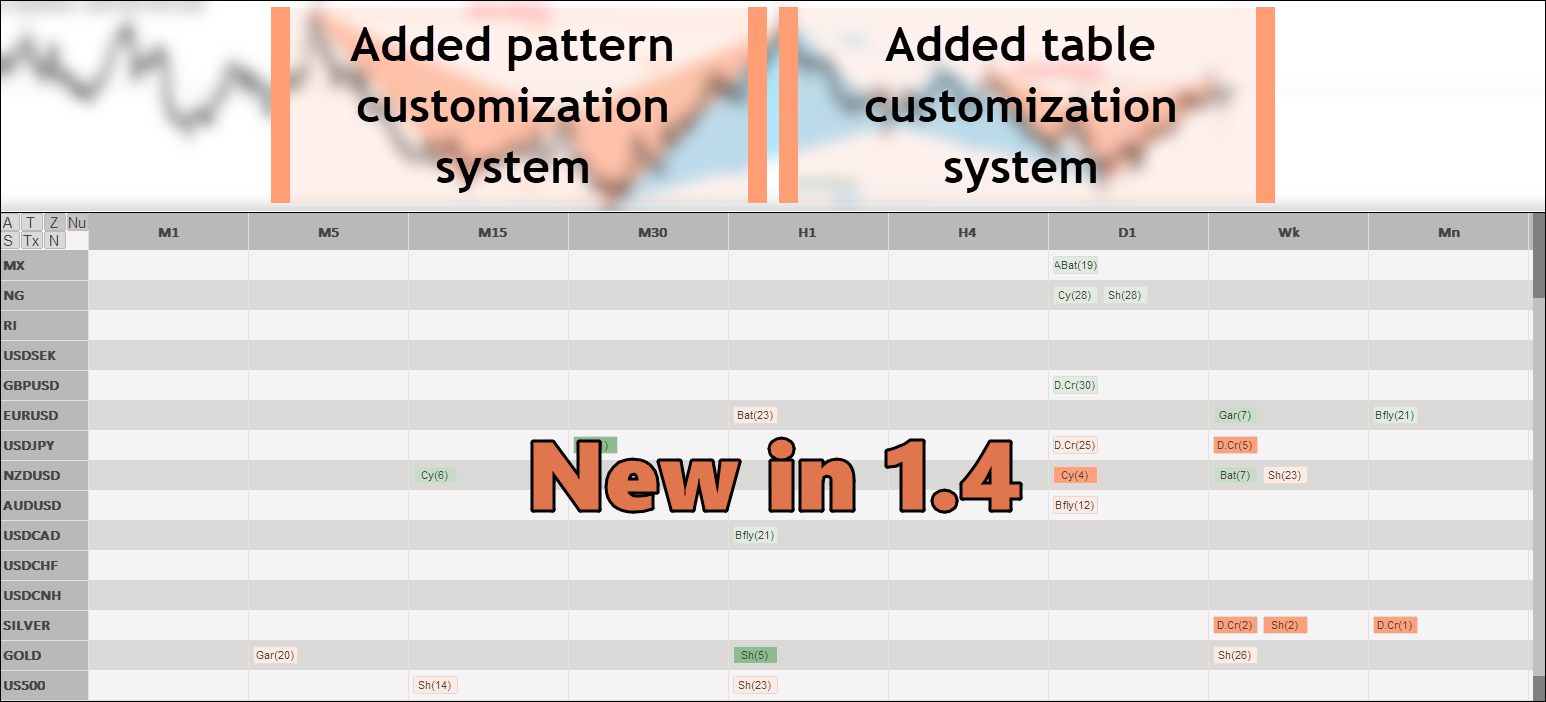
2. Simultaneous search for patterns on dozens of trading instruments and on all classic timeframes

3. Search for patterns of all possible sizes. From the smallest to the largest

4. All found patterns are placed in a table where you can quickly switch between them

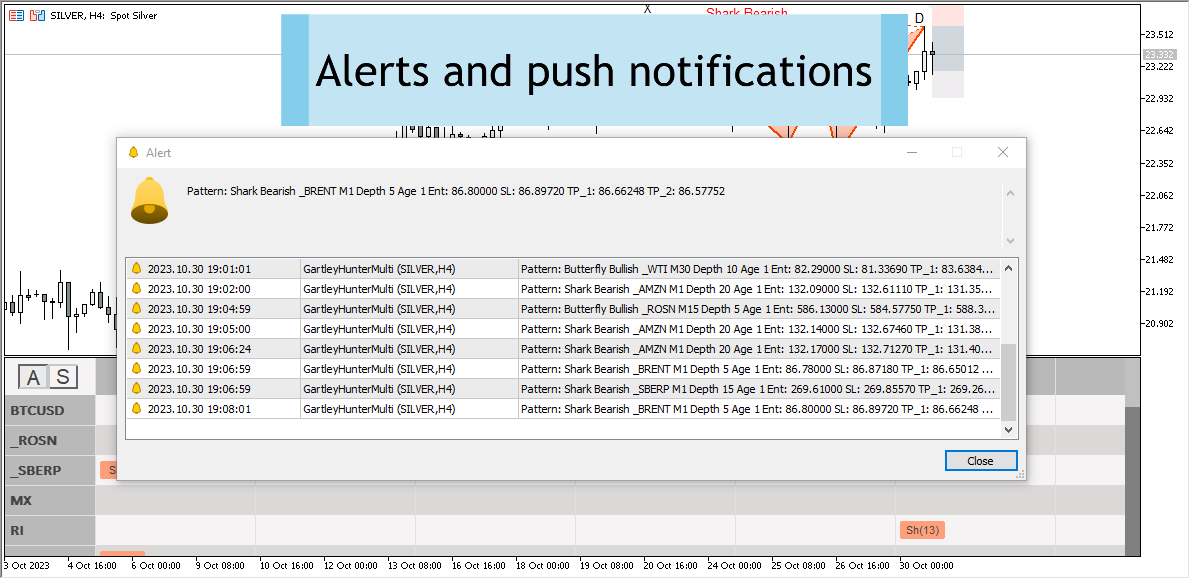
5. Advanced system of alerts and push notifications. When a pattern appears, the indicator will let you know about it

Author: Siarhei Vashchylka. For any questions, write to me in private messages. I also recommend subscribing to my updates. To do this, follow the link to my profile and click "Add to friends".
レビュー 3
dssstrgr
132
dssstrgr 2023.01.15 12:57 
 

Очень удобный. Можно не лазить по инструментам, а просто ждать сигналы и уже потом смотреть - стоит ли входить в рынок. Существенно экономит время. Кроме того, торговля по паттернам Гартли достаточно эффективна. Спасибо разработчикам.

Konstantin Korol
416
Konstantin Korol 2022.12.04 13:05 
 

Отличный индикатор! Я за пару сигналов отбил его стоимость. Конечно безупречно никто не покажет где купить где продать, но тут если приноровиться, можно заработать.

tonysaulet
413
tonysaulet 2023.10.03 11:44 
 

An indicator of quality and professionalism. This rating will rise to 5 stars once the "Horizontal Dash" mode is finalized, making this indicator ergonomic and professional on horizontal screens.

おすすめのプロダクト
Monster Harmonics Indicator is a harmonic pattern indicator. It recognizes Gartley, Bat, Crab, Butterfly, Cypher, White Swan, Black Swan, Shark and several other patterns. Projected patterns that are not yet completed are recognized, too. Monster even shows the PRZ (Potential Reversal Zone). Users can add their own user defined patterns to Monster. Besides the current pattern, Monster also shows all patterns in the symbols history. Monster will provide alerts for developing patterns. Introduced
トレンドトレーディング は、タイミングのプルバックとブレイクアウトにより、市場で起こっているトレンドから可能な限り利益を得るように設計された指標です。確立されたトレンドの中で価格が何をしているかを分析することにより、取引の機会を見つけます。 [ インストールガイド | 更新ガイド | トラブルシューティング | よくある質問 | すべての製品 ] 自信を持って効率的に金融市場を取引する むち打ちにならずに確立されたトレンドから利益を得る 収益性の高いプルバック、ブレイクアウト、早期の逆転を認識する この指標は、独自の品質とパフォーマンスを分析します 複数時間枠のダッシュボードを実装します インジケーターは再描画されていません 電子メール/音声/視覚アラートを実装します 確立されたトレンドは多くの取引機会を提供しますが、ほとんどのトレンド指標はそれらを完全に無視しています。インジケーターの解釈はかなり簡単です: (1) トレンドの変化 (2) トレンドの方向への後退 (3) トレンドの方向へのブレイクアウト 赤いダッシュ は下降トレンド中の修正です 青いダッシュ は上昇ト
This is a trend indicator without redrawing Developed instead of the binary options strategy (by the color of the Martingale candlestick) Also works well in forex trading When to open trades (binary options) A signal will appear in the place with a candle signaling the current candle It is recommended to open a deal for one candle of the current timeframe M1 and M5 When a blue dot appears, open a deal up When a red dot appears, open a trade down. How to open trades on Forex. When a signal is rec
Owl smart levels
Sergey Ermolov
4.63 (54)
MT5版  |   FAQ Owl Smart Levels Indicator   は、 Bill Williams   の高度なフラクタル、市場の正しい波構造を構築する Valable ZigZag、エントリの正確なレベルをマークする Fibonacci レベルなどの一般的な市場分析ツールを含む 1 つのインジケーター内の完全な取引システムです。 利益を得るために市場と場所に。 戦略の詳細な説明 インジケータを操作するための指示 顧問-取引助手 プライベートユーザーチャット ->購入後に私に書いて、私はプライベートチャットにあなたを追加し、あなたはそこにすべてのボーナスをダウンロードすることができます 力はシンプルさにあります! Owl Smart Levels   取引システムは非常に使いやすいので、専門家にも、市場を勉強し始めて自分で取引戦略を選択し始めたばかりの人にも適しています。 戦略と指標に秘密の数式や計算方法が隠されているわけではなく、すべての戦略指標は公開されています。 Owl Smart Levels を使用すると、取引を開始するためのシグナルをすばやく確認し、
The indicator detects and displays Shark harmonic pattern (see the screenshot). The pattern is plotted by the extreme values of the ZigZag indicator (included in the resources, no need to install). After detecting the pattern, the indicator notifies of that by a pop-up window, a mobile notification and an email. The indicator highlights the process of the pattern formation and not just the complete pattern. In the former case, it is displayed in the contour triangles. After the pattern is comple
FXC iMACD-DivergencE MT4 Indicator This is an advanced MACD indicator that finds trend-turn divergences on the current symbol. The indicator detects divergence between the MACD and the price movements as a strong trend-turn pattern. Main features: Advanced divergence settings Price based on Close, Open or High/Low prices Give Buy/Sell open signals PUSH notifications E-mail sending Pop-up alert Customizeable Information panel Input parameters: MACD Fast-EMA: The Fast-EMA variable of the MACD
The trading statistics indicator notifies the trader of the aggregate income of the trading account for different time intervals. The indicator has wide display settings on the graph. There is a choice of one of the two display languages on the chart- English and Russian. Settings Indicator language (ENG, RUS) - Select the language to display on the chart; To control the magic (-1: any magic) - Entering the Magic for control (-1: any Magic); Angle of indicator tie - Selecting the angle of the
Gioteen Volatility Index (GVI)   - your ultimate solution to overcoming market unpredictability and maximizing trading opportunities. This revolutionary indicator helps you in lowering your losing trades due to choppy market movements. The GVI is designed to measure market volatility, providing you with valuable insights to identify the most favorable trading prospects. Its intuitive interface consists of a dynamic red line representing the volatility index, accompanied by blue line that indicat
PW Oscillator   - индикатор предназначенный для поиска локальных экстремумов, определения текущей тенденции. В расчетах индикатора используется авторская методика. С помощью индикатора можно определять места возможного разворота цены желательно в направлении тенденции, но также с достаточной точностью и против нее. Также с помощью индикатора можно определять текущую тенденцию. Индикатор подходит для любых валютных пар, но для адекватного отображения показания необходимо, чтобы было достаточно ис
This is a combination of multiple oscillators into a single divergence system that creates the impression of a more reliable divergence indicator. It is multi-currency based and works best on 15 minutes timeframe and above. Every time a signal is generated, it shows an alert to the user. It is more ideal if combined with other price action indicators or trading systems.
The indicator provides a superior alternative to price action analysis. It enables the identification of normalized patterns, which are then transformed into a graphical representation to forecast future steps within a time series. In the top-left corner, you'll find information regarding the expected prediction accuracy, determined through a complex MSQE calculation. You have the flexibility to adjust the time window, making it easy to validate the indicator's performance. Additionally, you can
The CCI Divergence is a reasonably useful indicator in itself, but it is even more effective when used with divergence pattern trading. The CCI Divergence indicator signal is one of the most potent signals among the indicators that exist in the market. Here is new version for Divergence Indicator using CCI method, with more improvements. Divergences indicate a potential investment point because the directional moment does not confirm the price. A bullish divergence occurs when the underlying
All Symbols   AND  All Time frames Scan                                                                                                                 Document Introduction   The ABCD is a basic harmonic pattern. The ABCD pattern is a visual, geometric chart pattern comprised of three consecutive price swings. It looks like a diagonal lightning bolt and can indicate an upcoming trading opp
[ZhiBiCCI]インディケータは全てのサイクル使用に適しており、そして全ての市場品種にも適しています。 [ZhiBiCCI]緑色の実線は強気の発散の逆転です。緑色の点線は古典的な強気の発散です。 [ZhiBiCCI]赤への実線は逆弱気の発散である。赤い点線は古典的な弱気の発散です。 [ZhiBiCCI]はパラメータ(アラート、メール送信、通知送信)で設定でき、(true)に設定するとインスタント信号をアラームウィンドウに送信し、Eメール、インスタントメッセージを送信できます。 パラメータ設定の説明 [displayAlert]:これはアラームスイッチで、trueに設定され、矢印が表示されればプロンプトに自動的に警告され、falseに設定されれば警告されません。 [sendmail_NO_OFF]:これはメールを送信するためのスイッチで、trueに設定します。矢印が表示されていればMT4で設定したメールボックスにメールを送信し、falseに設定されていればメールを送信しません。 [sendnotification_NO_OFF]:これはインスタントメッセー
-   Real price is 90$   - 50% Discount ( It is 45$ now ) Contact me for instruction, any questions! Introduction V Bottoms and Tops are popular   chart patterns   among traders due to their potential for identifying trend reversals. These patterns are characterized by sharp and sudden price movements, creating a V-shaped or inverted V-shaped formation on the   chart . By recognizing these patterns, traders can anticipate potential shifts in market direction and position themselves according
Wave WOLD MT4外国為替インジケータは、Wolf waveを検索し、取引端末の現在のウィンドウに表示するように設計されています。 取引でオオカミの波を使用するトレーダーのための優れた指標。 取引戦略への適用は、効率と収益性を大幅に向上させます。 指標に関する情報 他のWolf wave指標とは異なり、Wave WOLD MT4外国為替指標は、その有効性を大幅に高める多くの機能を備えています: 最初のものは開いているWindows5Pointパラメータ(真の値)情報サポートを提供します。つまり、Wolf waveが登場したチャートのウィンドウを展開します。 たとえば、EURUSD、AUDUSD、GBPUSDチャートが開いていて、それぞれにWave WOLD MT4インジケーターがインストールされている場合、ユーロモデルが検出されると、対応するチャートが自動的に他のチャートの上に前景に表示され、多数の商品を取引するときに非常に便利になります。  2番目の機能は、ユーザーが自分で選択できるパラメータ(デフォルト設定(12,26,9))であるmacd上の組み込みの発散分析で
高度なトレンドフィルタリングとアラート表示を備えたMACDオシレーター。トレンドを決定し、弱いトレンドを除外し、トレンドの新しい強さを示します。 MACDオシレーターは、任意の時間枠とすべてのシンボル(通貨、インデックス、石油、金属、株式、オプション、オフライン練行足チャート)で動作します 1.ユーザーはMACD値を変更できます。 2.最小MACDレベルフィルター、 3.除算値は、チャートでトレンド変化の表示が必要な電力比を除外します。 4.バッファ値には、トレンドが変更された後にアラートを通知するための追加のMacd値の移動を提供する追加のフィルターがあります。 5.アラートは、追加のメッセージポップアップに対してTrueまたはFalseを選択できます。 このバージョンはトレードエントリーシグナル用であり、どのチャートでもMACDのさまざまなレベルチェックを使用してトレンドが変化します トレードを終了する場合、ユーザーはトレードの終了に必要な独自のトレーリングストップロスを使用できます。 推奨されるチャートの時間枠は、練行足の価格枠でH1、H4、D1および同等のチャートです。 あな
This indicator is another variant of the famous powerful indicator Fibonacci-SS https://www.mql5.com/en/market/product/10136 but has different behaviour in placing Pending Order and TP Line. Automatically places Fibonacci retracement lines from the last highest and lowest visible bars on the chart with: An auto Pending Order (Buy/Sell). Taking Profit 1, Taking Profit 2 is pivot point and Taking Profit 3 for extended reward opportunity. The best risk and reward ratio. Simple and powerful indica
Gartley Projection D
Oleksandr Medviediev
3.71 (7)
このインジケーターは、H.M.Gartley (「株式市場の利益」、1935 年) の開発に従って調和パターン (XABCD) を識別します。 D 点を透視投影の点として投影します (設定で ProjectionD_Mode = true を指定します)。 再描画はしません。 作業時間枠のバーが閉じるとき、特定されたパターン ポイントが Patterns_Fractal_Bars バーの間に移動していない場合、チャート上に (予想される価格変動の方向に) 矢印が表示されます。 この瞬間から、矢印はチャート上に永久に残ります。 連続した 2 ~ 3 つ以上の矢印 - これは市場状況の変化であり、再描画/再描画ではありません (時間枠を前後に切り替えてはなりません)。 注: 2 ~ 3 つ以上の矢印が連続している場合 - これは市況の変化であり、再描画ではありません。 パターンの総数は 85 です (Gartley-222 と Gartley-222WS を含む。完全なリストはコメント セクションにあります)。 識別されたすべてのパターンのうち、最後に識別されたパター
Market Trend Catcher indicator analyzes the duration of trend movements and, with a certain development of the current trend, offers market entry points in the form of arrows with recommended profit targets. The indicator is very easy to use and does not require a lot of information to understand how it works. It has a minimum of settings and is transparent in understanding the principle of its operation, fully displaying the information on the basis of which it makes decisions on recommending e
Noize Absorption Index - is the manual trading system that measures the difference of pressure between bears forces and bulls forces. Green line - is a noize free index that showing curent situation. Zero value of index shows totally choppy/flat market.Values above zero level shows how powerfull bullish wave is and values below zero measures bearish forces.Up arrow appears on bearish market when it's ready to reverse, dn arrow appears on weak bullish market, as a result of reverse expectation. S
TradingDesk
Christian Weilinger
4 (1)
TradingDesk – Performance Analyse MT4 To test the indicator download free Demo version here: https://www.mql5.com/en/market/product/40471 TradingDesk analysed MetaTrader 4 historical data by Symbol, Magic Number, Trade or Comment. All these evaluations will be displayed in real time on your MetaTrader 4 chart window. All this information will be displayed in the following dashboards: account info General information about the account is displayed in the account info dashboard. performance
Was: $249  Now: $99   Market Profile defines a number of day types that can help the trader to determine market behaviour. A key feature is the Value Area, representing the range of price action where 70% of trading took place. Understanding the Value Area can give traders valuable insight into market direction and establish the higher odds trade. It is an excellent addition to any system you may be using. Blahtech Limited presents their Market Profile indicator for the MetaTrader community. Ins
The main idea of this indicator is rates analysis and prediction by Fourier transform. Indicator decomposes exchange rates into main harmonics and calculates their product in future. You may use the indicator as a standalone product, but for better prediction accuracy there is another related indicator - FreqoMaster - which uses FreqoMeterForecast as a backend engine and combines several instances of FreqoMeterForecast for different frequency bands. Parameters: iPeriod - number of bars in the ma
Gartley Hunter MT4
Siarhei Vashchylka
3.67 (3)
Gartley Hunter - An indicator for searching for harmonic patterns (Gartley patterns) and their projections. The indicator is equipped with a system of alerts and push notifications. Manual (Be sure to read before purchasing) | Version for MT5 Advantages 1. 12 harmonic patterns: 7 classical and 5 exotic. New patterns will be added as the indicator develops. 2. Constant automatic search for harmonic patterns. The indicator is capable of finding from the smallest to the largest patterns. 3. Autom
Trade with Gann on your side!! MASTER CIRCLE 360 CIRCLE CHART, originally created by Gann admitted that this is “The Mother of all charts”. It is one of the last studies that this great trader left for us. The numeric tab le is apparently quite simple like all the tables and is based on square numbers, the SQUARE OF 12 and is by evolution, one of the most important square numbers. Here we can find CYCLE, PRICE AND TIME thanks to angles and grades, to show past and future support and resistance.
True SnD
Indra Lukmana
5 (1)
This Supply & Demand indicator uses a unique price action detection to calculate and measures the supply & demand area. The indicator will ensure the area are fresh and have a significant low risk zone. Our Supply Demand indicator delivers functionality previously unavailable on any trading platform. Trading idea You may set pending orders along the supply & demand area. You may enter a trade directly upon price hit the specific area (after a rejection confirmed). Input parameters Signal - S
FREE UNLIMITED PM : https://linktr.ee/ARFXAUTOTRADE?utm_source=linktree_admin_share This indicator makes it easy for us to monitor the Alligator Trend in Multi Time Frames on 1 screen without needing to switch time frames on MT4 How to use this indicator is as follows: 01. Check Multi Time Frame Monitoring for Daily Trade (Check D1, H4, H1 if we buy in 1 direction. Focus on the buyer pattern to follow the H1 Time Frame trend) 02. Check Multi Time Frame Monitoring for 4 Hour Trade (Check H4,
FREE
Apollo Volume Profile は、出来高分析を使用して市場の動きの方向性を決定する指標です。インジケーターは非常に使いやすいです。この指標は、使用される時間枠に応じて、市場における売り手と買い手の比率を明確に示します。この指標は、あらゆる取引システムの基礎として使用できます。インディケータはシグナルを再描画しません。 この指標は、通貨、金属、指数、株式、暗号通貨などの金融商品の取引に使用できます。 このインジケーターは、スタンドアロンの取引システムとして、またはインジケーターのトレンド フィルターとして使用できます。 購入後、必ず私に書いてください!私の取引の推奨事項と素晴らしいボーナスをあなたと共有します!
このプロダクトを購入した人は以下も購入しています
まず第一に、この取引インジケーターは再描画されず、再描画されず、遅延しないことを強調する価値があります。これにより、手動取引とロボット取引の両方に理想的なものになります。 ユーザーマニュアル:設定、入力、戦略。 アトミックアナリストは、価格の強さとモメンタムを利用して市場でより良いエッジを見つけるためのPA価格アクションインジケーターです。ノイズや誤ったシグナルを除去し、取引ポテンシャルを高めるための高度なフィルターを備えています。複雑なインジケーターの複数のレイヤーを使用して、アトミックアナリストはチャートをスキャンし、複雑な数学的計算をシンプルなシグナルと色に変換します。これにより、どのような初心者トレーダーでも理解して使用し、一貫した取引の決定を行うことができます。 「アトミックアナリスト」は、新規および経験豊富なトレーダー向けにカスタマイズされた包括的な取引ソリューションです。プレミアムインジケーターとトップノッチの機能を1つの取引戦略に組み合わせ、すべてのタイプのトレーダーにとって汎用性のある選択肢にします。 デイリートレーディングとスキャルピング戦略:高
現在20%OFF! 初心者やエキスパートトレーダーのためのベストソリューション! このダッシュボードソフトウェアは、28の通貨ペアで動作しています。それは私達の主要な指標(高度な通貨の強さ28と高度な通貨インパルス)の2に基づいています。それは全体の外国為替市場の大きい概観を与えます。それは、すべての(9)時間枠で28の外国為替ペアのための高度な通貨の強さの値、通貨の動きの速度と信号を示しています。チャート上で1つのインディケータを使用して市場全体を観察し、トレンドやスキャルピングの機会をピンポイントで見つけることができたら、あなたのトレードがどのように改善されるか想像してみてください。 このインディケータには、強い通貨と弱い通貨の識別、潜在的な取引の識別と確認がより簡単になるような機能が搭載されています。このインディケータは、通貨の強さや弱さが増加しているか減少しているか、また、すべての時間枠でどのように機能しているかをグラフィカルに表示します。 新機能として、現在の市場環境の変化に適応するダイナミックなマーケットフィボナッチレベルが追加され、すでに当社のAdvan
Reversal First Impulse levels (RFI)    INSTRUCTIONS        RUS       -       ENG              R ecommended to use with an indicator   -   TREND PRO -  Version MT5 A key element in trading is zones or levels from which decisions to buy or sell a trading instrument are made. Despite attempts by major players to conceal their presence in the market, they inevitably leave traces. Our task was to learn how to identify these traces and interpret them correctly. Main functions: Displaying active zones
Volatility Trend System - a trading system that gives signals for entries. The volatility system gives linear and point signals in the direction of the trend, as well as signals to exit it, without redrawing and delays. The trend indicator monitors the direction of the medium-term trend, shows the direction and its change. The signal indicator is based on changes in volatility and shows market entries. The indicator is equipped with several types of alerts. Can be applied to various trading
NAM Order Blocks
NAM TECH GROUP, CORP.
5 (1)
MT4マルチタイムフレームオーダーブロック検出インジケーター。 特徴 -チャートコントロールパネルで完全にカスタマイズ可能で、完全な相互作用を提供します。 -必要な場所でコントロールパネルを表示および非表示にします。 -複数の時間枠でOBを検出します。 -表示するOBの数量を選択します。 -さまざまなOBユーザーインターフェイス。 -OBのさまざまなフィルター。 -OB近接アラート。 -ADRの高線と低線。 -通知サービス(画面アラート|プッシュ通知)。 概要 注文ブロックは、金融機関や銀行からの注文収集を示す市場行動です。著名な金融機関と中央銀行が外国為替市場を牽引しています。したがって、トレーダーは市場で何をしているのかを知る必要があります。市場が注文ブロックを構築するとき、それは投資決定のほとんどが行われる範囲のように動きます。 注文の構築が完了すると、市場は上向きと下向きの両方に向かって急激に動きます。注文ブロック取引戦略の重要な用語は、機関投資家が行っていることを含むことです。それらは主要な価格ドライバーであるため、機関投
FX Volume
Daniel Stein
4.6 (35)
mql5と Telegramの モーニング・ブリーフィングで、詳細とスクリーンショットを含む毎日のマーケット・アップデートをご覧 ください! FX Volumeは、ブローカーの視点から市場のセンチメントをリアルに洞察する、最初で唯一の出来高インジケーターです。 ブローカーのような機関投資家が外国為替市場でどのようなポジションをとっているか、COTレポートよりもはるかに速く、素晴らしい洞察を提供します。 この情報をチャート上で直接見ることは、あなたの取引にとって真のゲームチェンジャーであり、画期的なソリューションです。 以下のようなユニークなマーケットデータ洞察から利益を得てください。 比率は 、通貨のロングポジションとショートポジションの比率をパーセントで表示します。 比率の変化は 、選択した期間内のロング比率とその変化率を表示します。 Volumes Totalは 、通貨の取引量(ロングとショート)の合計をロット単位で表示します。 Volumes Long :全通貨のロングポジションの取引量を表示します。 Volumes(ショート )は、全通貨のショートポジションの取引量を表示
TrendMaestro
Stefano Frisetti
5 (3)
note: this indicator is for METATRADER4, if you want the version for METATRADER5 this is the link:  https://www.mql5.com/it/market/product/108106 TRENDMAESTRO ver 2.4 TRENDMAESTRO recognizes a new TREND in the bud, he never makes mistakes. The certainty of identifying a new TREND is priceless. DESCRIPTION TRENDMAESTRO identifies a new TREND in the bud, this indicator examines the volatility, volumes and momentum to identify the moment in which there is an explosion of one or more of these data a
Indicator : RealValueIndicator Description : RealValueIndicator is a powerful tool designed specifically for trading on the EURUSD pair. This indicator analyzes all EUR and USD pairs, calculates their real currency strength values, and displays them as a single realistic value to give you a head start on price. This indicator will tell you moves before they happen if you use it right. RealValueIndicator allows you to get a quick and accurate overview of the EURUSD currency pair tops and bottoms,
Enigmera
Ivan Stefanov
5 (2)
エニグメラ:市場の中核 https://www.enigmera.com はじめに このインディケータと取引システムは、金融市場に対する驚くべきアプローチです。ENIGMERAは、フラクタルサイクルを使用して、サポートとレジスタンスレベルを正確に計算します。本格的な蓄積局面を示し、方向性と目標を示します。 トレンド中でも調整中でも機能するシステムです。 どのように作動するのか? ENIGMERAは、支持線・抵抗線、目標線、乖離線の3つのラインで構成されています。このシステムは、過去のデータを現在と未来に外挿する典型的な市場指標とは異なり、現在の完全な画像を提供します。支持線上にある場合、それは本当の支持を意味し、抵抗線上にある場合、それは本当の抵抗を意味する。ある水準が破られた場合、それはトレンドの変化を意味する。再描画はしない。 市場は常に進化しているため、ENIGMERAはその評価ツールを適応させ、定期的に戦略を修正しています。  これにより、すべてのシナリオが徹底的に評価されることが保証されます。この市場指標の独自性は、その能力を見れば明らかです。  ENIGM
This indicator is based on the mathematics of the great trader W.D. Ganna. With its help, you can easily find strong levels by analyzing swings to find the optimal entry point. The indicator works on all instruments and all timeframes. The indicator is fully manual and has control buttons. All you need to do is press the NEW button, a segment will appear, which you can place on any movement, swing or even 1 candle that you want to analyze. By placing the segment, press the OK button. A grid (th
もちろんです。以下は、提供いただいたテキストの日本語への翻訳です: MT4用の天文学指標をご紹介します:究極の天体トレーディングコンパニオン トレーディング体験を天空の高みに高める準備はできていますか?私たちの革命的なMT4用の天文学指標をご紹介します。この革新的なツールは、複雑なアルゴリズムの力を借りて、類まれなる天文学的洞察と精密な計算を提供します。 あなたの指先で宇宙の情報を: 宝のような天文学的データが明らかになる包括的なパネルをご覧ください。惑星の地理的/太陽中心座標、太陽と地球の距離、星の大きさ、伸び、星座、黄道座標および赤道座標、さらには水平座標まで、それぞれが綿密に計算され美しく表示されています。指標によって生成される垂直線は時間値に対応し、トレーディングの旅に宇宙の視点を提供します。 惑星のラインと関係: グラフを飾る惑星のラインの魔法を体験し、スケールと角度をカスタマイズできます。直感的なコントロールパネルを介して各惑星のラインの表示を簡単に切り替えることができます。指定された時刻範囲内での合会、六分会、四分会、三分会、対会、逆行の指標で天体の関係の芸術を発見してく
The indicator of a Professional Trader is an arrow indicator for predicting the direction of price movement. I have been working on this indicator since 2014. You can use this indicator as your main indicator, use its entry signals, and use it as your only indicator to find entry points. About the product: Recommended TF [H4-D1-W1]   . The indicator predicts the direction of the next candle. Fits a variety of tools; Flexibility in settings for different instruments and intervals through the
このインジケータは、手動および自動的な方法でチャートに描かれたハーモニックパターンを検出します。ユーザーマニュアルは、このリンクから参照できます: あなたのレビューを追加し、入手するために私たちに連絡してください。 この製品をmt4で試すための無料版があります。 GartleyおよびNenstarパターンを検出するために使用できます。 https://www.mql5.com/en/market/product/30181 完全なMT4バージョンを購入するには、次の場所から購入できます。 https://www.mql5.com/en/market/product/15212 注 インジケータにはコントロールパネルがあり、すべての(チャート&時間枠)設定が保存されます。チャート上でスペースをより多く確保するために、最小化することができ、他の分析ツールで作業する場合は、すべてのインジケータデータを非表示にするために閉じるボタンを押すことができます。 このインジケータを使用して設定を変更し、移動平均やボリンジャーバンドなどのインジケータを追加すると、編集のテンプレートが自動的に保存され、必
The Volume by Price Indicator for MetaTrader 4 features Volume Profile and Market Profile TPO (Time Price Opportunity). Volume and TPO histogram bar and line charts. Volume Footprint charts. TPO letter and block marker collapsed and split structure charts. Session filtering and grouping. Static, dynamic and flexible range segmentation and compositing methods with relative and absolute visualizations. Graphical layering, positioning and styling options to suit the user's analytic and aesthetic n
Introduction to Fractal Pattern Scanner Fractal Indicator refers to the technical indicator that makes use of the fractal geometry found in the financial market. Fractal Pattern Scanner is the advanced Fractal Indicator that brings the latest trading technology after the extensive research and development work in the fractal geometry in the financial market. The most important feature in Fractal Pattern Scanner is the ability to measure the turning point probability as well as the trend probabi
ECM Elite Channel is a volatility-based indicator, developed with a specific time algorithm, which consists of finding possible corrections in the market. This indicator shows two outer lines, an inner line (retracement line) and an arrow sign, where the channel theory is to help identify overbought and oversold conditions in the market. The market price will generally fall between the boundaries of the channel. If prices touch or move outside the channel, it's a trading opportunity. The
Full Forex Market View Dashboard
Opengates Success International
5 (2)
FULL FOREX MARKET VIEWダッシュボードインジケーター これは、トレーダーが市場で何が起こっているかを完全に把握できるようにするために作成されたカスタム指標です。 リアルタイム データを使用して市場にアクセスし、取引を成功させるために必要なあらゆる情報を表示します。 インストール: このインジケーターをウィンドウ チャートに添付する前に、MT4 のマーケット ウォッチ パネルに移動し、不要な通貨ペアまたは取引しないすべての通貨ペアを非表示にして、残りをそこに残します。 その理由は、FFMV ダッシュボードが MT4 の気配値表示に表示されるすべての通貨ペアを表示するためです。 最大 30 通貨ペア以下を表示できます。 MT4 の気配値表示でそれ以上だと、FFMV ダッシュボードのフォントと画像がぼやけて変形します。 正しく表示されません。 使用法:      個人取引の場合      バスケット取引の場合 (方法についてはスクリーンショットを参照してください)      複数注文取引にも使用可能      独自の取引システムなどから
Cycle Sniper
Elmira Memish
4.39 (36)
NEW YEAR SALE PRICE FOR LIMITED TIME!!! Please contact us after your purchase and we will send you the complimentary indicators to complete the system Cycle Sniper is not a holy grail but when you use it in a system which is explained in the videos, you will feel the difference. If you are not willing to focus on the charts designed with Cycle Sniper and other free tools we provide, we recommend not buying this indicator. We recommend watching the videos about the indiactor and system before pu
3 Indicators in 1 indicator Strategy based on price action Made specifically for the best forex currency pairs Can be used in the best time frame of the market at a very reasonable price This indicator is basically 3 different indicatos . But we have combined these 3 indicators in 1 indicator so that you can use 3 indicators at the lowest price. All three strategies are based on price action. But based on different trends. Long term, medium term and short term Attributes : No repaintin
Step into the realm of Forex trading with confidence and precision using XQ, a cutting-edge Forex indicator designed to elevate your trading game to unprecedented heights. Whether you're a seasoned trader or just stepping into the world of currency exchange,   XQ Forex Indicator   empowers you with the insights and signals needed to make informed trading decisions. The signal conditions are a combination of three indicators, and XQ Forex Indicator only display  medium and long-term trends . The
驚異的なFXインジケーター「Miraculous」をご紹介します。完璧な結果を得るための1時間足を含むすべてのタイムフレームで効果的に機能する、最強の強力な特殊MT4フォレックスインジケーターです。 すべてのタイムフレームで優れた結果を提供する最高のFXインジケーターを探し続けるのに疲れましたか?これ以上探す必要はありません!「Miraculous」フォレックスインジケーターをご紹介します。このインジケーターは、トレーディングの経験を変革し、収益を新たなレベルに引き上げるために設計されました。 先進のテクノロジーと長年にわたる緻密な開発に基づいて構築された「Miraculous」フォレックスインジケーターは、FX市場における力と正確さの頂点となります。この素晴らしいツールは、すべてのレベルのトレーダーのニーズを満たすように設計されており、一貫した収益性を追求する上で比類のない優位性を提供します。 「Miraculous」フォレックスインジケーターの他との違いは、その非常に適応性にあります。デイトレーダー、スウィングトレーダーであろうと、長期ポジションを好む方であろうと、このインジケータ
[ MT5 Version ] Only the next 10 units at current price! Final price: $299 Are you tired of spending months on demo or live accounts to test your trading strategies? The Backtesting Simulator is the ultimate tool designed to elevate your backtesting experience to new heights. Utilizing Metatrader historical symbol information, it offers an unparalleled simulation of real market conditions. Take control of your testing speed, test ideas quickly or at a slower pace, and witness remarkable improvem
Wolfe Waves scanner - It scans all the Symbols and identify the movement of price and it gives confidence in trade. It automatically plots  fifth wave breaks out of the channel. According to the theory behind the pattern, a line drawn from the point at the beginning of the first wave and passing through the beginning of the fourth wave predicts a target price for the end of the fifth wave. If a trader properly identifies a Wolfe Wave as it forms, the beginning of the fifth wave represents an op
A. A2SR とは何ですか ?   * 先行テクニカル指標です (塗り直しなし、ラグなし)。 -- ガイダンス : -- https://www.mql5.com/en/blogs/post/734748/page4#comment_16532516 -- そして https://www.mql5.com/en/users/yohana/blog A2SR には、サポート (需要) とレジスタンス (供給) のレベルを決定する特別な手法があります。 ネットで見かける通常の方法とは異なり、A2SR は実際の SR レベルを決定する独自のコンセプトを持っています。 元の手法はインターネットから取得されたものではなく、インターネット上で公開されたこともありません。 A2SR は、取引スタイルに応じて SR レベルを自動選択します。 時間枠を変更しても、SR レベルはその位置にとどまります。 実際のSRは、使用する時間枠から取得されるわけではないため. A2SR には、取引のための完全な手段があります 。 実際のサポート (需要) とレジスタンス (供給) の真のコンセプト。
The NASDAQ 100 Power Indicator serves with TREND and trend reversals indication using automated arrows that indicates buy or sell at that price and has built-in signal provider across all time frames with alerts and provides also the automated support and resistance that can draw technical analysis patterns like double bottom, double top, head and shoulders etc. using closing and open prices, in assistance for if a trader did not see the pattern sooner for their technical analysis. The indicator
Bands Sniper
Abdulkarim Karazon
5 (1)
現在の価格は 10 部のみで、それ以降の価格は 90 ドルとなります 矢印付きのエンベロープとtmaに基づいたバンドスナイパーインジケーターは、動的なサポートとレジスタンスを示し、売買の矢印としてエントリーシグナルも与えるため、多目的のインジケーターです。 デフォルト設定は 1H の時間枠に基づいています。完全なガイドについては購入後にお問い合わせください。 エントリールール: 買い : 1.ローソク足は両バンドの下で終了          2.ローソク足 2 つの上矢印 (金色の矢印とオレンジ色の矢印) を使用して 2 つのバンド内で戻ります。 売り : 1.両方のバンドの上でローソク足で終了          2.ローソク足 2 つの下矢印 (金色の矢印とオレンジ色の矢印) を使用して 2 つのバンド内で閉じます。 TP 1 : ミドルバンドライン TP 2 : 逆バンド SL カップルが矢印の下でピップス 推奨される時間枠は : 15 分以上
SMCpro VIP MT4  Original Price  $630   ---  Currently Price 25% OFF ( for unlimited use )   BONUS  AUX VIP Club 2024 : Include  EA Airbag  and  Load Data History  to enhance the performance of this tool to its maximum potential  Click Here to Download Files   ( for users only )   Hello World! Introducing.. SMCpro VIP tool and Indicator for MetaTrader 4, designed to revolutionize your trading experience with the ICT Smart Money Concept. This system is meticulously crafted to empower trad
An extremely convenient indicator that truly makes the process of making money on the exchange easy. It is based on the scientifically rigorous theory of the market developed by the author, the beginning of which is presented here .                The full algorithm of this indicator operation is presented in the article .               The indicator calculates the most probable price movement trajectory and displays it on the chart. Based on the predicted price movement trajectory
スイングトレーディング は、トレンドの方向のスイングと可能な反転スイングを検出するように設計された最初のインジケーターです。トレーディングの文献で広く説明されているベースラインスイングトレーディングアプローチを使用します。インディケータは、いくつかの価格と時間のベクトルを調査して、全体的なトレンドの方向を追跡し、市場が売られ過ぎまたは買われ過ぎて修正の準備ができている状況を検出します。 [ インストールガイド | 更新ガイド | トラブルシューティング | よくある質問 | すべての製品 ] むち打ちを起こさずに市場スイングの利益 インジケーターは常にトレンドの方向を表示します 色付きの価格帯は機会のベースラインを表します 色付きのダッシュは、可能な反転スイングを表します この指標は、独自の品質とパフォーマンスを分析します 複数時間枠のダッシュボードを実装します カスタマイズ可能なトレンドおよびスイング期間 電子メール/サウンド/プッシュアラートを実装します インジケータは再描画またはバックペインティングではありません Swing Tradingとは Swing Tradi
フルSTOインジケータ(3つのSTOインジケータのすべてのバージョンを含む:プレミアム、ゴールド、シルバー) - STABLE TRADE OPTIONは、自動バイナリーオプション取引のために設計されています。 注意深くお読みください! 重要 1つのターミナルで、異なる有効期限を持つ2つのテンプレートを作成します。18:01、18:02のテンプレートは有効期限が1~15分、22:00のテンプレートは有効期限が10~20分です。 勝率:過去5年間で71 資金管理: 預金から0.3 このバージョンのインジケータは、モスクワ時間18:01、18:02、22:00の取引にのみ設定され、有効期限は銀と金が1~15分、プレミアムバージョンは10~20分です。シグナルはローソク足の内側に表示され、すぐに取引を開始します。 インジケータは完全に設定されているので、自分で何かを変更する必要はありません。インストールして取引してください! 実際の口座でstoの全バージョンをチェックし、結果を確認するのに2年以上かかりました。長年のテストの結果、最適なパラメータが選択さ
作者のその他のプロダクト
Bill Williams Advanced is designed for automatic chart analysis using Bill Williams' "Profitunity" system. The indicator analyzes four timeframes at once. Manual (Be sure to read before purchasing) Advantages 1. Automatically analyzes the chart using the "Profitunity" system of Bill Williams. The found signals are placed in a table in the corner of the screen. 2. Equipped with a trend filter based on the Alligator indicator. Most of the system signals are recommended to be used only accordi
Gartley Hunter Multi - An indicator for searching for harmonic patterns simultaneously on dozens of trading instruments and on all possible timeframes. Manual (Be sure to read before purchasing) | Version for MT4 Advantages 1. Patterns: Gartley, Butterfly, Shark, Crab. Bat, Alternate Bat, Deep Crab, Cypher 2. Simultaneous search for patterns on dozens of trading instruments and on all possible timeframes 3. Search for patterns of all possible sizes. From the smallest to the largest 4. A
Trading History - A program for trading and money management on the history of quotes in stratagy tester. It can work with pending and immediate orders, and is equipped with trailing stop, breakeven and take profit functions. Very good for training and testing different strategies. Manual (Be sure to read before purchasing) Advantages 1. Allows you to test any trading strategy in the shortest possible time 2. An excellent simulator for trading training. You can gain months of trading experi
The Price Action Finder Multi indicator is an indicator of entry points that searches for and displays Price Action system patterns on dozens of trading instruments and on all standard time frames: (m1, m5, m15, m30, H1, H4, D1, Wk, Mn). The indicator places the found patterns in a table at the bottom of the screen. By clicking on the pattern names in the table, you can move to the chart where this pattern is located. Manual (Be sure to read before purchasing) | Version for MT4 Advantages 1. Pa
Fractal Advanced - displays Fractal and Alligator indicators on the price chart. Has wide options for settings and customization. It is also equipped with alerts and a hotkey system. Manual (Be sure to read before purchasing) | Version for MT4 Advantages 1. The indicator does not fill the entire chart with fractals, but allows you to display only relevant signals. 2. The number of fractals is adjusted by scrolling the mouse while holding down the Shift key. 3. Instantly show/hide the Alligator
Gartley Hunter - An indicator for searching for harmonic patterns (Gartley patterns) and their projections. The indicator is equipped with a system of alerts and push notifications. Manual (Be sure to read before purchasing) | Version for MT4 Advantages 1. 12 harmonic patterns: 7 classical and 5 exotic. New patterns will be added as the indicator develops. 2. Constant automatic search for harmonic patterns. The indicator is capable of finding from the smallest to the largest patterns. 3. Autom
Trader Evolution
Siarhei Vashchylka
5 (3)
" Trader Evolution " - A utility designed for traders who use wave and technical analysis in their work. One tab of the utility is capable of money management and opening orders, and the other can help in making Elliott wave and technical analysis. Manual (Be sure to read before purchasing) | Version for MT4 Advantages 1. Trading in a few clicks. Immediate and pending orders are available in the panel 2. Money management. The program automatically selects the appropriate lot size 3. Simpli
Elliott Wave Helper
Siarhei Vashchylka
4.92 (12)
Elliott Wave Helper - a panel for making elliott wave and technical analysis. Includes all known wave patterns, support and resistance levels, trend lines and cluster zones. Manual (Be sure to read before purchasing) | Version for MT4 Advantages 1. Making wave analysis and technical analysis in a few clicks 2. All Elliott wave patterns available, including triangle and combinations 3. All nine wave display styles, including a special circle font 4. E lements of technical analysis : trend lines
The Price Action Finder indicator is an indicator of entry points, which is designed to search and display patterns of the Price Action system on a price chart. The indicator is equipped with a system of trend filters, as well as a system of alerts and push notifications. Manual (Be sure to read before purchasing) | Version for MT5 Advantages 1. Patterns: Pin bar, Outside bar, Inside bar, PPR, Power bar, Hanging man, Inverted hammer 2. Pattern filtering system. Removes countertrend patterns fro
The Price Action Finder indicator is an indicator of entry points, which is designed to search and display patterns of the Price Action system on a price chart. The indicator is equipped with a system of trend filters, as well as a system of alerts and push notifications. Manual (Be sure to read before purchasing) | Version for MT4 Advantages 1. Patterns: Pin bar, Outside bar, Inside bar, PPR, Power bar, Hanging man, Inverted hammer 2. Pattern filtering system. Removes countertrend patterns fro
The Price Action Finder Multi indicator is an indicator of entry points that searches for and displays Price Action system patterns on dozens of trading instruments and on all standard time frames: (m1, m5, m15, m30, H1, H4, D1, Wk, Mn). The indicator places the found patterns in a table at the bottom of the screen. By clicking on the pattern names in the table, you can move to the chart where this pattern is located. Manual (Be sure to read before purchasing) | Version for MT5 Advantages 1. Pa
" Trader Evolution " - A utility designed for traders who use wave and technical analysis in their work. One tab of the utility is capable of money management and opening orders, and the other can help in making Elliott wave and technical analysis. Manual (Be sure to read before purchasing) | Version for MT5 Advantages 1. Trading in a few clicks. Immediate and pending orders are available in the panel 2. Money management. The program automatically selects the appropriate lot size 3. Simpli
The " Stochastic Advanced " indicator displays the signals of the 'Stochastic" indicator directly on the chart without the presence of the indicator itself at the bottom of the screen. The indicator signals can be displayed not only on the current timeframe, but also on a timeframe one level higher. In addition, we have implemented a filter system based on the Moving Average indicator. Manual (Be sure to read before purchasing) | Version for MT4 Advantages 1. Displaying the signals of the "Sto
Pure View
Siarhei Vashchylka
5 (1)
The " Pure View " indicator is designed to quickly display and hide indicators on the chart. Description 1. Currently Pure View works with Stochastic, MACD, RSI indicators 2. Displaying and hiding indicators occurs using hot keys 3. The key combination Shift + C will display or hide the "Stochastic" indicator on the chart 4. The key combination Shift + V will display or hide the "RSI" indicator on the chart 5. The key combination Shift + B will display or hide the "MACD" indicator on the chart
FREE
Elliott Wave Helper - a panel for making elliott wave and technical analysis. Includes all known wave patterns, support and resistance levels, trend lines and cluster zones. Manual (Be sure to read before purchasing) | Version for MT5 Advantages 1. Making wave analysis and technical analysis in a few clicks 2. All Elliott wave patterns available, including triangle and combinations 3. All nine wave display styles, including a special circle font 4. E lements of technical analysis : trend lines
Trading Helper - Program for trading and money management. It works with pending and immediate orders, and is equipped with trailing stop, breakeven and take profit functions. Manual (Be sure to read before purchasing) Advantages 1. Comfortable trading in a few clicks. Immediate and pending orders are available in the panel 2. Fixed percent method. The panel can select the lot size based on a predetermined risk 3. Trading with a fixed lot. In a few clicks, select a lot and open a Trade 4.
Gartley Hunter MT4
Siarhei Vashchylka
3.67 (3)
Gartley Hunter - An indicator for searching for harmonic patterns (Gartley patterns) and their projections. The indicator is equipped with a system of alerts and push notifications. Manual (Be sure to read before purchasing) | Version for MT5 Advantages 1. 12 harmonic patterns: 7 classical and 5 exotic. New patterns will be added as the indicator develops. 2. Constant automatic search for harmonic patterns. The indicator is capable of finding from the smallest to the largest patterns. 3. Autom
The " Stochastic Advanced " indicator displays the signals of the 'Stochastic" indicator directly on the chart without the presence of the indicator itself at the bottom of the screen. The indicator signals can be displayed not only on the current timeframe, but also on a timeframe one level higher. In addition, we have implemented a filter system based on the Moving Average indicator. Manual (Be sure to read before purchasing) | Version for MT5 Advantages 1. Displaying the signals of the "Sto
Fractal Advanced - displays Fractal and Alligator indicators on the price chart. Has wide options for settings and customization. It is also equipped with alerts and a hotkey system. Manual (Be sure to read before purchasing) | Version for MT 5 Advantages 1. The indicator does not fill the entire chart with fractals, but allows you to display only relevant signals. 2. The number of fractals is adjusted by scrolling the mouse while holding down the Shift key. 3. Instantly show/hide the Alligato
フィルタ:
tonysaulet
413
tonysaulet 2023.10.03 11:44 
 

An indicator of quality and professionalism. This rating will rise to 5 stars once the "Horizontal Dash" mode is finalized, making this indicator ergonomic and professional on horizontal screens.

dssstrgr
132
dssstrgr 2023.01.15 12:57 
 

Очень удобный. Можно не лазить по инструментам, а просто ждать сигналы и уже потом смотреть - стоит ли входить в рынок. Существенно экономит время. Кроме того, торговля по паттернам Гартли достаточно эффективна. Спасибо разработчикам.

Konstantin Korol
416
Konstantin Korol 2022.12.04 13:05 
 

Отличный индикатор! Я за пару сигналов отбил его стоимость. Конечно безупречно никто не покажет где купить где продать, но тут если приноровиться, можно заработать.

レビューに返信
バージョン 1.5 2024.06.04
- Added font parameter for indicator panel buttons Button_Main_Size
- Added font parameter for pattern name buttons Button_List_Pattern_Size
バージョン 1.4 2024.05.31
- Changed the colors of the pattern buttons depending on their age/importance. Patterns <5 bars will be the brightest, <10 bars dimmer, <30 bars the dimmer.
- Added a new appearance for stop and profit zones without filling, which solves the problem of zones disappearing when two patterns are superimposed. The "Z" button on the panel is responsible for this.
- Added price tags to the stop and two profit levels. It can be turned off through the panel in the upper left corner of the indicator. 'Nu' button.
- Added the ability to add/remove the name of a pattern. The "N" button on the panel is responsible for this.
- Added the ability to add/remove pattern fills. The "T" button on the panel is responsible for this.
- Added the ability to add/remove names of pattern elements. The "Tx" button on the panel is responsible for this.
バージョン 1.3 2024.04.18
Improved pattern formation algorithm
バージョン 1.2 2023.09.28
Added the ability to display a table with patterns horizontally
バージョン 1.1 2022.11.28
Fixed bug of not displaying some instruments