• 概要
  • レビュー (15)
  • コメント (36)
  • 最新情報

Italo Volume Indicator MT5

4.69

BUY INDICATOR AND GET EA FOR FREE AS A BONUS + SOME OTHER GIFTS!

ITALO VOLUME INDICATOR is the best volume indicator ever created, and why is that? The Indicator works on all time-frames and assets, indicator built after 6 years of experience on forex and many other markets. You know many volume indicators around the internet are not complete, does not help, and it's difficult to trade, but the Italo Volume Indicator is different, the Italo Volume Indicator shows the wave volume, when market is going to trend or consolidate and candle volume, all of that in one simple and clear Indicator!

Italo Volume Indicator is profitable and stable, and it will show you the real trends and filter out all consolidation. The Italo Volume Indicator has an Edge over the market, this means you will predict where the next trend It's going to be with the highest probability every single time.

You will have on your hands a predictor of market movement in a very precise way.

The Indicator does not repaint, the Italo Volume Indicator was made to make you a successful trader.

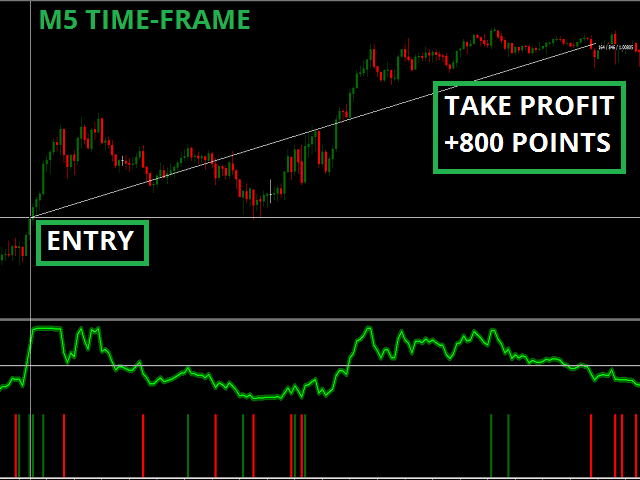
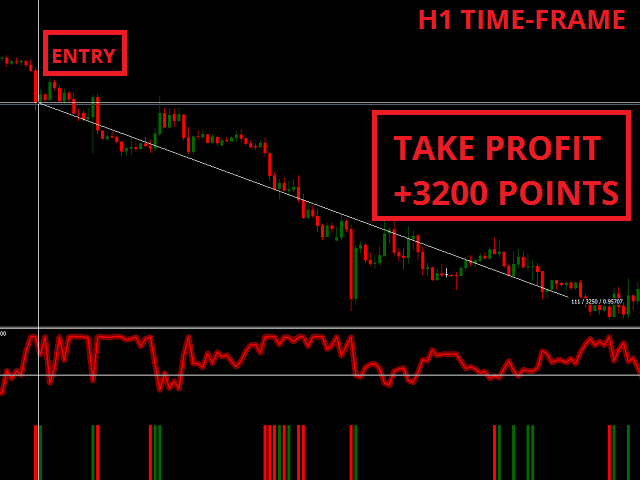
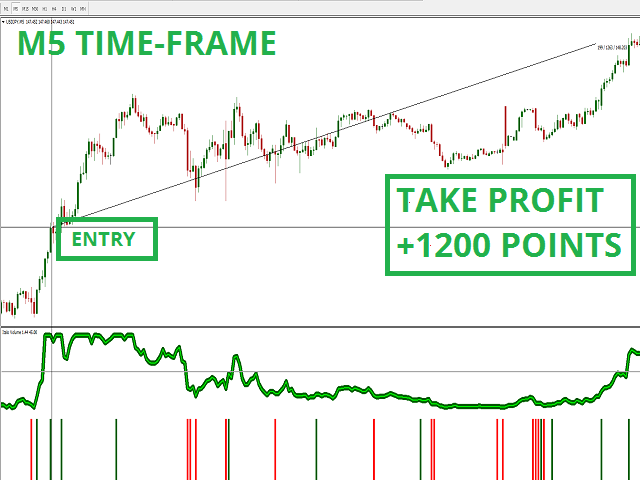
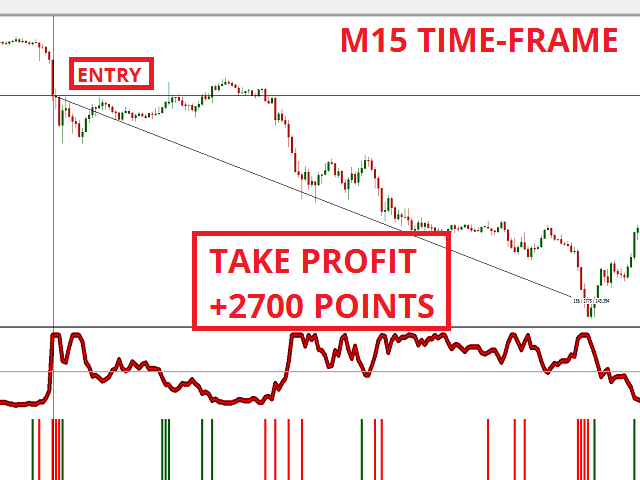
The Indicator shows an upper colored line green or red that is the wave volume and a grey horizontal line, above grey horizontal line we have a trend, bellow we have consolidation. The histogram bellow is the candle volume green or red, serving as a confirmation to enter the market.

Now you have the perfect volume indicator, you will see and trade with confidence since you know in front of you is the best volume tool to enter the market, wave volume and candle volume at the same time, with this combination you have more probability than any other trader on the market to predict its movement and achieve what you want!


MT4 Version: https://www.mql5.com/en/market/product/88552

IMPORTANT! Contact me after the purchase to get the bonuses!


Benefits of Italo Volume Indicator

  • Unique Algorithm 
  • Predict Trends
  • Filter Consolidation
  • Show wave and candle volume at the same time
  • Time-frames: All
  • Assets: All
  • Easy to use, does not overload charts with unnecessary information
  • Does not repaint
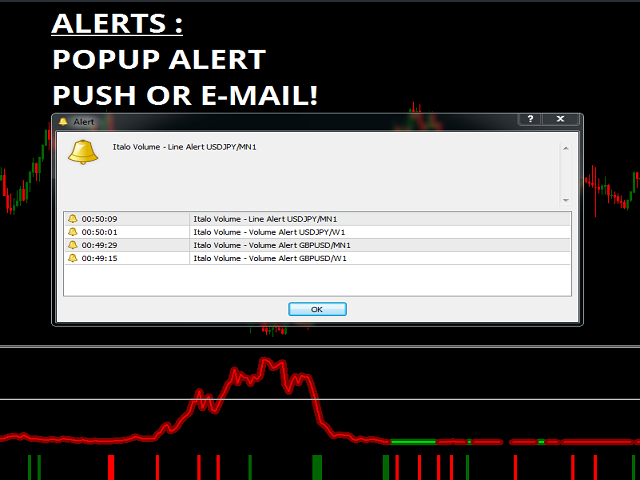
  • Alerts on charts when the wave or candle volume appears
  • Full customization: Color, styles and size of wave volume
  • Excellent product support


Important Parameters

  • Trend Period and Force Period: Volume Wave Number
  • Line Level: Horizontal Line Position (Above: Trend, Bellow: Consolidation)
  • History Candles Count: how many candles on the past chart you want to see the indicator in
  • Line Neon: If "Off" would be a simple colored line.
  • Show Volumes: Histogram Candle Volume "On" or "Off"
  • Volume level: Candle Volume Position
  • Alerts_On: if "On" you will have 2 alerts on your chart, the alert when the Upper line green or red goes above the horizontal grey line, indicating wave trend. And the alert when you have a candle volume on histogram.


I will always help you if you have any questions

For any questions related to the purchase, installation, backtesting and use of the Indicator you can send me a private message on my profile here on mql5:

https://www.mql5.com/en/users/italobr


レビュー 15
fdepina
65
fdepina 2023.05.05 23:17 
 

Uma ferramenta excelente e impressionante. Comprei ontem e testei de cara em M1 em conformidade com trendlines de 200 velas, RSI multitimeframe mostrando o RSI de 15 e 30min, uma HMA de 100 períodos como indicador de suporte e resistência dentro do canal de 500 velas, ficou um absurdo! Acho que alcancei o nirvana dos setups! Vou comprar depois o de tendência só para ter o super combo. Melhor indicador de volume que já vi e isso não é exagero. Excelente trabalho do Ítalo.Podem investir sem medo, a configuração padrão atende perfeitamente e se foi tão bom em M1 cuja oscilação é grande, em períodos maiores não precisa de conformidade, basta seguir os mostradores dentro do próprio indicador.

Sergio Ricardo Hiratsuka
130
Sergio Ricardo Hiratsuka 2023.04.26 13:26 
 

Comprei o indicador Italovolume e recomendo muito. ainda estou adaptando na minha estrategia ,eh um otimo norte nas tomadas de decisoes e com uma acertividade muito boa ,dificil de encontrar algo assim e que nw repinta no universo dos indicadores .Suporte super rapido tbm !!!!

T.J.Sch_318798
216
T.J.Sch_318798 2023.04.01 12:52 
 

Super Great Indicator. I'm using it on M1 which works great, helps me to identify when worth to buy or sell, appreciate your trust on my work. I'm happy to have it.

おすすめのプロダクト
VR Pivot - これは、主要なピボットポイント(pivot)の指標です。 ピボットポイントは、最強の価格帯を識別するために使用される特別なタイプのサポートレベル(support)と抵抗(resistance)です。プロのトレーダーは、価格の反転の高い確率がある価格を決定するために逆転のポイントを使用します.レベルは、特別な数式に従って計算され、終了、開口部、最大、前の期間の最小値の価格が考慮されます。最も効果的なのは、毎日の期間です。一見すると、これらのレベルに特別なものは何もないと思われるかもしれませんが、ピボットポイントのレベルの助けを借りて価格の動きを分析すると、ほとんどの場合、これらのレベルが良好で正確な結果を示していることがわかります。 テクニカルサポート、設定およびソフトウェアの体験版は、作者のプロファイルによりリクエスト できます。 逆転ポイントは、ピボットポイントとしてだけでなく、最大利益のために可能な限り効率的に使用できるレベルとして使用することができます, 損失を最小限に抑えるために損失を停止, リスクを軽減するために、損失ゾーンにポジションを転送. インジケ
35 USD
The Rocket Trend indicator is trending. The indicator draws two-color points connected by lines along the chart. This is a trend indicator, it is an algorithmic indicator. It is easy to work and understand when a blue circle appears, you need to buy, when a red one appears, sell. The indicator is used for scalping and pipsing, and has proven itself well. Rocket Trend is available for analyzing the direction of the trend for a specific period of time. Ideal for novice traders learning the laws o
79 USD
The indicator plots flexible support and resistance levels (dots). A special phase of movement is used for construction. Levels are formed dynamically, that is, each new candle can continue the level or complete it. The level can provide resistance or support to the price even where it is no longer there. Also, support and resistance levels can change roles. The importance of levels is affected by: the amount of time the level is formed and the number of touches. The significance of these l
75 USD
WAPV Weis Wave Chart Forex
Eduardo Da Costa Custodio Santos
The Weis Wave Chart Forex for MT5 is a Price and Volume indicator. The Price and Volume reading was widely disseminated through Richard Demille Wyckoff based on the three laws created by him: Supply and Demand, Cause and Effect and Effort vs. Result. In 1900 R.Wyckoff already used the wave chart in his analyses. Many years later, around 1990, David Weis Automated R. Wyckoff's wave chart and today we bring you the evolution of David Weis' wave chart. It shows the amount of Volume and the amount o
100 USD
Indicator SR levels true in small time frames is very useful for scalping while in bigger ones it is good for day or position trading. SR levels true can draw 4 support/resistance levels based on defined maximum rebouds from price level. Indicator scans  defined number of bars in time axis and defined number of pips in price axis (both sides - up and down) and calculates how much times price was rejected from scanned price levels. At the price levels where maximum rebounds are counted, support
30 USD
Do you use volume in your reading of the market? Certainly many traders use it, and do not imagine operating without it. The Color Histogram Volume Set indicator allows the user to choose the value that he considers interesting to monitor. When you pass this you will have visual confirmation and if you want you will also have the audible alert that is given by the indicator. Of course, there are other ways to try to find a high volume, such as assessing whether the volume
30 USD
WT Vwap 5 Bands The WT Vwap Bands indicator is an indicator that combines price and volume, helping to show whether the price is within the "fair price", overbought or oversold. The indicator code was designed for performance and has already been tested in a real trading account. In addition to the visual inputs (color, thickness and line style), the user can define a% value that depends on the price. The default values work with the most distant band at 1% of the price and then di
50 USD
Key level wedge MT5
Presley Annais Tatenda Mfck
The   Key level wedge MT5   indicator automatically draws rising wedge pattern and falling wedge pattern for you on the chart. This pattern is really good when used as a confirmation entry at key support & resistance, supply & demand and reversal zones. Advantages  The   Key level wedge MT5   block DOES NOT RE-PAINT, giving you confidence when a signal appears and also helps when looking back.  The   Key level wedge MT5   includes an on/off button on the chart to easily keep the charts cle
59 USD
- Times and Trades, também chamado de Time and Sales ou histórico de negócios, é uma ferramenta essencial para quem opera através do Tape Reading (Fluxo). - O Metatrader 5 não informa os dados das corretoras, sendo assim, impossível diferenciar quem enviou a ordem. - Os dados só podem ser usados por corretoras que informam os dados dos volumes de negociação, como a B3. No mercado forex não é possível usar.
50 USD
For those who appreciate Richard Wyckoff approach for reading the markets, we at Minions Labs designed a tool derived - yes, derived, we put our own vision and sauce into this indicator - which we called Waves PRO . This indicator provides a ZigZag controlled by the market volatility (ATR) to build its legs, AND on each ZigZag leg, we present the vital data statistics about it. Simple and objective. This indicator is also derived from the great book called " The Secret Science of Price and Volum
79 USD
Trend Fibonacci is a unique indicator that combines a power of Fibonacci sequences and ranges. How to read: - There are three zones --> red, gold and green - Red candlestick = downtrend - Green candlestick = uptrend   - Gold candlestick = no established trend Inputs: Per = number of bars used for calculations FirstRatio = first Fibonacci ratio (Or use any ratio you want) SecondRatio = second Fibonacci ratio (Or use any ratio you want) !! IF YOU PURCHASE THE INDICATOR, CONTACT ME FOR
47 USD
Skiey - Indicator of easy solutions! Using this indicator is very simple, since the simplest is to look at the chart and act according to the color arrows. Such a calculation option takes into account intraday price fluctuations and focuses on measuring the "candlestick" share in the trend. The algorithm takes into account the measurement of prices, this method also emphasizes the measurement of each of the price drops (H / C, H / O, LC, LO) - which gives more detailed information but also mo
130 USD
Tape Reading, flow monitoring. FabFlowInPrice   is a powerful indicator for those who like Tape Reading (Times & Trades). It presents the volumes traded at each price level, considering the purchase, sale and direct aggressions for each level. Excellent tool for market flow analysis. Thought of flow so monitor who is attacking the most, buyers, sellers or direct exchanges, thought FabFlowInPrice. The indicator displays information in 4 distinct and fixed periods, on any timeframe: @Day - All
150 USD
This indicator is an extended implementation of Weis waves. It builds Weis waves on absolute volumes (which is the classical approach) or delta of volumes (unique feature) using different methods of wave formation and visualization. It works with real volumes, if available, or with tick volumes otherwise, but also provides an option to use so called "true volume surrogates", as an artificial substitution for missing real volumes (for example, for Forex symbols), which was introduced in correspo
49 USD
CoioteChart
Alexandre Moraes De Souza Lima
O Indicador CoioteChart foi construído pra facilitar desde a leitura de contexto de mercado até a micro estrutura do candle, facilitando ajustes operacionais e tomadas e decisão com alta eficácia. Possui um controle para habilitar e desabilitar a visualização das pocs, vwap, zonas de máxima e mínima negociação, pode ser utilizado data sources de tempos gráficos para cálculos ou utilizado os ticks de agressão do time and trades, funciona com volume real e volume de ticks. As colorações são at
60 USD
M & W Pattern Pro is an advanced scanner for M and W patters , it uses extra filters to ensure scanned patterns are profitable. The indicator can be used with all symbols and time frames. The indicator is a non repaint indicator with accurate statistics calculations. To use , simply scan the most profitable pair using the statistics dashboard accuracy , then enter trades on signal arrow and exit at the TP and SL levels. STATISTICS : Accuracy 1 : This is the percentage of the times price hit
89 USD
The Tik Tok indicator was created on the basis of the original extreme search indicators, the indicator is well suited for determining a reversal or a big sharp jerk in one direction, thanks to it you will know when this happens it will notify you when a blue dot for buying red for sale appears. It basically uses the process of detecting the rate of change in price growth and allows you to find entry and exit points from the market. fundamental technical indicator that allows you to assess th
78 USD
Easily get all relevant economic events of the current day right into your chart, as markers. Filter what kind of markers do you want: by country (selected individually) and by Importance (High relevance, Medium, Low or any combination of these). Configure the visual cues to your liking. Additionaly you have the ability to add up to 5 personal markers of your own agenda. With Alerts and/or with blackout periods, if you are using it within an Expert Advisor! All in one Economic Calendar indicator
30 USD
Limitless MT5 is a universal indicator suitable for every beginner and experienced trader. works on all currency pairs, cryptocurrencies, raw stocks Limitless MT5 - already configured and does not require additional configuration And now the main thing Why Limitless MT5? 1 complete lack of redrawing 2 two years of testing by the best specialists in trading 3 the accuracy of correct signals exceeds 80% 4 performed well in trading during news releases Trading rules 1 buy signa
1 399 USD
No Demand No Supply MT5
Trade The Volume Waves Single Member P.C.
No Demand No Supply   This indicator identifies   No Demand –No Supply candles  to your chart and plots volume bars colored according to the signal. It can be applied to all timeframes or to a specific one only. It can also be used as regular volume indicator  with exceptional future of WEIGHTED VOLUME. Furthermore is has an alert notification, sound and email when a signals occurs. The indicator does not repaint but the alert will come on two candles back due to the definition of No Demand No S
80 USD
It is very easy to use the Fibrillar indicator, since the simplest is to look at the chart and act according to the indications of the colored arrows. The algorithm takes into account the measurement of prices, and this method also focuses on measuring each of the price drops (H / C, H / O, LC, LO) - which gives more detailed information, but also more averaged. When calculating this indicator, logarithmic gains are first calculated at the closing price, which allows you to filter out the tre
66 USD
This z-score indicator shows the correct z-score of an asset, as it uses the normalized price data for calculation, which is the only correct way. Z-score is only applicable for normal distributed data, therefore not the actual price is considered, but the normalised returns, which were assumed to follow a normal distribution. Returns are mean reverting and assumed to follow a normal distribution, therefore z-score calculation of returns is more reliable than z-score on price, as price is NOT m
99 USD
BTFX Pivot Points
Bradley Thomas Farrington
BTFXピボットポイントは、毎日のサポートレベルとレジスタンスレベルを計算するインジケーターです。   この指標を使用することにより、ピボットレベルは目標とする明確な目標を示します。   抵抗レベルは、銀色のピボット線の上に紫色で表示されます。   サポートレベルはオレンジ色で表示され、銀色のピボットラインの下にあります。   このインジケーターは、BTFX夜明けインジケーターと一緒に使用すると非常にうまく機能します。   これらの指標の詳細については、添付のYouTubeビデオをご覧ください。   その他のお問い合わせは、メールまたはお電話にてお問い合わせください。   support@besttradesfx.co.uk   01827 842 418
35 USD
Daily VWAP, continues for a period of hours (eg, 10 hours of history), with color to indicate change of direction and bands to map good entry and exit points. The indicator was created to map the center of the market, and find good buying moments, trend analysis or market correction points are easily detected, allowing you to understand moments of exhaustion and buying and selling points Copyright (c) <year> <copyright holders> Permission is hereby granted, free of charge, to any person obtain
30 USD
TPO Profile MT5
Kyra Nickaline Watson-gordon
Definition : TPO is a Time Price Opportunity. Instead of using bars or candles with an Open, High, Low, and Close price, each "bar" in a Market Profile is represented by horizontal bars against the price It is called Market Profile terminology. In other words time-price-opportunity (TPO) profiles are histograms of how much time was spent at each price within the span of the profile. By using a TPO chart, you are able to analyze the amount of trading activity, based on time, for each price leve
60 USD
Highlighted Candle Signs MT5
Luis Paulo Rodrigues Pastor
1 (1)
Indicator designed to give investors the advantage of identifying strong candlestick patterns in real time by staining candlesticks representing these patterns, using possible buy or sell performance. The color for each pattern identified by the parameter indicator according to your taste. The candlestick patterns identified by this indicator are: Inside Bar Closing Price Reverse Top (PFRA) Closing Price Reverse Bottom (PFRB) Dave Landry Bullish Engulf Bearish Engulf Advantages: Real Time At ea
35 USD
The patterns of 3 (three) Candles: Three White Soldiers; Three Black Crows; These are reversal patterns widely used by traders, as they have a high probability of showing the inversion of the current market movement. For example, if in a bullish trend there are three black crows, there is a high probability of reversing the current bullish movement. The Three White Soldiers have the following characteristics: There are 3 consecutive candles with a good body, that is, the difference between
39 USD
The WT Vwap Bands indicator is an indicator that combines price and volume, helping to show whether the price is within the "fair price", overbought or oversold. The indicator code was designed for performance and has already been tested in a real trading account. In addition to the visual inputs (color, thickness and line style), the user can define a% value that depends on the price. The default values work with the most distant band at 1% of the price and then dividing this distan
40 USD
A useful scanner/dashboard that shows the RSI values for multiple symbols and Time-frames. It can be easily hidden/displayed with a simple click on the scanner man top left of the dashboard. You can input upper and lower RSI values and the colours can be set to show when above/below these values. The default values are 70 and 30. There are also input colours for when the RSI is above or below 50 (but not exceeding the upper/lower levels Symbols and time-frames are input separated by commas.
80 USD
このプロダクトを購入した人は以下も購入しています
これはMT5のインジケーターで、再描画なしで取引に参入するための正確なシグナルを提供します。 外国為替、暗号通貨、金属、株式、インデックスなど、あらゆる金融資産に適用できます。かなり正確な見積もりを提供し、取引を開始して終了するのに最適な時期を教えてくれます。1つのシグナルを処理しただけでインジケーターの元が取れた例の 動画 (6:22)をご覧ください。Entry PointsPro インジケーターの助けを借りたほとんどのトレーダーの最初の1週間の結果が改善しています。 Telegramグループ に登録してください。Entry Points Proインジケーターのメリットは次の通りです。 再描画のないエントリーシグナル 再描画されるインジケーターでは一度表示されたシグナルが削除されて大きな金銭的損失につながることがありますが、これと異なり、表示されて確認されたシグナルは消えることがありません。 エラーなしの取引開始 インジケーターアルゴリズムによって取引を開始する(資産を売買する)理想的な瞬間を見つけることができます。それを使用するすべてのトレーダーの成功率が向上します。
125 USD
Matrix Arrow Indicator MT5
Juvenille Emperor Limited
5 (11)
マトリックスアローインジケーターMT5は、すべてのシンボル/商品(外国為替、商品、暗号通貨、インデックス、株式)で使用できる100%再描画されていないマルチタイムフレームインジケーターに続くユニークな10in1トレンドです。マトリックスアローインジケーターMT5は、初期段階で現在のトレンドを判断し、最大10の標準インジケーターから情報とデータを収集します。 平均方向移動指数(ADX) 商品チャネルインデックス(CCI) クラシック平研アシキャンドル 移動平均 移動平均収束発散(MACD) 相対活力指数(RVI) 相対力指数(RSI) 放物線SAR ストキャスティクス ウィリアムズのパーセント範囲 すべてのインジケーターが有効な買いまたは売りシグナルを与えると、対応する矢印がチャートに印刷され、次のろうそく/バーの開始時に強い上昇トレンド/下降トレンドを示します。ユーザーは、使用するインジケーターを選択し、各インジケーターのパラメーターを個別に調整できます。マトリックスアローインジケーターMT5は選択されたインディケーターからのみ情報を収集し、それらのデータのみに基づいてアローを印
75 USD
Supply Demand uses previous price action to identify potential imbalances between buyers and sellers. The key is to identify the better odds zones, not just the untouched ones. Blahtech Supply Demand indicator delivers functionality previously unavailable on any trading platform. This 4-in-1 indicator not only highlights the higher probability zones using a multi-criteria strength engine, but also combines it with multi-timeframe trend analysis, previously confirmed swings and engulfing detecto
99 USD
これはほぼ間違いなく、MetaTraderプラットフォームで見つけることができる最も完全な調和価格形成自動認識インジケーターです。 19種類のパターンを検出し、フィボナッチプロジェクションをあなたと同じように真剣に受け止め、潜在的逆転ゾーン(PRZ)を表示し、適切なストップロスとテイクプロフィットレベルを見つけます。 [ インストールガイド | 更新ガイド | トラブルシューティング | よくある質問 | すべての製品 ] 19の異なる調和価格形成を検出します プライマリ、派生および補完フィボナッチ投影(PRZ)をプロットします 過去の価格行動を評価し、過去のすべてのパターンを表示します この指標は、独自の品質とパフォーマンスを分析します 適切なストップロスとテイクプロフィットのレベルを表示します ブレイクアウトを使用して適切な取引を通知します すべてのパターン比をグラフにプロットします 電子メール/音声/視覚アラートを実装します スコット・M・カーニーの本に着想を得て、この指標は最も純粋で急を要するトレーダーのニーズを満たすように設計されています。ただし、トレードを
249 USD
インジケーターガイド  |  Owl Smart Levels戦略   |   MT4版  |  インストールする方法?   |   FAQ Owl Smart Levels Indicator は、 Bill Williams の高度なフラクタル、市場の正しい波構造を構築する Valable ZigZag、エントリの正確なレベルをマークする Fibonacci レベルなどの一般的な市場分析ツールを含む 1 つのインジケーター内の完全な取引システムです。 利益を得るために市場と場所に。 取引システムの詳細な説明については、 Owl Trend Strategy - Smart Levels の記事を参照してください  力はシンプルさにあります! Owl Smart Levels 取引システムは非常に使いやすいので、専門家にも、市場を勉強し始めて自分で取引戦略を選択し始めたばかりの人にも適しています。 戦略と指標に秘密の数式や計算方法が隠されているわけではなく、すべての戦略指標は公開されています。 Owl Smart Levels を使用すると、取引を開始するためのシグナルをすばやく
97 USD
現在33%オフ 初心者にもエキスパートトレーダーにも最適なソリューション このインジケーターは独自の機能と新しい公式を多数内蔵しており、ユニークで高品質かつ手頃な取引ツールです。このアップデートでは、2つの時間枠ゾーンを表示できるようになります。より長いTFだけでなく、チャートTFとより長いTF(ネストゾーンを表示)の両方を表示できます。すべてのSupply Demandトレーダーの皆さんのお気に召すはずです。:) 重要情報の公開 Advanced Supply Demandの可能性を最大化するには、 https://www.mql5.com/ja/blogs/post/720245 にアクセスしてください。   エントリーまたはターゲットの正確なトリガーポイントを正確に特定できれば取引がどのように改善されるか想像してみてください。新しい基盤となるアルゴリズムに基づいて構築されているため、買い手と売り手の間の潜在的な不均衡をさらに簡単に特定できます。これは、最も強い需要と供給のゾーンと、過去のパフォーマンス(古いゾーンを表示)がグラフィカルに表現されるためです。これらの機能は、最適
199 USD
The Volume by Price Indicator for MetaTrader 5 features Volume Profile and Market Profile TPO (Time Price Opportunity). Get valuable insights out of currencies, equities and commodities data. Gain an edge trading financial markets. Volume and TPO histogram bar, line and metric charts. TPO letter and block marker charts including split structures. Positioning and styling options to suit the user's needs and context. Volume Profile and Market Profile TPO Point of Control (VPOC and TPOC), Imbalanc
179.95 USD
スイングトレーディング は、トレンドの方向のスイングと可能な反転スイングを検出するように設計された最初のインジケーターです。トレーディングの文献で広く説明されているベースラインスイングトレーディングアプローチを使用します。インディケータは、いくつかの価格と時間のベクトルを調査して、全体的なトレンドの方向を追跡し、市場が売られ過ぎまたは買われ過ぎて修正の準備ができている状況を検出します。 [ インストールガイド | 更新ガイド | トラブルシューティング | よくある質問 | すべての製品 ] むち打ちを起こさずに市場スイングの利益 インジケーターは常にトレンドの方向を表示します 色付きの価格帯は機会のベースラインを表します 色付きのダッシュは、可能な反転スイングを表します この指標は、独自の品質とパフォーマンスを分析します 複数時間枠のダッシュボードを実装します カスタマイズ可能なトレンドおよびスイング期間 電子メール/サウンド/プッシュアラートを実装します インジケータは再描画またはバックペインティングではありません Swing Tradingとは Swing Tradi
175 USD
MetaBands M5
Vahidreza Heidar Gholami
5 (2)
MetaBandsは、強力でユニークなアルゴリズムを使用してチャンネルを描画し、トレンドを検出して、トレーダーに取引の入出ポイントを提供することができます。チャンネル指標に加えて、強力なトレンド指標でもあります。入力パラメータを使用して新しいチャンネルを作成するために、異なるタイプのチャンネルを統合することができます。MetaBandsは、市場のイベントについてユーザーに通知するために、すべてのタイプのアラートを使用します。 特徴 ほとんどのチャンネルアルゴリズムをサポート 強力なトレンド検出アルゴリズム 異なるタイプのチャンネルを統合する能力 マルチタイムフレームおよびマルチカレンシー(シグナルマトリックス) すべてのタイプのアラート機能(サウンド、画面フラッシャー、プッシュ通知、メール、ポップアップ、矢印) 再描画しない トレンド検出 MetaBandsは、チャネル内を振動する青いラインを使用してトレンドを検出します。ラインがチャネルの上部バンドに達すると、下降トレンドの開始を示し、下部バンドに達すると上昇トレンドの開始を示します。青いラインが中心ラインに近づくと、市場はコンソ
129 USD
Stargogs Spike Catcher V3.11 This Indicator is Developed To milk the BOOM and CRASH indices . Send me Message if you need any help with the indicator.  CHECK OUT THE STARGOGS SPIKE CATCHER EA/ROBOT V3: CLICK HERE ALSO CHECK OUT SECOND TO NONEFX SPIKE CATCHER:   CLICK HERE STARGOGS SPIKE CATCHER V3.11 WHATS NEW! Brand New Strategy. This is the Indicator you need for 2023. The Indicator Gives you an Entry at a time when conditions are met and you should use TP & SL. New Trendline that changes col
100 USD
TPA True Price Action indicator reveals the true price action of the market makers through 100% non-repainting signals strictly at the close of a candle! TPA shows entries and re-entries, every time the bulls are definitely stronger than the bears and vice versa. Not to confuse with red/green candles. The shift of power gets confirmed at the earliest stage and is ONE exit strategy of several. There are available now two free parts of the TPA User Guide for our customers. The first "The Basics"
168 USD
Market Profile defines a number of day types that can help the trader to determine market behaviour. A key feature is the Value Area, representing the range of price action where 70% of trading took place. Understanding the Value Area can give traders valuable insight into market direction and establish the higher odds trade. It is an excellent addition to any system you may be using. Blahtech Limited presents their Market Profile indicator for the MetaTrader community. Inspired by Jim Dalton’s
99 USD
Royal Wave Pro M5
Vahidreza Heidar Gholami
3.67 (3)
Royal Wave is a Trend-Power oscillator which has been programmed to locate and signal low-risk entry and exit zones. Its core algorithm statistically analyzes the market and generates trading signals for overbought, oversold and low volatile areas. By using a well-designed alerting system, this indicator makes it easier to make proper decisions regarding where to enter and where to exit trades. Features Trend-Power Algorithm Low risk Entry Zones and Exit Zones Predictions for Overbought and Over
129 USD
Traders know that paying attention to volume can make the crucial difference in understanding how the market will move. Information such as the traded volume, frequency of executed trades and the correlation of buyers and sellers at a certain time period expand our understanding of volume and can significantly improve the accuracy of our trading forecast. The Volume at Price (or VAP) indicator displays the cumulative traded volume for each price level during a time period, as well as the corr
180 USD
ACB Breakout Arrows MT5
KEENBASE SOFTWARE SOLUTIONS
5 (1)
The ACB Breakout Arrows indicator provides a crucial entry signal in the market by detecting a special breakout pattern. The indicator constantly scans the chart for a settling momentum in one direction and provide the accurate entry signal right before the major move. Get multi-symbol and multi-timeframe scanner from here - Scanner for ACB Breakout Arrows MT 5 Key features Stoploss   and Take Profit levels are provided by the indicator. Comes with a MTF Scanner dashboard which tracks the br
145 USD
After working during many months, with the help of Neural Networks, we have perfected the ultimate tool you are going to need for identifying key price levels (Supports and Resistances) and Supply and Demand zones. Perfectly suitable to trigger your trades, set up your future actions, decide your Take Profit and Stop Loss levels, and confirm the market direction. Price will always move between those levels, bouncing or breaking; from one zone to another, all the remaining movements are just mark
79 USD
XQ Indicator MT5
Marzena Maria Szmit
5 (1)
The signal conditions are a combination of three indicators, and XQ Forex Indicators only display  medium and long-term trends . The indicator's efficacy has been improved with the addition of a filter that blocks out false signals. The XQ Forex Indicator can be used on  FX pairs, CFDs, and Cryptocurrencies . There are two type of signals:  Buy or Sell and Big Long or Big Short It is possible to enable sending emails when a major trend-change signal is detected, as well as to display the alerts
179 USD
The Traders Dynamic Index is a combination of multiple indicators into a complex array of signals that can be interpreted for market behavior.  It combines the RSI, Bollinger Bands and a Moving Average , first developed by Dean Malone it has seen prominent use as it combines an often used strategy into a single indicator.  The RSI will determine an overbought or oversold phase for the instrument that will be smoothed and filtered by the MA the Bollinger Bands will then assess the amplitude a
150 USD
初心者やエキスパートトレーダーに最適なソリューション! このインジケータは、独自の機能と秘密の数式を組み込んだ、ユニークで高品質かつ手頃な価格のトレーディングツールです。たった1枚のチャートで28の通貨ペアのアラートを表示します。新しいトレンドやスキャルピングチャンスの引き金となるポイントを正確に把握することができるので、あなたのトレードがどのように改善されるか想像してみてください! 新しい基本的なアルゴリズムに基づいて構築されているため、潜在的な取引の特定と確認がより簡単になります。これは、通貨の強さや弱さが加速しているかどうかをグラフィカルに表示し、その加速のスピードを測定するためです。加速すると物事は明らかに速く進みますが、これはFX市場でも同じです。つまり、反対方向に加速している通貨をペアにすれば、利益を生む可能性のある取引を特定することができるのです。 通貨の勢いを示す縦の線と矢印は、あなたの取引の指針となるでしょう。 ダイナミックマーケットフィボナッチ23レベルはアラートトリガーとして使用され、市場の動きに適応します。もしインパルスが黄色のトリガーラインに当た
128 USD
Sam TrendBlaster for MT5
AKILA THILINDA JAYARATHNA RANASINGHEGE
3.5 (2)
***** This is an indicator for MT5 providing accurate arrow signals without repainting. ***** Trade With Sam Simple Strategy Guide :  https://www.mql5.com/en/blogs/post/740855 MT4 version of the indicator Try Out and see the Difference The Sam's Trend Blaster indicator tracks the market trend with an unmatched reliability, by ignoring sudden fluctuations and market noise. It has been designed to trend-trade intraday charts and small timeframes. Its winning ratio is around 85%. This is a
144 USD
常に利益を出し続ける5つ星FXトレーダーになりたいですか? 1.私 たちのシンプルな取引 システムの 基本的な説明 と、2020年の主要な戦略のアップデートを お読み ください。 2. 購入時のスクリーンショットを送信すると、専用トレーディングチャットへご招待します。 FXパワー は、すべての時間軸で完全な履歴を持つ初の通貨強度メーターです。 すべての主要通貨の勢いと強さを分析し、高確率のトレードを決定します。 主な機能 主要通貨の完全な強さの履歴 すべての時間軸における通貨の強さの履歴 すべてのブローカー、チャートで同一の計算結果 100%信頼できるリアルタイム計算 -> リペイントなし ドロップダウン・リストで期間を選択可能 1つのチャートに複数のインスタンスを表示可能 FX Powerの表示をドラッグ&ドロップで移動可能 高解像度のQHD、UHD、4Kディスプレイにも対応 端末設定の自動化 タブレットやタッチスクリーンでの使用に最適化 メール、メッセージ、モバイル通知によるアラート機能 EAリクエストのためのアクセス可能なバッファ FX Powerで取引するには?
66 USD
Royal Scalping Indicator is an advanced price adaptive indicator designed to generate high-quality trading signals. Built-in multi-timeframe and multi-currency capabilities make it even more powerful to have configurations based on different symbols and timeframes. This indicator is perfect for scalp trades as well as swing trades. Royal Scalping is not just an indicator, but a trading strategy itself. Features Price Adaptive Trend Detector Algorithm Multi-Timeframe and Multi-Currency Trend Low
149 USD
AI Forecast MT5
Leonardo Antonio Camacaro Armas
The "AI Forecast" indicator is the result of a unique experiment in which I asked an AI how to create the best indicator to anticipate the market. The AI suggested measuring the past history of the price and its reactions to different levels, and then calculating the probabilities of the price reaction in the future. With this idea, I designed with the help of another AI the "AI Forecast" indicator, which adapts to any MetaTrader chart and shows you three lines: one for entry and two for poss
150 USD
トレンドトレーディング は、タイミングのプルバックとブレイクアウトにより、市場で起こっているトレンドから可能な限り利益を得るように設計された指標です。確立されたトレンドの中で価格が何をしているかを分析することにより、取引の機会を見つけます。 [ インストールガイド | 更新ガイド | トラブルシューティング | よくある質問 | すべての製品 ] 自信を持って効率的に金融市場を取引する むち打ちにならずに確立されたトレンドから利益を得る 収益性の高いプルバック、ブレイクアウト、早期の逆転を認識する この指標は、独自の品質とパフォーマンスを分析します 複数時間枠のダッシュボードを実装します インジケーターは再描画されていません 電子メール/音声/視覚アラートを実装します 確立されたトレンドは多くの取引機会を提供しますが、ほとんどのトレンド指標はそれらを完全に無視しています。インジケーターの解釈はかなり簡単です: (1) トレンドの変化 (2) トレンドの方向への後退 (3) トレンドの方向へのブレイクアウト 赤いダッシュ は下降トレンド中の修正です 青いダッシュ は上昇ト
175 USD
This dashboard shows the latest available  Harmonic Patterns  for selected symbols. Free Indicator :   Basic Harmonic Pattern MT4 Version Columns Symbol Trend   (Bullish/ Bearish) Pattern   Type (Gartley/ Butterfly/ Bat/ Crab) Entry  (Entry Price) SL   (Stop Loss Price) TP1   (1st Take Profit Price) TP2  (2nd Take Profit Price) TP3  (3rd Take Profit Price) Current   (Current Price) Age   (Age of pattern in Bars) Alert Settings   (Set an alert if a new pattern is found) You can sort the dashboa
99 USD
The Price Action Finder Multi indicator is a multi-currency and multi-timeframe indicator. It searches for patterns of the Price Action system on all standard time frames at once and on a large (up to 60) number of instruments (currencies, stocks, metals, etc.). The resulting patterns are placed by the indicator in a table at the bottom of the screen. Patterns: At the moment, the indicator contains the following patterns: Outside bar , Inside bar , Pin bar , Force bar , PPR , as well as the In
149 USD
BTFX Daybreak
Bradley Thomas Farrington
5 (1)
Best Trades Fxによって作成された夜明けインジケーターは、ロンドン市場のオープン中にブレイクアウトに気付くようにゾーンをマークします。   ゾーンは標準でGMT + 2に設定されています。これをプラットフォームで有効にするには、ブローカーサーバーに応じて、午前12時GMTと一致する開始時間と午前7時GMTと一致する終了時間を選択する必要があります。   このインジケーターは、すべてのシンボルで使用できます。   このインジケーターの詳細については、Youtubeのビデオをご覧ください。   これとBTFXピボットポイントインジケーターは完璧に機能します。   サポートゾーンとレジスタンスゾーンがチャートに自動的にプロットされるため、分析を行う必要がないためです。   指標に関するご質問は、メールまたは電話でお問い合わせください。   support@besttradesfx.co.uk   01827 842 418   www.besttradesfx.co.uk
66 USD
Renko is a well-known Japanese charting technique that removes time from the chart. Instead of drawing bars in constant intervals (time) as a normal chart would, a Renko chart does so only when price moves beyond a predefined amount. In a Renko chart, a bar is created when price exceeds the previous bar’s high or low by a predefined amount or what we call the Box Size. The result is a chart with equally sized bars running up or down in 45 degree angles. Such a chart offers the following advant
97 USD
iVISTscalp5インジケーターをご紹介します。このインジケーターは、トレーディングにおいて独自でありながら効果的です。時間データに基づくこのインジケーターは、多年にわたる経験と金融市場の深い分析の結果です。iVISTscalp5インジケーターは、手動トレーディングにとって優れたツールです。便利さ、簡単さ、可視化 - すべての複雑さが内部に隠されています。私たちは、iVISTscalp5インジケーターの設定と使用を最大限に簡素化しました。このインジケーターは、MT5ターミナルにあるすべての金融商品に適しています。 稼働時間は、4時から20時(UTC+3)です。 iVISTscalp5インジケーターメニュー(スクリーンショット1を参照): History - 引用を計算する週数 dT_min - 時間間隔の選択(分) TFline - 水平ボリュームの作成(時間枠) BARSline - 水平ボリュームの作成(バー数) TFtrend1 - デイリーチャンネルの作成(時間枠) BARStrend1 - デイリーチャンネルの作成(バー数) TFtrend2 - 週次チャンネルの作成(時
500 USD
ToolBox 360 is the swiss knife of all indicators. It is full packed with useful tools to help you with your trading. It can be used to find best entry and exit points and help you to decide if you should open a trade or not. It shows market trends, candlestick formations outside / inside bars and you can sett time based allerts. Main features: Time based Fibonacci lines Choose a start and end time and the indicator shows you Fibonacci lines within the selected time range including range high
399 USD
作者のその他のプロダクト
Italo Volume Indicator
Italo Santana Gomes
4.95 (75)
BUY INDICATOR AND GET EA FOR FREE AS A BONUS + SOME OTHER GIFTS! ITALO VOLUME INDICATOR  is the best volume indicator ever created, and why is that? The Indicator works on all time-frames and assets, indicator built after 6 years of experience on forex and many other markets. You know many volume indicators around the internet are not complete, does not help, and it's difficult to trade, but the Italo Volume Indicator is different , the Italo Volume Indicator shows the wave volume, when market
65 USD
Italo Trend Indicator
Italo Santana Gomes
4.76 (29)
BUY INDICATOR AND GET EA FOR FREE AS A BONUS + SOME OTHER GIFTS! ITALO TREND INDICATOR  is the best trend indicator on the market, the Indicator works on all time-frames and assets, indicator built after 6 years of experience on forex and many other markets. You know many trend indicators around the internet are not complete, does not help, and it's difficult to trade, but the Italo Trend Indicator is different , the Italo Trend Indicator shows the signal to buy or sell, to confirm the signal t
65 USD
BUY INDICATOR AND GET A PIVOT POINT EA FOR FREE AS A BONUS + SOME OTHER GIFTS! ITALO PIVOTS INDICATOR  is the best pivot point indicator for  strong   price   reversals and continuations of price movements  ever created , and why is that? You will have for the first time inside a pivot point indicator the pivots above the monthly, so, you will have the 3-month pivot lines, 6 months, 1 year, 2 years, 3 years, 5 years and 10 years. Not only that but for the first time you will be able to put ever
65 USD
BUY INDICATOR AND GET EA FOR FREE AS A BONUS + SOME OTHER GIFTS! ITALO TREND INDICATOR  is the best trend indicator on the market, the Indicator works on all time-frames and assets, indicator built after 6 years of experience on forex and many other markets. You know many trend indicators around the internet are not complete, does not help, and it's difficult to trade, but the Italo Trend Indicator is different , the Italo Trend Indicator shows the signal to buy or sell, to confirm the signal t
65 USD
BUY INDICATOR AND GET A PIVOT POINT EA FOR FREE AS A BONUS + SOME OTHER GIFTS! ITALO PIVOTS INDICATOR  is the best pivot point indicator for  strong price   reversals and continuations of price movements  ever created, and why is that? You will have for the first time inside a pivot point indicator the pivots above the monthly, so, you will have the 3-month pivot lines, 6 months, 1 year, 2 years, 3 years, 5 years and 10 years. Not only that but for the first time you will be able to put every s
65 USD
フィルタ:
fdepina
65
fdepina 2023.05.05 23:17 
 

Uma ferramenta excelente e impressionante. Comprei ontem e testei de cara em M1 em conformidade com trendlines de 200 velas, RSI multitimeframe mostrando o RSI de 15 e 30min, uma HMA de 100 períodos como indicador de suporte e resistência dentro do canal de 500 velas, ficou um absurdo! Acho que alcancei o nirvana dos setups! Vou comprar depois o de tendência só para ter o super combo. Melhor indicador de volume que já vi e isso não é exagero. Excelente trabalho do Ítalo.Podem investir sem medo, a configuração padrão atende perfeitamente e se foi tão bom em M1 cuja oscilação é grande, em períodos maiores não precisa de conformidade, basta seguir os mostradores dentro do próprio indicador.

Italo Santana Gomes
7580
開発者からの返信 Italo Santana Gomes 2023.05.06 11:39
Olá, fico feliz com o feedback e com a descrição detalhada que você fez, vai ajudar muitas pessoas a montarem um sistema de trade que funciona. Também fico feliz que o indicador está te ajudando a ter ainda mais probabilidade no mercado, e obrigado por confiar no meu trabalho, minha intenção com os indicadores que lanço é justamente oferecer as melhores ferramentas para os traders terem vantagem no trade. Se tiver alguma dúvida, novidade ou sugestão me envie mensagem no privado, obrigado.
Sergio Ricardo Hiratsuka
130
Sergio Ricardo Hiratsuka 2023.04.26 13:26 
 

Comprei o indicador Italovolume e recomendo muito. ainda estou adaptando na minha estrategia ,eh um otimo norte nas tomadas de decisoes e com uma acertividade muito boa ,dificil de encontrar algo assim e que nw repinta no universo dos indicadores .Suporte super rapido tbm !!!!

Italo Santana Gomes
7580
開発者からの返信 Italo Santana Gomes 2023.04.26 13:34
Obrigado pelo feedback e pela confiança em meu trabalho, e fico feliz que esteja gostando do indicador, no que eu puder ajudar é só me chamar no privado.
Jerry Clarence
23
Jerry Clarence 2023.04.14 09:33 
 

This indicator has been a flop. I am using the default setting and receive no crossings of the 1.50 line. Other traders in my group are able to use your indicator as a great confluence with the trading system we are using. What could I possibly be doing wrong? I am using the indicator with MT5.

Italo Santana Gomes
7580
開発者からの返信 Italo Santana Gomes 2023.04.14 11:08
Hi Jerry, Like you said, "other traders in my group are able to use your indicator as a great confluence ", so, the indicator works, if you are not getting the crossing above the 1.5 line is because your current asset and timeframe are not showing any trends, so, you can change the timeframe or the asset and you will see the crossings above the 1.5 line. Check your private messages, I can help you more there.
T.J.Sch_318798
216
T.J.Sch_318798 2023.04.01 12:52 
 

Super Great Indicator. I'm using it on M1 which works great, helps me to identify when worth to buy or sell, appreciate your trust on my work. I'm happy to have it.

Italo Santana Gomes
7580
開発者からの返信 Italo Santana Gomes 2023.04.01 15:59
I'm happy that you liked the indicator and are having results with it, Best regards.
Stefan Natan
33
Stefan Natan 2023.02.22 16:27 
 

Good indicator. Makes it exceptional on higher timeframes, very profitable.. But still works very good on lower timeframes as well. I rather use it in confluence and confirmation to 5, 15, 30 Minutes as set defaut and almost independent to long term positions to 1 and 4 hour.

Italo Santana Gomes
7580
開発者からの返信 Italo Santana Gomes 2023.02.23 10:52
Hi, thanks for the feedback, I'm happy that you liked the indicator and are having results with it, Best regards.
Mohammad Elyan
79
Mohammad Elyan 2023.02.09 10:59 
 

Most reliable indicator!

Italo Santana Gomes
7580
開発者からの返信 Italo Santana Gomes 2023.02.10 10:16
I'm happy that you liked the indicator, Best regards.
Shugga9888
20
Shugga9888 2023.02.06 09:52 
 

Best indicator so far! Doesn’t lag and it’s pretty accurate. Plus great customer service! Great mind in putting this tool together! 👏🏽👏🏽👍🏽

I’m really curious about these 5 activations? 🤔 what’s that about?

Italo Santana Gomes
7580
開発者からの返信 Italo Santana Gomes 2023.02.06 12:20
Hi, I'm happy that you liked the indicator, thanks for the trust on my work, the 5 activations means that you can download the indicator up to 5 metatrader accounts if you like.
shinkawa
89
shinkawa 2023.01.30 19:43 
 

Hello Italo, I bought the indicator and I like it a lot, I would like to receive the free EA.

Italo Santana Gomes
7580
開発者からの返信 Italo Santana Gomes 2023.02.01 20:11
Hi, thank you for your purchase! Check your private messages
airg
20
airg 2022.12.24 20:16 
 

Excellent indicator!

Italo Santana Gomes
7580
開発者からの返信 Italo Santana Gomes 2022.12.26 12:42
I'm happy that you liked the indicator and its helping you.
DELANTIA MANUEL
113
DELANTIA MANUEL 2022.12.24 00:49 
 

This is an amazing indicator. Really help me get some great entries and also Italo responds quickly to any questions you have.

Italo Santana Gomes
7580
開発者からの返信 Italo Santana Gomes 2022.12.26 12:38
I'm glad to see the indicator is helping you in your trading, Best regards
maghas83
223
maghas83 2022.12.13 19:50 
 

ユーザーは評価に対して何もコメントを残しませんでした

Italo Santana Gomes
7580
開発者からの返信 Italo Santana Gomes 2022.12.15 23:42
Hi, nothing here is fake, you can send message to all those people who comented here and you will see that they are using the indicator and having results. There are not even 2 days since you purchased and are already saying such accusations and calling me names, so clearly you did not use the indicator enough to make such an unreasonable review, or are you just a troll trying to get attention? Either way, I hope you the best.
yoshiyuki shoji
258
yoshiyuki shoji 2022.12.12 10:39 
 

good indicator

Italo Santana Gomes
7580
開発者からの返信 Italo Santana Gomes 2022.12.12 12:32
Thanks!
wealthyjapan
34
wealthyjapan 2022.12.11 01:31 
 

Great product plus great customer service ! Thank you Mr. italo

Italo Santana Gomes
7580
開発者からの返信 Italo Santana Gomes 2022.12.12 12:33
I'm happy that you liked the indicator, thank you
RKE
625
RKE 2022.12.09 21:17 
 

ユーザーは評価に対して何もコメントを残しませんでした

Italo Santana Gomes
7580
開発者からの返信 Italo Santana Gomes 2022.12.12 12:33
I'm happy that you liked the indicator, Best regards.
Thorsten
620
Thorsten 2022.12.01 15:14 
 

Really a great indicator and a great tool to trade trend following. Together with the trend indicator a perfect combination!

Italo Santana Gomes
7580
開発者からの返信 Italo Santana Gomes 2022.12.02 18:37
Hi, I'm happy that the indicator is helping you take good trades, appreciate your trust on my work. Since you mentioned also my trend indicator here is the link for those who want to look at it: https://www.mql5.com/en/market/product/88733
レビューに返信
バージョン 1.5 2022.12.09
Mobile notification update, now you can see the signal time-frame on your phone
バージョン 1.4 2022.11.26
Added the option on inputs to choose which alert you want, Candle Volume Alert, Wave Volume Alert or Both in combination.
バージョン 1.3 2022.11.17
Update 3
バージョン 1.2 2022.11.10
Update 2
バージョン 1.1 2022.11.03
Update 1