History Pattern Search mt5
- インディケータ
- Yevhenii Levchenko
- バージョン: 3.12
- アップデート済み: 5 11月 2022
- アクティベーション: 20
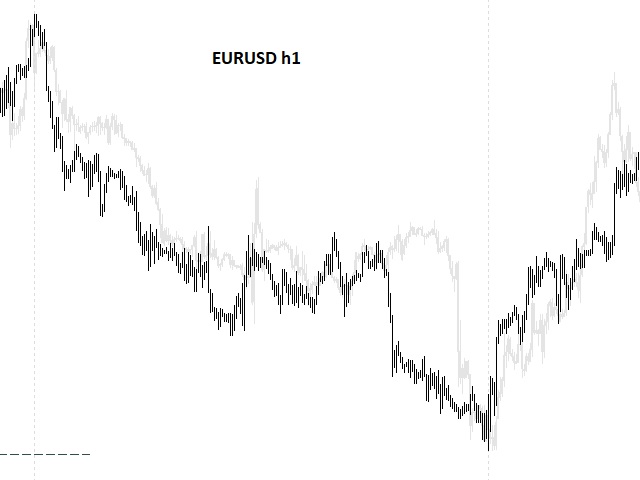
インディケータは現在のクオートを作成し、これを過去のものと比較して、これに基づいて価格変動予測を行います。インジケータには、目的の日付にすばやく移動するためのテキスト フィールドがあります。
オプション:
シンボル - インジケーターが表示するシンボルの選択;
SymbolPeriod - 指標がデータを取る期間の選択;
IndicatorColor - インジケータの色;
HorisontalShift - 指定されたバー数だけインディケータによって描画されたクオートのシフト;
Inverse - true は引用符を逆にします。false - 元のビュー。
ChartVerticalShiftStep - チャートを垂直方向にシフトします (キーボードの上下矢印)。
次は日付を入力できるテキストフィールドの設定で、「Enter」を押すとすぐにジャンプできます。
オプション:
シンボル - インジケーターが表示するシンボルの選択;
SymbolPeriod - 指標がデータを取る期間の選択;
IndicatorColor - インジケータの色;
HorisontalShift - 指定されたバー数だけインディケータによって描画されたクオートのシフト;
Inverse - true は引用符を逆にします。false - 元のビュー。
ChartVerticalShiftStep - チャートを垂直方向にシフトします (キーボードの上下矢印)。
次は日付を入力できるテキストフィールドの設定で、「Enter」を押すとすぐにジャンプできます。