History Pattern Search mt5
- Indikatoren
- Yevhenii Levchenko
- Version: 3.12
- Aktualisiert: 5 November 2022
- Aktivierungen: 20
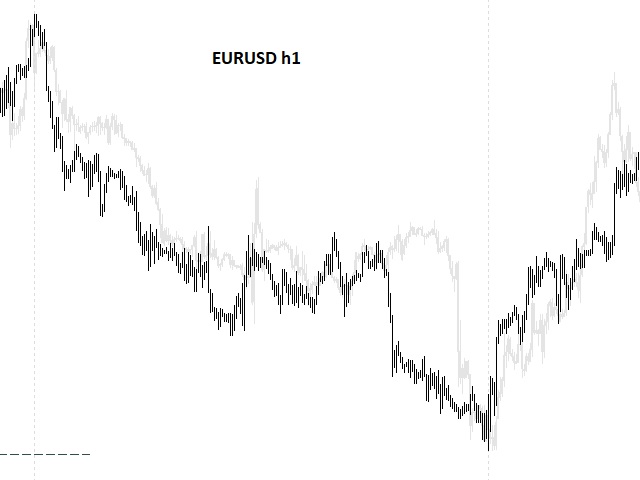
Der Indikator erstellt aktuelle Notierungen, die mit historischen verglichen werden können, und auf dieser Grundlage eine Preisbewegungsprognose erstellen. Der Indikator verfügt über ein Textfeld zur schnellen Navigation zum gewünschten Datum.
Optionen:
Symbol - Auswahl des Symbols, das der Indikator anzeigen soll;
SymbolPeriod - Auswahl des Zeitraums, aus dem der Indikator Daten aufnimmt;
IndicatorColor - Indikatorfarbe;
HorisontalShift - Verschiebung der vom Indikator gezeichneten Kurse um die angegebene Anzahl von Balken;
Inverse - true kehrt Anführungszeichen um, false - ursprüngliche Ansicht;
ChartVerticalShiftStep - Diagramm vertikal verschieben (Pfeil nach oben/unten auf der Tastatur);
Als nächstes folgen die Einstellungen des Textfeldes, in dem Sie das Datum eingeben können, zu dem Sie mit „Enter“ sofort springen können.