Fibonacci Dimension
- インディケータ
- Keni Chetankumar Gajanan -
- バージョン: 2.2
- アップデート済み: 9 2月 2024
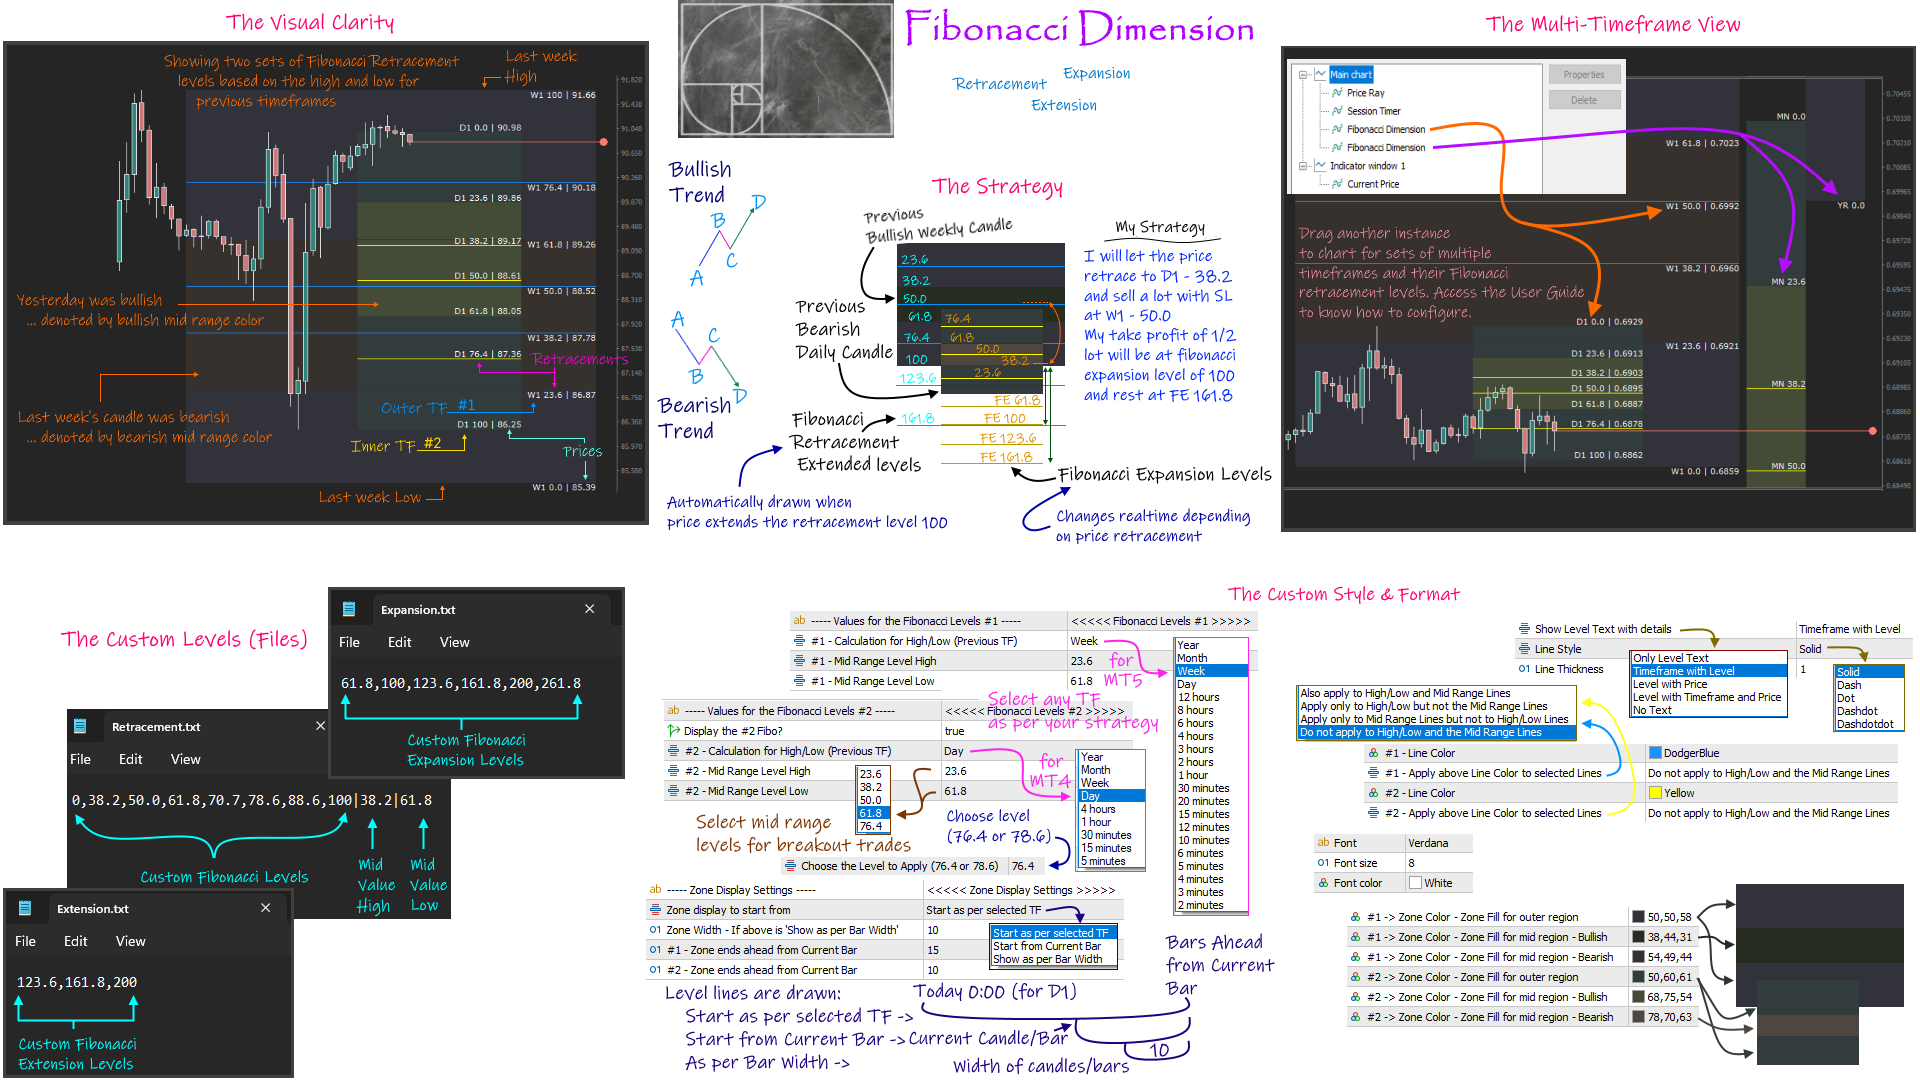
'Fibonacci Dimension' indicator allows display of preset or user-defined multi-timeframe Fibonacci levels. It automatically takes the previous high and low for two user-defined timeframes and calculates their Fibonacci retracement levels. It also considers the retraced level to draw the expansions on every change of price. A complete visual dimension in multiple timeframes allows deriving profitable strategies for execution.
The functionalities included are:
- Provides an option to consider a preset or custom Fibonacci levels for retracement, extension and expansion.
- Displays the calculated multi-timeframe Fibonacci levels as a dimension for visual clarity.
- Includes an option to choose the previous ‘Year’ for selection.
- Handles the Sunday candle and adds to the previous Friday to calculate the Fibonacci levels for Monday (Day - D1).
- Able to define a Fibonacci retracement level as the mid-range to be displayed in a different color. The display of mid-range color considers the previous timeframe candle (bullish or bearish).
- Option to have notification alerts for specified timeframe candle close price, within or outside the mid-range levels.
- Supports multiple instances of the indicator on the chart to display multiple sets of timeframe retracements.
- Allows to toggle the display of extended line till the start of timeframe period.
- Customizable formatting of line, font and colors used by the indicator.
- Option to show timeframe, level text, along with price for each level.
Includes Fibonacci Expansion levels to allow you to strategise your exit of trades. The indicator draws the extended retracement levels in case the price breaks the 100 level.
| Product Links: | User Guide | MT4 version |


Thanks for this wondaful system, can you please make a little update on the Fibonacci number, can you please remove 23.6 from the other numbers. the right numbers I wanted you to update is 0,38.2,50.0,61.8,70.7,78.6,88.6,100.0, etc. Thanks again for your product I am really appreciate.