Multi Timeframe charts
- インディケータ
- Makarii Gubaydullin
- バージョン: 1.1
- アクティベーション: 5
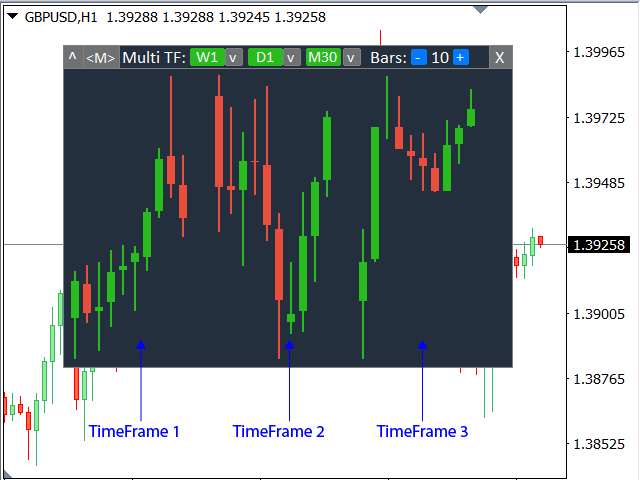
Analyze up to 3 additional charts of other timeframes, without switching the main chart.
My #1 Utility: includes 65+ functions | Contact me if you have any questions
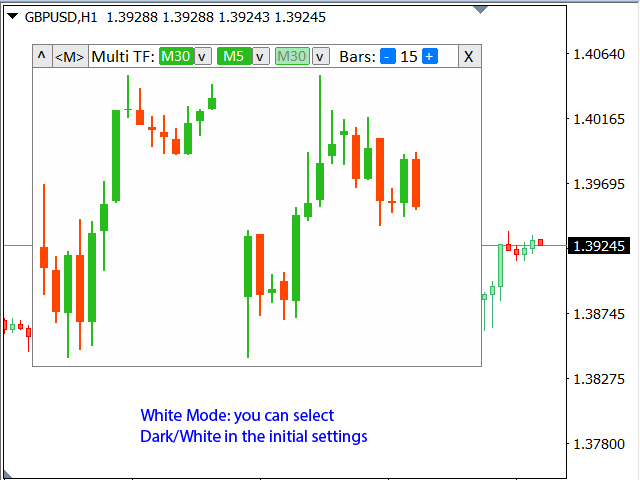
The indicator opens in a separate window:
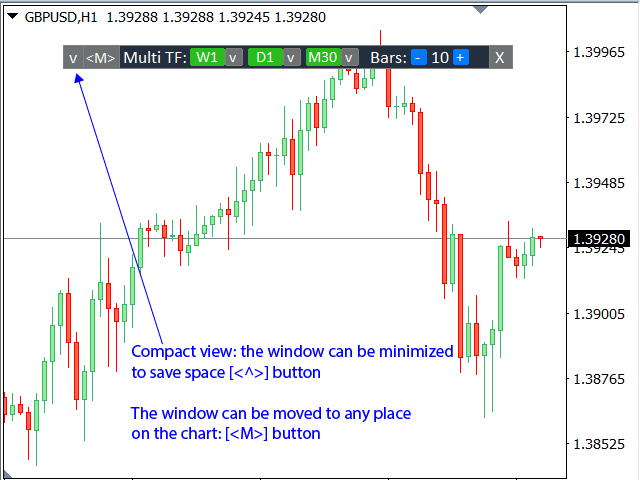
- The window can be moved to any place on the chart (using the [<M>] button).
- The window can also be minimized to save space ([<^>] button)
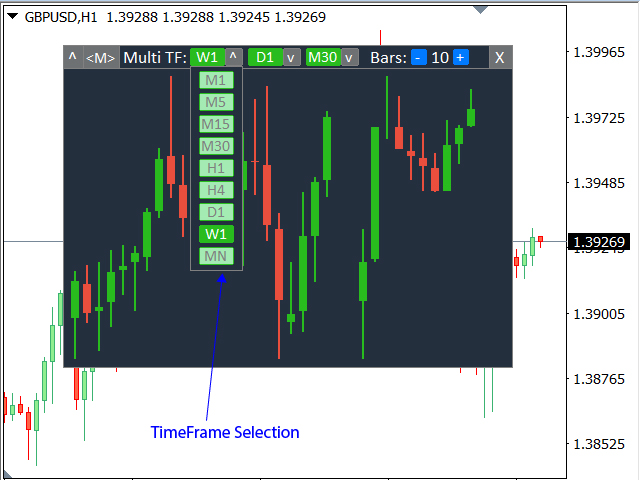
In the window that appears, you can configure:
- The period of the 1st chart (left);
- The period of the 2nd chart (center);
- The period of the 3rd chart (right);
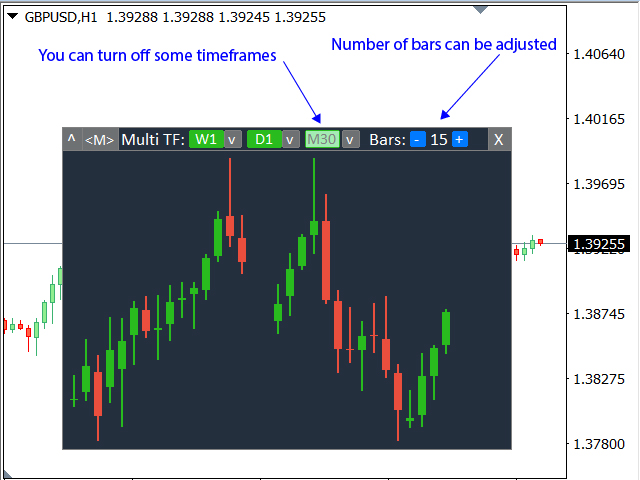
(Each of the timeframes can be disabled); - The number of bars for each timeframe.
Maximum number of bars:
a) With 3 active charts: 30;
b) With 2 active charts: 45;
c) With 1 active chart: 90;