Automated Trendlines MT5
- インディケータ
- Georgios Kalomoiropoulos
- バージョン: 1.0
- アクティベーション: 20
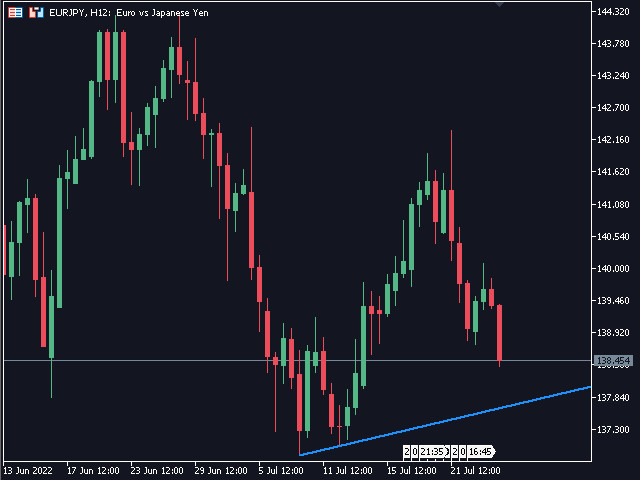
トレンドラインは、外国為替取引におけるテクニカル分析の最も重要なツールです。残念ながら、ほとんどのトレーダーはそれらを正しく描画していません。自動トレンドラインインジケーターは、市場のトレンドの動きを視覚化するのに役立つ本格的なトレーダー向けのプロフェッショナルツールです。
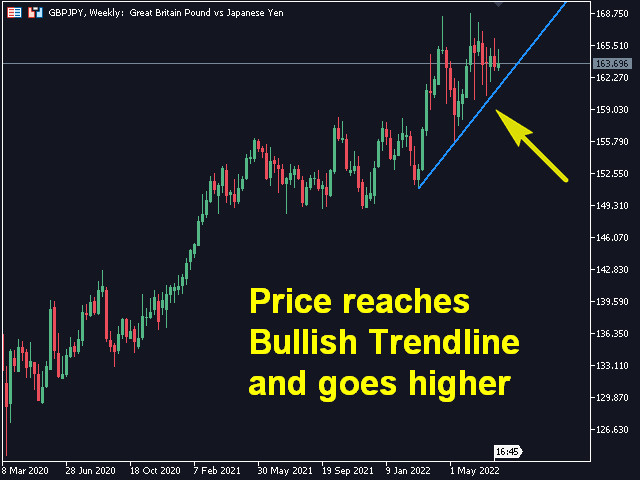
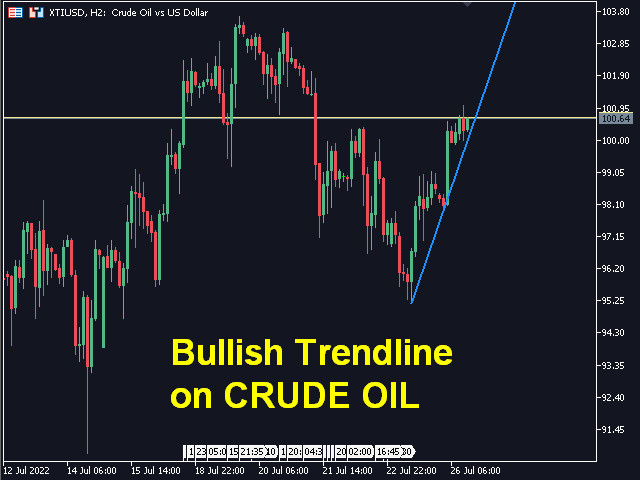
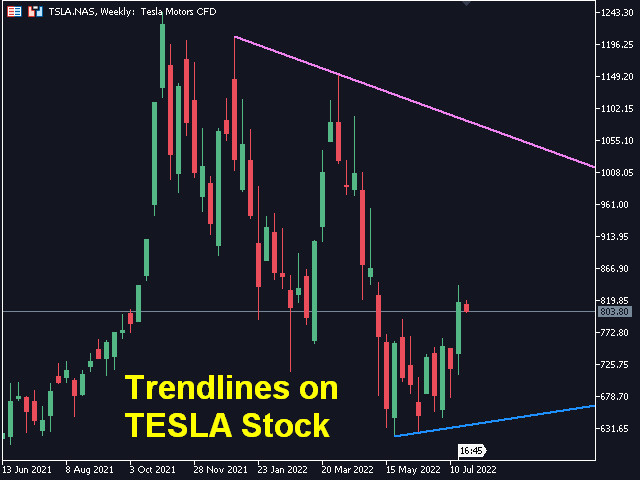
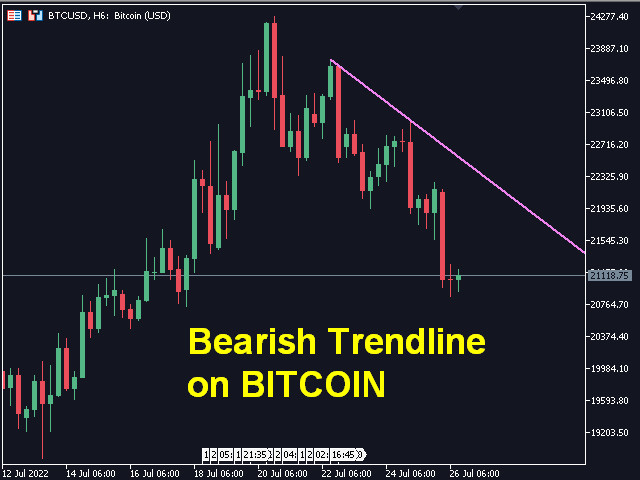
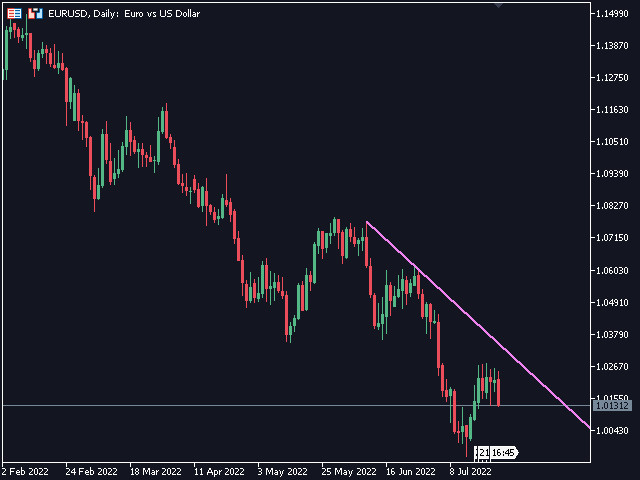
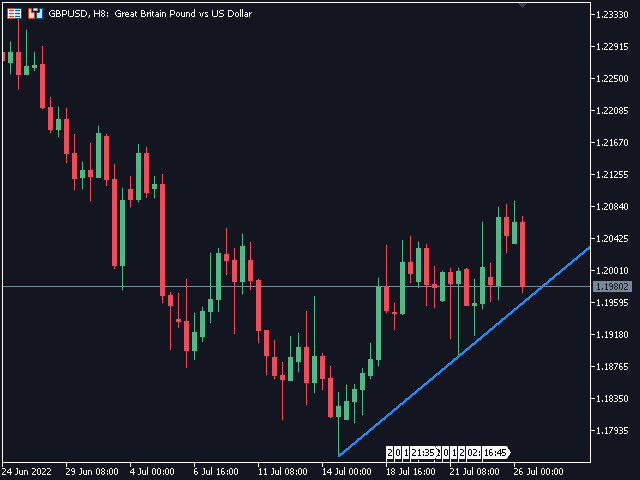
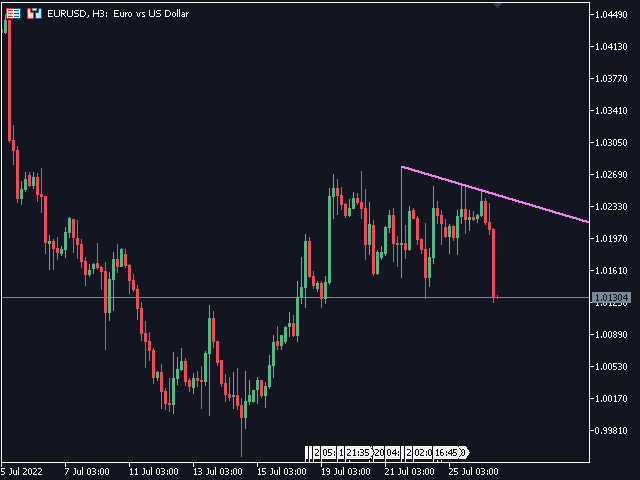
トレンドラインには、強気トレンドラインと弱気トレンドラインの2種類があります。
上昇トレンドでは、外国為替トレンドラインは価格変動の最低スイングポイントを介して描画されます。
少なくとも2つの「最低安値」を接続すると、トレンドラインが作成されます。
下降トレンドでは、トレンドラインは価格変動の最も高いスイングポイントを介して描画されます。
少なくとも2つの「最高値」を接続すると、トレンドラインが作成されます。
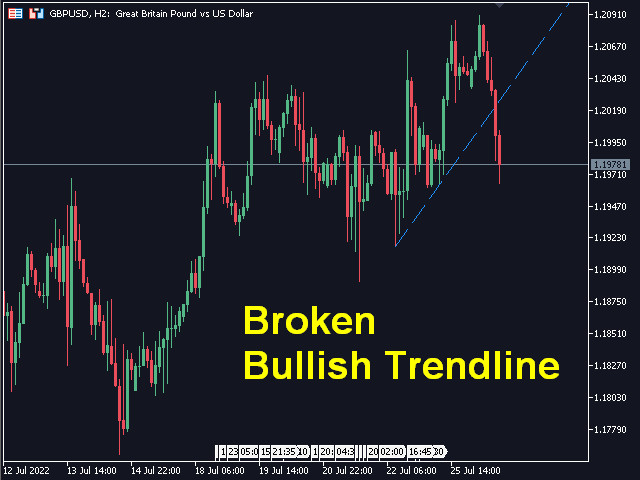
トレンドラインが壊れたとき?
弱気のろうそくが強気のトレンドラインの下で閉じ、ろうそくの高さがトレンドラインの上にあるとき、強気のトレンドラインは壊れます。
強気のろうそくが弱気のトレンドラインの上で閉じ、ろうそくの安値がトレンドラインの下にあるとき、弱気のトレンドラインは壊れます。
トレンドラインが削除されるのはいつですか?
強気トレンドラインの下に完全なろうそくが形成されると、強気トレンドラインは削除されます。
弱気トレンドラインの上に完全なろうそくが形成されると、弱気トレンドラインは削除されます。
入力パラメータから強気と弱気のトレンドラインの色と幅を変更できます。
トレンドラインには、強気トレンドラインと弱気トレンドラインの2種類があります。
上昇トレンドでは、外国為替トレンドラインは価格変動の最低スイングポイントを介して描画されます。
少なくとも2つの「最低安値」を接続すると、トレンドラインが作成されます。
下降トレンドでは、トレンドラインは価格変動の最も高いスイングポイントを介して描画されます。
少なくとも2つの「最高値」を接続すると、トレンドラインが作成されます。
トレンドラインが壊れたとき?
弱気のろうそくが強気のトレンドラインの下で閉じ、ろうそくの高さがトレンドラインの上にあるとき、強気のトレンドラインは壊れます。
強気のろうそくが弱気のトレンドラインの上で閉じ、ろうそくの安値がトレンドラインの下にあるとき、弱気のトレンドラインは壊れます。
トレンドラインが削除されるのはいつですか?
強気トレンドラインの下に完全なろうそくが形成されると、強気トレンドラインは削除されます。
弱気トレンドラインの上に完全なろうそくが形成されると、弱気トレンドラインは削除されます。
入力パラメータから強気と弱気のトレンドラインの色と幅を変更できます。