Automated Trendlines MT5
- 指标
- Georgios Kalomoiropoulos
- 版本: 1.0
- 激活: 20
趋势线是外汇交易中最重要的技术分析工具。不幸的是,大多数交易者没有正确绘制它们。自动趋势线指标是专业交易者的专业工具,可帮助您可视化市场的趋势运动。
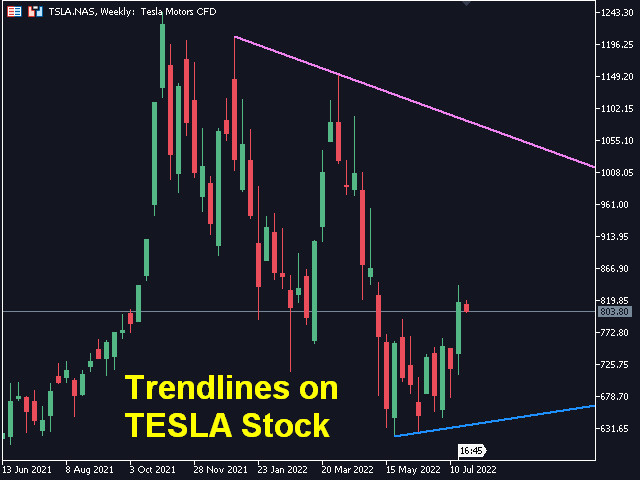
有两种类型的趋势线看涨趋势线和看跌趋势线。
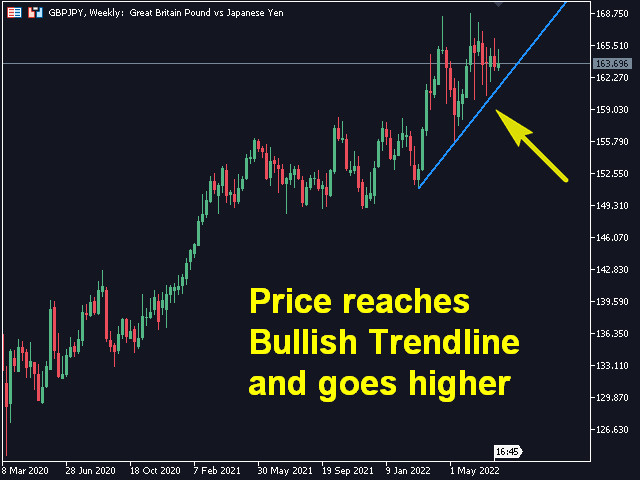
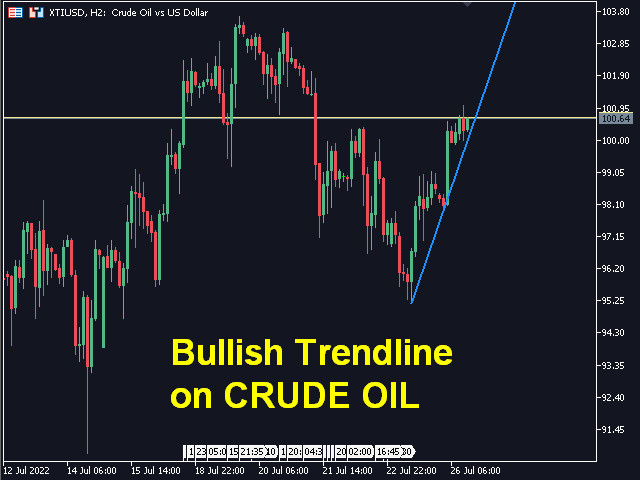
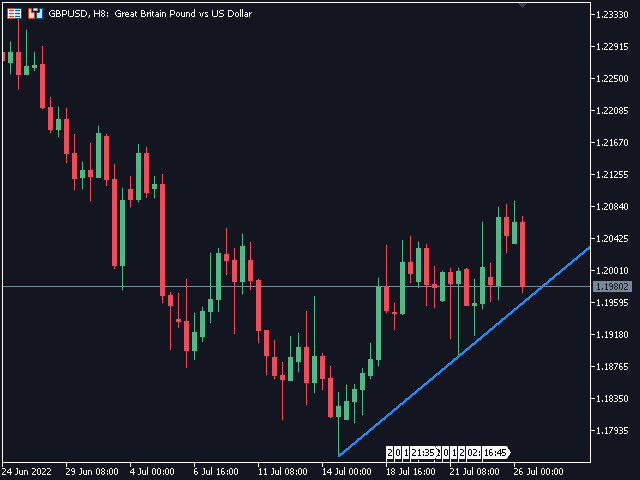
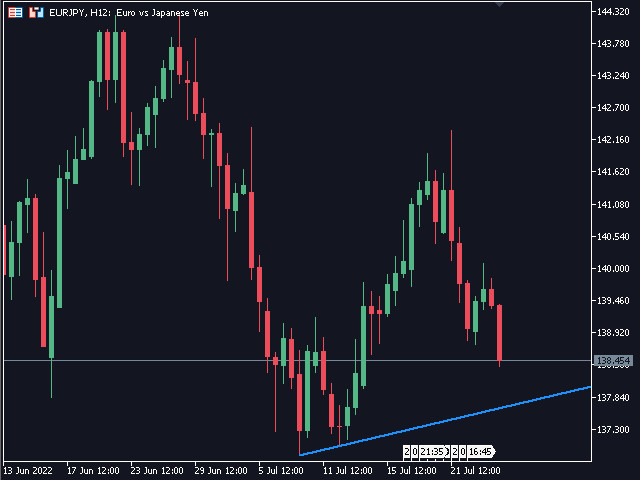
在上升趋势中,外汇趋势线是通过价格变动的最低摆动点绘制的。
连接至少两个“最低点”将创建一条趋势线。
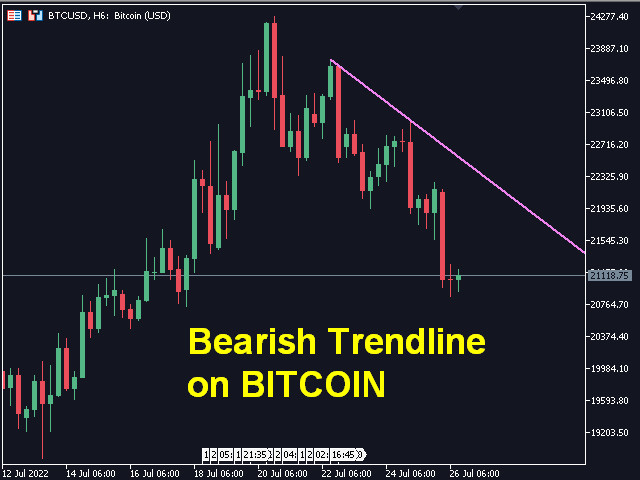
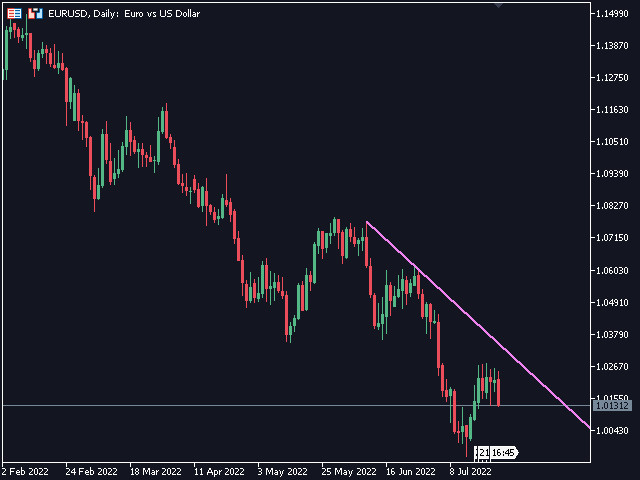
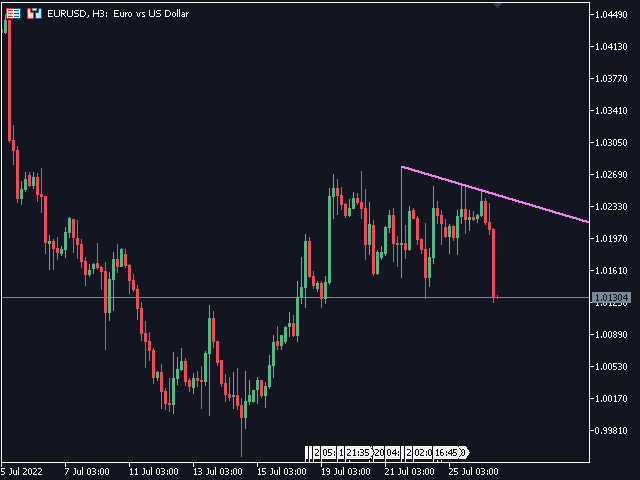
在下跌趋势中,趋势线是通过价格走势的最高摆动点绘制的。
连接至少两个“最高点”将创建一条趋势线。
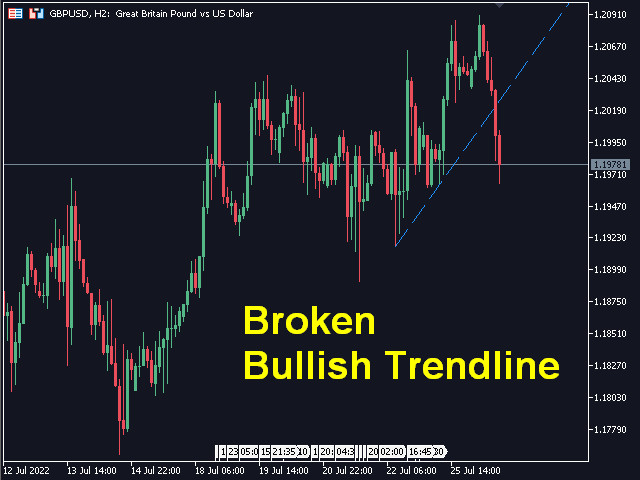
趋势线何时突破?
当看跌蜡烛收于看涨趋势线下方并且蜡烛的高点在趋势线上方时,看涨趋势线会被打破。
当看涨蜡烛收于看跌趋势线上方并且蜡烛的低点低于趋势线时,看跌趋势线会被打破。
趋势线何时删除?
当一根完整的蜡烛在看涨趋势线下方形成时,看涨趋势线将被删除。
当完整的蜡烛在看跌趋势线上方形成时,看跌趋势线将被删除。
您可以从输入参数更改看涨和看跌趋势线的颜色和宽度。
有两种类型的趋势线看涨趋势线和看跌趋势线。
在上升趋势中,外汇趋势线是通过价格变动的最低摆动点绘制的。
连接至少两个“最低点”将创建一条趋势线。
在下跌趋势中,趋势线是通过价格走势的最高摆动点绘制的。
连接至少两个“最高点”将创建一条趋势线。
趋势线何时突破?
当看跌蜡烛收于看涨趋势线下方并且蜡烛的高点在趋势线上方时,看涨趋势线会被打破。
当看涨蜡烛收于看跌趋势线上方并且蜡烛的低点低于趋势线时,看跌趋势线会被打破。
趋势线何时删除?
当一根完整的蜡烛在看涨趋势线下方形成时,看涨趋势线将被删除。
当完整的蜡烛在看跌趋势线上方形成时,看跌趋势线将被删除。
您可以从输入参数更改看涨和看跌趋势线的颜色和宽度。