Buy Sell Signal Low TF
- インディケータ
- Pham Minh Huy
- バージョン: 1.0
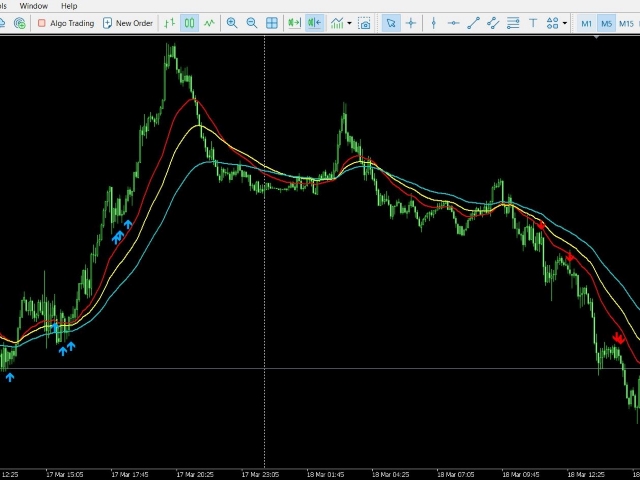
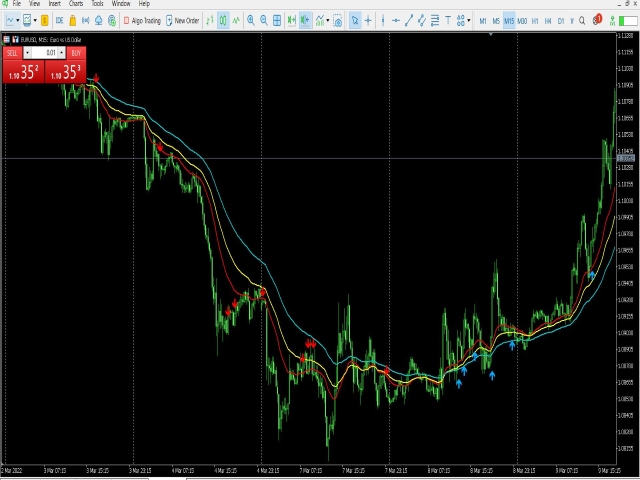
Buy Sell Signal Low TF gives buy/sell signals and alerts with up and down arrow at potential reversal of a pullback or a trend continuation pattern in low timeframe.
This is an indicator which gives signals based on trend => It works best in trend market with the principle is to ride on the trend not trade against the trend.
The components of Buy Sell Signal Low TF:
- The trend is determined by SMMA 13 , SMMA 21 and SMMA 35 (can be changed manually to suit your preference).
- The signal is based on CCI cross 0 line. Default period: 8 (can be changed manually to suit your preference).
- The indicator is designed for using in low timeframe. Therefore, a decent and strict market noise filter is built in.
The indicator gives signal at close of the candle and does not repaint.
Recommend: M5, M15 for scalpers ride on trend.
How to use:
- Turn on the alert function (Email/Push notification/Pop-up alerts).
- When having signal, screening the price action and looks for support/resistance or supply/demand zone or moving average (as dynamic support resistance) to determine whether it is a good pullback setup or not. After that, place a trade.
The purpose of this indicator is to lesser screening time for scalpers.
MT4 version of the indicator can be found here: https://www.mql5.com/en/market/product/79535
It is not for me. I find it gives to many false signals. Maybe it is the setings but I did not change anyting.