• 概要
  • レビュー (34)
  • コメント (178)
  • 最新情報

Auto Orderblock with Break of Structure

4.45

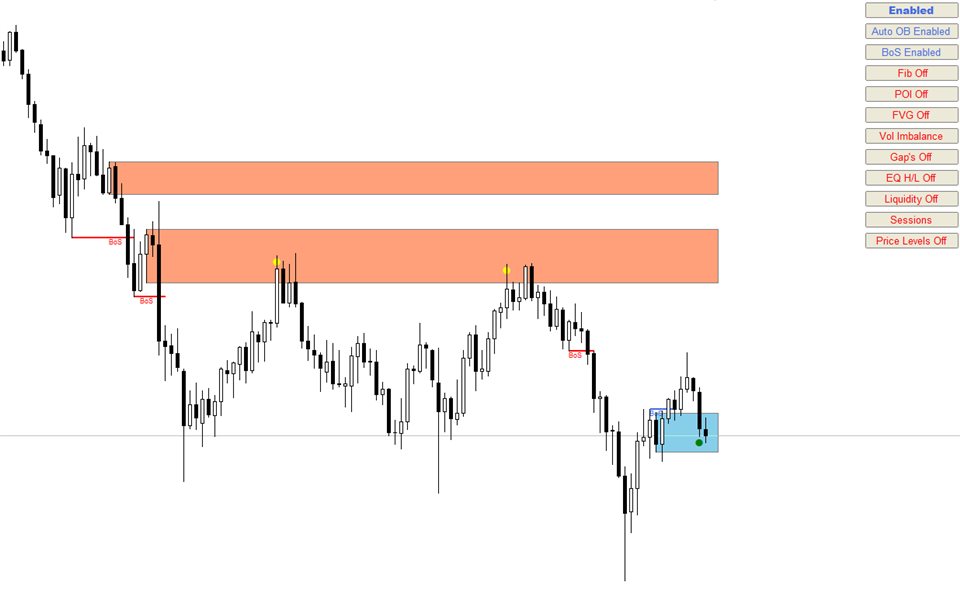
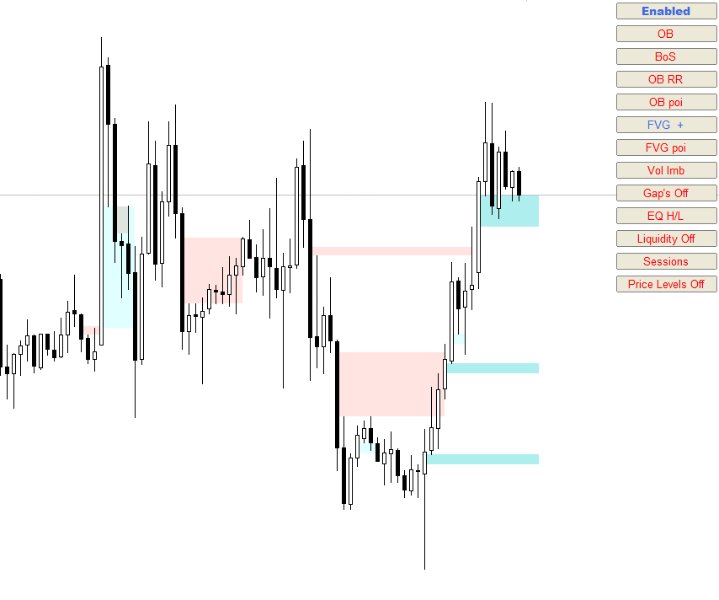
Auto Order Block with break of structure based on ICT and Smart Money Concepts (SMC)

Futures

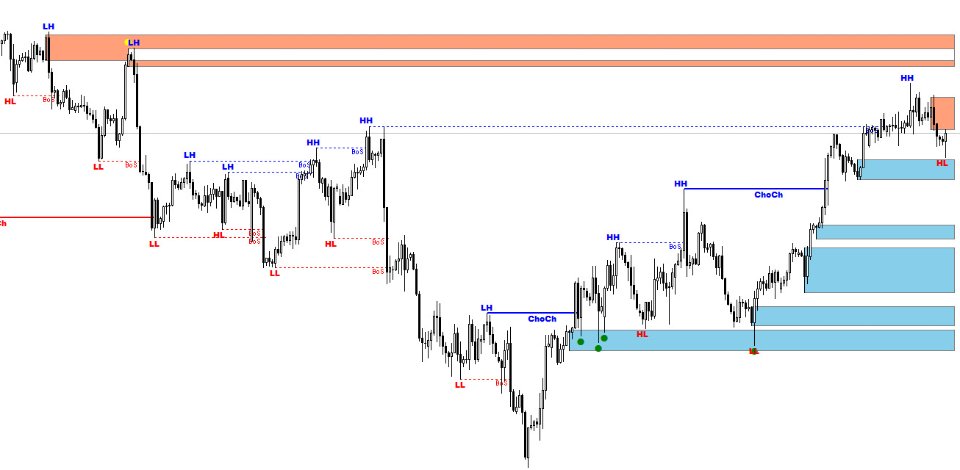
  • Break of Structure ( BoS )           
  • Order block ( OB )          
  • Higher time frame Order block / Point of Interest ( POI )   shown on current chart          
  • Fair value Gap ( FVG ) / Imbalance   -  MTF     ( Multi Time Frame )   
  • HH/LL/HL/LH  -  MTF     ( Multi Time Frame ) 
  • Choch  MTF     ( Multi Time Frame ) 
  • Volume Imbalance    ,  MTF          vIMB
  • Gap’s
  • Power of 3
  • Equal High / Low’s     ,  MTF             EQH / EQL
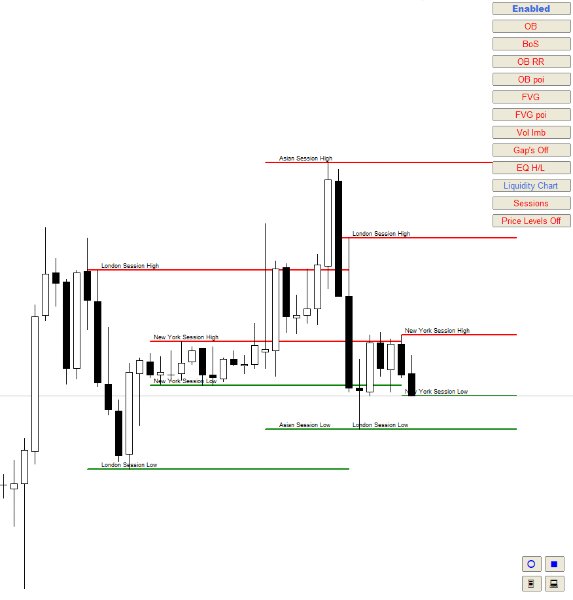
  • Liquidity             
    • Current Day High / Low           HOD / LOD
    • Previous Day High / Low          PDH + PDL
    • Current Week High / Low        HOW / LOW
    • Previous Week High / Low       PWH / PWL
    • Current Month High / Low       HOM / LOM
    • Previous Month High / Low      PMH / PML
    • Previous Day Close                    PDC 
    • Previous Week Close                 PWC 
    • Previous Month Close               PMC
    • Daily Open
    • Weekly Open
  • Premium / Discount - MTF     ( Multi Time Frame ) 
    • Sessions             
      • Asian , London and NY sessions
      • Kill Zone
      • Silver Bullet
    • Alerts
      • BoS Alerts
      • New OB Formed Alerts
      • New High / Low Formed Alerts
      • OB touched Alerts
      • OB  and  POI touch alerts
      • Fair value Gap ( FVG )/ Imbalance touch Alerts
      • Equal High / Low Alerts
      • Liquidity touch Alerts


    Manual Link


    MT5 Version


    Other Indicators 


    レビュー 34
    Komitet
    20
    Komitet 2024.06.24 09:31 
     

    Индикатор супер! Мне нравится!

    lauro1956
    5182
    lauro1956 2024.06.21 10:51 
     

    Really good

    neirss
    30
    neirss 2024.05.27 17:26 
     

    Волшебный индикатор. Разработчику огромная благодарность. Удачи в новых разработках.

    おすすめのプロダクト
    Introduction to Smart Renko The main characteristics of Renko Charting concern price movement. To give you some idea on its working principle, Renko chart is constructed by placing a brick over or below when the price make the movement beyond a predefined range, called brick height. Therefore, naturally one can see clear price movement with less noise than other charting type. Renko charting can provide much clearer trend direction and it helps to identify important support and resistance level
    About  Holy Renko is a trend identifier capable of identify small and long market movements. This indicator should be use in Renko Charts. VIDEO (information and tips) [HERE] How to install Renko Charts [HERE] Features Developed for Renko Charts Easy to analyze Fast signals Not repaint (when candle close)  Statistics panel Filters false signals Alerts, emails and push notifications  Advantages of Renko Chart Easy to install Easy to analyze Filter out the noise of wicks  Easy ide
    Bermaui Channel
    Muhammad Elbermawi
    5 (19)
    This is a price channel that shows five important price levels on the chart. Those levels are: 1. The Highest High (HH) of the previous x bars. 2. The Highest Low (HL) of the previous x bars. 3. The Center Line. 4. The Lowest High (LH) of the previous x bars. 5. The Lowest Low (LL) of the previous x bars. How does Bermaui Channels Captures Overbought  area Think of the distance between HH and HL levels as an overbought area. When the price candles or bars crosses the HL to the upside this
    CyberZingFx Volume
    Afsal Meerankutty
    4.75 (36)
    CyberZingFx Volume Indicator is designed to help traders find market reversals with ease. This powerful tool uses a unique strategy that combines both volume and historical price to provide accurate signals for potential market reversals. The indicator displays volume BUY and SELL power values on the right side of the chart for both BUY and SELL. With customizable settings, you can set alerts at different levels to suit your trading style. The most recent alert value is displayed as Alert High,
    FREE
    This indicator shows the gaps on the current chart with a rectangle shape and indicates when the gap is filled by closing the shape. Gaps are considered over the shadows. Allows sending alerts by e-mail or push notifications when a gap is found. Parameters SizeGAP - Size of the gap that you want to indicate; HGcolor1 - Color of the gap in an upward movement; HGcolor2 - Color of the gap in a downward movement; HGstyle - The style of rectangle to be drawn; StartCalculationFromBar - How many cand
    Identify Take
    Oleksii Ferbei
    4.5 (2)
    Identify Take - trend trading strategy, market noise filtering and all necessary functions built into one tool! The system itself shows in the form of arrows when to buy and when to sell. Uses only one setting parameter. Simple, visual and effective trend detection. The intelligent algorithm of the Identify Take indicator shows the points of a potential market reversal. Most often, a good trend can be seen visually on the price chart. But an experienced trader must clearly understand the curr
    Scalp SWING indicator. It works on any time frame and Instruments It works on trending and ranging markets. The signals are robust and does not repaint. The system is robust and requires no supporting indicator. You don’t need any multiple indicators to trade the markets. The alerts/ notifications can be enabled to gain prompt entries. The entries are at Top and Bottom of Trend Cycles It is Very accurate and robust system- yet extremely simplified tools for the pro traders. Sc
    This is a self-explanatory indicator - do nothing when the current price in the "fence" (flat) mode. Definition of a flat market: A market price that is neither Up nor Down. The input parameter  counted_bars  determines on how many bars the indicator's lines will be visible starting from the current Bar backward. The input parameter  barsNum  is used as a Period for aqua "fence" calculation.
    This indicator Super Neuro Trend indicator.Indicator displays trend movement. Indicator helps to buy and sell. Features FiltPer- displays indicator period. deviation - displaus indicator deviation. Trend - displaus indicator trend.( true,false) Rectangle - displaus indicator rectangle. (true,false)  How to understand the status: If the trend color is green, trend is up. I f the trend color is red, trend is down. I f the trend waiting,trend waiting.     /////////////////////////////////////////
    Projection Trend - a Forex arrow indicator without redrawing does not change its signals when the market situation changes, does not adjust to the chart. The signals given by him are unambiguous. Traders build a trading system that provides good signals 80-90% of the time. The indicator showing the points of entry and exit from the market with arrows is able to bring results not only in the Forex market, but also when working with binary options. You can buy it and install it in MetaTrader yo
    MASi Three Screens is based on the trading strategy by Dr. Alexander Elder. This indicator is a collection of algorithms. Algorithms are based on the analysis of charts of several timeframes. You can apply any of the provided algorithms. List of versions of algorithms:     ThreeScreens v1.0 - A simple implementation, with analysis of the MACD line;     ThreeScreens v1.1 - A simple implementation, with analysis of the MACD histogram;     ThreeScreens v1.2 - Combines the first two algorithms
    FREE
    複数のアセットと複数の時間単位でTrendDECODERシグナルを取得|エントリーする最適な時間単位を決定|利益と勝ちトレードを最大化する 非再塗り、非遅延インジケーターおよびスクリーナー - 手動および自動取引に最適 - すべての資産およびすべての時間単位に対応 $49  最初の50コピーのため - その後 $99 購入後、 コメントを残すかレビューを残してください 、そして99ドル相当の追加インジケーターを送ります。 それは何についてですか? このスクリーナーは、最も評価の高い TrendDECODER の補完ツールです。 これにより、以下のことが可能になります: お気に入りの資産の現在のトレンドアップおよびトレンドダウンのシグナルを、取引に関連するすべての時間枠で取得 利益のためのトレンドフォローやスイングトレードに最適な時間枠の構成を即座に確認 これらの最も有利な時間枠の構成とは? まず、マルチタイムフレームチャートのセットアップを確保します: 下位 / メイン / 上位時間単位 次に、 メイン時間枠が上位時間枠と同じ方向に動く資産 を選択します。 どの
    FREE
    ZhiBiTMGは、すべての市場セグメントとすべてのチャートサイクルに関する傾向とマーチンゲール指標の集まりです。 市場の多くの指標はトレンドに反していますが正確であると主張していますが、それは本当に正確なのでしょうか。実際、それは正確ではありません。市場はトレンドに対応しなければならないからです。 このZhiBiTMG指標は、トレンドの前提としてMartingaleの信号を与えます。これは市場の規則と一致するでしょう。 使用のための指示: 赤い線は下降トレンド線(売り)で、合計3本の線で、デフォルトでは2本の線の注文信号のみがオンになり、パラメータで任意の線の注文信号をオンまたはオフにすることができます。 青い線は上昇傾向線(Buy)、合計3行です;デフォルトでは、2行の注文信号のみがオンになり、パラメータで任意の行の注文信号がオンまたはオフになります。 パラメータの説明 [Arrow_Sell_Down_1]:下降トレンドラインの次の単一信号がオンまたはオフになり、デフォルトはオープン状態です。 [Arrow_Buy_UP_1]:上昇トレンドラインの最初の単一信号がオンまたはオフに
    The expert works on the Fibonacci levels on the previous candle With some digital way to enter the deal On the five minute frame Work on currency pairs only Do not use TakeProfit or Stop Loss How the expert works It is placed on the three currency pairs GBPUSD GBPJPY GBP AUD Same settings without changing anything When he works, he will work on only one currency of them until it closes on a profit Profit is only seven points Please watch the video Explains how the expert works. Max Spread = 0.3
    Features: 1- Get OB/OS Levels from Golden MA Levels 2- Wait for Buy/Sell Start Level Cross 3- Optional: Should price cross Mid Level in earlier bars 4- Optional: Crossing bar High/Medium Volume 5- Optional: MA Stacked to check up/down trend for current TF 6- Optional: NRTR higher timeframes aligned Check Detailed blog post explained: https://www.mql5.com/en/blogs/post/758457 Levels with Buffers available here: Golden MA Levels Indicator: https://www.mql5.com/en/market/product/119515
    FREE
    TMA Channel is a price channel obtained through a special calculation method based on traditional TMA . The channel has upper, middle, and lower tracks . When the price approaches or exceeds the upper track, it is already in an overbought state, and attention should be paid to the situation of reversal and decline; When the price approaches or falls below the lower track, it is already in an oversold state, and attention should be paid to the situation of reversal and rise . The indicator will d
    The indicator displays Renko bars on the chart, uses their data to calculate and display the moving average, PriceChannel and generates buy/sell signals. Renko is a non-trivial price display method. Instead of displaying each bar within a time interval, only the bars where the price moved a certain number of points are shown. Renko bars do not depend on a time interval, therefore the indicator works on any timeframe without losing its efficiency. The PriceChannel indicator displays the upper, lo
    OBTE = Order Block Type I OBTI Indicator MT4 is the most accurate and customizable indicator on the market. It was developed to facilitate the analysis of operations based on candlestick patterns and supply-demand zones. These zones are possible movement reversal points. For this indicator is generated by the order block of smart money concept. Input parameters: 1. Multiple timeframes : M1 M5 M15 M30 H1 H4 D1 W1 MN1 2. Default input: H1 H4 D1 W1 MN1 3. Notifications / Send Emails / Notificatio
    Free automatic Fibonacci is an indicator that automatically plots a Fibonacci retracement based on the number of bars you select on the BarsToScan setting in the indicator. The Fibonacci is automatically updated in real time as new highest and lowest values appears amongst the selected bars. You can select which level values to be displayed in the indicator settings. You can also select the color of the levels thus enabling the trader to be able to attach the indicator several times with differe
    FREE
    VWap Bands EForex
    Veridiana Adorno Kendrick
    VWAP Bands Metatrader 4 Forex Indicator The VWAP Bands Metatrader 4 Forex indicator is a quite similar to the Bollinger bands, but it deploys volume weighted average as the core value of the bands. There is an option of using the tick volume or real volume for calculation when using the VWAP Bands Metatrader 5 custom forex indicator, especially when the forex broker displays symbol alongside real volume. Similarly, you can decide to have deviations calculated with the sample correction or not
    The Before indicator predicts the most likely short-term price movement based on complex mathematical calculations. Most of the standard indicators commonly used in trading strategies are based on fairly simple calculations. This does not mean that there were no outstanding mathematicians in the world at the time of their creation. It is just that computers did not yet exist in those days, or their power was not enough for the sequential implementation of complex mathematical operations. Nowa
    Chaos Trader Lite attempts to use aspects of chaos theory to place trades in the marketplace. This Expert Advisor, in particular, draws upon theories made by Bill Williams. Every version of MetaTrader contains the Bill Williams indicators. I wondered why was he deemed so important as to have his own set of indicators added to MetaTrader with name attribution. Conducting research I found that Bill Williams wrote a book using chaos theory to trade the markets. The Bill Williams indicators are usef
    FREE
    MT4 Product URL: https://www.mql5.com/en/market/product/53225 MT5 Product URL: https://www.mql5.com/en/market/product/53226   Special Offer; If you bought both platform products in same day and date, we will give you 40% money back. Run both terminals on same VPS (Virtual Private Server)   Lot size calculation formula = (Bonus/2) / (Spread/50) / 100   Detail Explanation   If you have 1000USD deposit in each account for bonus hedging and your broker offered you 10% deposit bonus, in this case
    Description: This indicator draw ZigZag Line in multiple time frame also search for Harmonic patterns before completion of the pattern. Features: Five instances of ZigZag indicators can be configured to any desired timeframe and inputs. Draw Harmonic pattern before pattern completion. Display Fibonacci retracement ratios. Configurable Fibonacci retracement ratios. Draw AB=CD based on Fibonacci retracement you define. You can define margin of error allowed in Harmonic or Fibonacci calculatio
    FREE
    Candle GAP
    Thushara Dissanayake
    3 (1)
    ローソク足ギャップ インジケーターは、曜日ごとのローソク足ギャップを自動的に識別するため、 ギャップ取引戦略を 利用するトレーダーにとって不可欠なツールです。ギャップとは、連続する 2 日間の終値と始値の間の価格レベルの差を指します。このインジケーターは、共通、離脱、継続、枯渇の 4 種類のギャップ パターンを認識します。このインジケーターをチャートに組み込むことで、トレーダーはシグナルを検証し、取引の意思決定を強化できます。 ローソク足 GAP インジケーターの重要な特徴の 1 つは、D1 (日次) の下の任意の時間枠および任意のシンボルまたは商品に対して使用できる多用途性です。使いやすいパラメータを提供し、あらゆる経験レベルのトレーダーが利用できるようになります。このインジケーターはチャート上にギャップ パターンを迅速に描画し、迅速な分析と意思決定を可能にします。そのシンプルさにより使いやすさが向上し、簡単で効率的な取引体験が保証されます。 インジケーターのデータ表示パラメーターを使用すると、トレーダーはギャップ情報の外観をカスタマイズできます。ユーザーは、各曜日に関連付けられたテ
    FREE
    レンコ指標(Renko)は、外国為替市場で価格変動やトレンドを視覚化し、市場の「ノイズ」を排除するためのテクニカル分析ツールです。従来のローソク足やバーチャートとは異なり、Renkoは「レンガサイズ」と呼ばれる特定のポイント数の価格変動に基づいて構築されます。価格がこのポイント数だけ動くと、チャートに新しい「レンガ」が追加されます。この指標は時間と出来高を無視し、価格変動にのみ焦点を当てています。Renko指標の主な特徴は次のとおりです: ノイズフィルタリング :Renkoフィルタは小さな価格変動を無視するため、トレーダーが主要なトレンドや反転をよりよく識別するのに役立ちます。 トレンド識別 :レンガの明確な視覚表現により、上昇トレンドと下降トレンドを識別しやすくなります。 エントリーとエグジットシグナル :この指標はトレードシグナルを生成するために使用できます。たとえば、レンガの色の変化は買いや売りのシグナルとして機能します。 適応性 :トレーダーは自分の好みや市場状況に応じてレンガサイズを調整できます。小さいレンガサイズはより詳細な情報を提供しますが、ノイズが多くなる可能性があり、
    The creation of this indicator was inspired by the phrase of the famous trader Michael Covel "Price is the best indicator in the world". Not everyone is able to see the market through the eyes of a professional. Probably an indicator that does not distort the price and visualizes what is happening on the market can help you. Indicator "BE Channel OHLC" has been created for this purpose. The indicator name has not been chosen by chance. The indicator draws a channel using OHLC prices (OPEN, HIGH,
    Everyone has heard that 95% of traders lose money, well join the 5% profitable one with 'The 5 Percent. The 5 Percent Indicator: Join the Elite 5% of Traders. Manage risk and stay in the game by following the trends. Tired of being part of the 95% who lose money? The 5 Percent Indicator is your key to unlocking consistent profitability. This powerful tool provides clear, actionable signals, helping you make informed trading decisions and maximize your returns. Don't miss out on your chance to
    この指標は、突然の変動と市場のノイズを無視することにより、比類のない信頼性で市場動向を追跡します。これは、日中のチャートと小さな時間枠をトレンドトレードするように設計されています。その勝率は約85%です。 [ インストールガイド | 更新ガイド | トラブルシューティング | よくある質問 | すべての製品 ] 驚くほど簡単に取引できます 売られ過ぎ/買われ過ぎの状況を見つける 常にノイズのない取引をお楽しみください 日中チャートでむち打ちされるのを避ける この指標は、独自の品質とパフォーマンスを分析します 複数時間枠のダッシュボードを実装します このインディケータは、低価格帯での取引に適しています。なぜなら、平均価格の周りの市場ノイズを減らすことにより、突然の価格の急上昇や修正を無視するからです。 インディケーターは最適化をまったく必要としません 複数時間枠のダッシュボードを実装します 電子メール/サウンド/プッシュアラートを実装します インジケーターは再描画および非バックペインティングではありません この指標は、より高い時間枠で非常に長い傾向に浸透する可能性のある小さな時間枠に適
    This indicator displays the ZigZag Pointer Fibonacci Expansion Triangle movements timeframes only M1-W1. Parameters InDepth: Displays the Depth movements. InDeviation: Displays the Deviation movements. InBackstep: Displays the Backstep movements. Fibonacci Expansion: Displays the Fibonacci Expansion movements. Fibonacci Expansion true.(false) Triangle: Displays the Triangle movements. Triangle true.(false) How to understand the status: If the Triangle is green, trend is up. If the Triangle is
    このプロダクトを購入した人は以下も購入しています
    Gann Made Easy は、ミスター・ギャンの理論を使用した取引の最良の原則に基づいた、プロフェッショナルで使いやすい外国為替取引システムです。 W・D・ガン。このインジケーターは、ストップロスとテイクプロフィットレベルを含む正確な買いと売りのシグナルを提供します。 PUSH通知を利用して外出先でも取引可能です。 購入後はご連絡ください!私の取引のヒントと素晴らしいボーナスインジケーターを無料で共有します! おそらく、ギャンの取引手法についてはすでに何度も聞いたことがあるでしょう。通常、ギャンの理論は初心者のトレーダーだけでなく、すでにある程度の取引経験がある人にとっても非常に複雑なものです。なぜなら、ギャンの取引手法は理論的にはそれほど簡単に適用できるものではないからです。私はその知識を磨き、最良の原則を私の外国為替インジケーターに組み込むために数年を費やしました。 このインジケーターは非常に簡単に適用できます。必要なのは、それをチャートに添付し、簡単な取引推奨事項に従うだけです。このインジケーターは常に市場分析の仕事を行い、取引の機会を探します。適切なエントリーポイントを検出
    TPSpro TREND PRO は 、市場を自動的に分析し、トレンドとその各変化に関する情報を提供し、再描画せずに取引に参加するためのシグナルを提供するトレンド指標です。 インディケータは各ローソク足を使用し、個別に分析します。さまざまなインパルス(アップまたはダウンインパルス)を指します。通貨、仮想通貨、金属、株、指数の取引への正確なエントリーポイント! バージョンMT5                   インジケーターの完全な説明   インジケーター -   RFI LEVELS と併用することをお勧めします。 主な機能: レンダリングなしで正確な入力信号! シグナルが表示された場合、それは関連性を維持します。これは、シグナルを提供してからそれを変更する可能性があり、入金時の資金の損失につながる可能性があるリドローインジケーターとの重要な違いです。より高い確率と精度で市場に参入できるようになりました。矢印が表示された後、ターゲットに達する (利益確定) か反転シグナルが表示されるまで、ローソク足を色付けする機能もあります。 STOP LOSS / TAKE PROFIT
    $65 for the first 93 /100   copies ( 7  copies left). Next price is $120 !  Send us a message after your purchase to receive more information on how to get your  BONUS  for FREE  that works in great combination with Bull vs Bear ! Bull versus Bear is an easy-to-use Forex indicator that gives traders clear and accurate signals based on clear trend retests . Forget about lagging indicators or staring at charts for hours because  Bull vs Bear provides real-time entries with no lag and no repai
    Golden Trend Indicator
    Noha Mohamed Fathy Younes Badr
    4.71 (7)
    Golden Trend indicator  is The best indicator for predicting trend movement this indicator never lags and never repaints and never back paints    and give  arrow buy and sell    before the candle appear  and it will help you and  will make your trading decisions clearer its work on all currencies and  gold and crypto and all time frame This unique  indicator uses very secret algorithms to catch the  trends, so you can trade using this indicator and see the trend clear on charts  manual guide and
    現在20%OFF! 初心者やエキスパートトレーダーのためのベストソリューション! このダッシュボードソフトウェアは、28の通貨ペアで動作しています。それは私達の主要な指標(高度な通貨の強さ28と高度な通貨インパルス)の2に基づいています。それは全体の外国為替市場の大きい概観を与えます。それは、すべての(9)時間枠で28の外国為替ペアのための高度な通貨の強さの値、通貨の動きの速度と信号を示しています。チャート上で1つのインディケータを使用して市場全体を観察し、トレンドやスキャルピングの機会をピンポイントで見つけることができたら、あなたのトレードがどのように改善されるか想像してみてください。 このインディケータには、強い通貨と弱い通貨の識別、潜在的な取引の識別と確認がより簡単になるような機能が搭載されています。このインディケータは、通貨の強さや弱さが増加しているか減少しているか、また、すべての時間枠でどのように機能しているかをグラフィカルに表示します。 新機能として、現在の市場環境の変化に適応するダイナミックなマーケットフィボナッチレベルが追加され、すでに当社のAdvan
    MetaBands M4
    Vahidreza Heidar Gholami
    5 (3)
    MetaBandsは、強力でユニークなアルゴリズムを使用してチャンネルを描画し、トレンドを検出して、トレーダーに取引の入出ポイントを提供することができます。チャンネル指標に加えて、強力なトレンド指標でもあります。入力パラメータを使用して新しいチャンネルを作成するために、異なるタイプのチャンネルを統合することができます。MetaBandsは、市場のイベントについてユーザーに通知するために、すべてのタイプのアラートを使用します。 特徴 ほとんどのチャンネルアルゴリズムをサポート 強力なトレンド検出アルゴリズム 異なるタイプのチャンネルを統合する能力 マルチタイムフレームおよびマルチカレンシー(シグナルマトリックス) すべてのタイプのアラート機能(サウンド、画面フラッシャー、プッシュ通知、メール、ポップアップ、矢印) 再描画しない トレンド検出 MetaBandsは、チャネル内を振動する青いラインを使用してトレンドを検出します。ラインがチャネルの上部バンドに達すると、下降トレンドの開始を示し、下部バンドに達すると上昇トレンドの開始を示します。青いラインが中心ラインに近づくと、市場はコンソ
    指示する     ロシア     -        utilizar con   el indicador の ESP 推奨事項 -   TPSpro トレンド プロフェッショナル版 -   MT5のバージョン 最も重要なことは、将来においても最も重要なことです。 機能のプリンシパル: ゾーンのほとんどは、ベンダーとコンプラドールによってアクティブ化されます。 状況を直感的に把握できるよう、初期の衝動を修正します。 LOGIC AI: MUESTRA zonas (círculos) parabuscar puntos de entrada cuando se activa una plantilla 視覚的に優れた視覚効果があり、最も重要な機能がすべて揃っていることに注意してください。 優れたニベレス/ゾーンの視覚化 (modo MTF) 世界で最も人気のある場所/ゾーンです。これを使用するのに最適な方法です (   TPSproTREND PRO   )。 アルゴリズム プロフェッショナル セパラド パソ ア パソ パラ オペラ それは、オペラハウスやコントラ・デ・エラの指導におい
    Trend Punch
    Mohamed Hassan
    4.96 (23)
    This indicator is unstoppable when combined with our other indicator called  Support & Resistance . After purchase, send us a message and you will get it   for  FREE as a BONUS! Introducing Trend Punch , the revolutionary forex trend indicator that will transform the way you trade! Trend Punch is uniquely designed to provide precise buy and sell arrows during strong market trends, making your trading decisions clearer and more confident. Whether you're trading major currency pairs or exotic sym
    Dynamic Forex28 Navigator - 次世代の Forex 取引ツール。 現在 49% オフ。 Dynamic Forex28 Navigator は、長年人気のインジケーターを進化させたもので、3 つの機能を 1 つにまとめています。 Advanced Currency Strength28 インジケーター (レビュー 695 件)  + Advanced Currency IMPULSE with ALERT (レビュー 520 件) + CS28 コンボ シグナル (ボーナス)。 インジケーターの詳細 https://www.mql5.com/en/blogs/post/758844 次世代の Strength インジケーターが提供するもの  オリジナルで気に入っていたすべての機能が、新機能と精度の向上によって強化されました。 主な機能: 独自の通貨強度計算式。 すべての時間枠でスムーズかつ正確な強度ライン。 トレンドの特定と正確なエントリーに最適です。 ダイナミックマーケットフィボナッチレベル (マーケットフィボナッチ)。 このインジケー
    現在20%OFF! このダッシュボードは、複数のシンボルと最大9つのタイムフレームで動作するソフトウェアの非常に強力な部分です。 このソフトは、弊社のメインインジケーター(ベストレビュー:Advanced Supply Demand)をベースにしています。    Advanced Supply Demand ダッシュボードは、素晴らしい概要を提供します。それは示しています。  ゾーン強度評価を含むフィルタリングされた需給値。 ゾーン内/ゾーンへのPips距離。 ネストされたゾーンがハイライトされます。 選択されたシンボルの4種類のアラートを全ての(9)時間枠で提供します。 それはあなたの個人的なニーズに合わせて高度に設定可能です。 あなたの利益! すべてのトレーダーにとって最も重要な質問です。 市場に参入するのに最適なレベルはどこか? 成功のチャンスとリスク/リターンを得るために、強力な供給/需要ゾーン内またはその近くで取引を開始します。 損切りの最適な位置はどこですか? 最も安全なのは、強力な供給/需要ゾーンの下/上にストップを置くことで
    購入後にコメントを残すと、高品質なインジケーター4つをボーナスとして受け取れます。 Chart Patterns All-in-One インジケーターは、トレーダーがテクニカル分析で一般的に使用されるさまざまなチャートパターンを視覚化するのに役立ちます。このインジケーターは市場の潜在的な動きを特定するのに役立ちますが、収益性を保証するものではありません。購入前にデモモードでテストすることをお勧めします。 現在のオファー : 「Chart Patterns All in One」インジケーターが50%割引。 含まれるパターン : 1-2-3 パターン : 3つの主要なポイント(高値または安値)を使用して市場の反転を検出します。 買い : 2つの連続する安値の後に、前の高値よりも低い高値が出現。 売り : 2つの連続する高値の後に、前の安値よりも高い安値が出現。 可視化 : 特定されたポイントを線と矢印で接続。 ダブルトップとダブルボトム : 価格がほぼ同じ2つの連続した高値(ダブルトップ)または安値(ダブルボトム)を形成したときに、反転の可能性を示します。 ダブルトップ : ベアリッシュ
    まず第一に、この取引インジケーターは再描画されず、再描画されず、遅延しないことを強調する価値があります。これにより、手動取引とロボット取引の両方に理想的なものになります。 ユーザーマニュアル:設定、入力、戦略。 アトミックアナリストは、価格の強さとモメンタムを利用して市場でより良いエッジを見つけるためのPA価格アクションインジケーターです。ノイズや誤ったシグナルを除去し、取引ポテンシャルを高めるための高度なフィルターを備えています。複雑なインジケーターの複数のレイヤーを使用して、アトミックアナリストはチャートをスキャンし、複雑な数学的計算をシンプルなシグナルと色に変換します。これにより、どのような初心者トレーダーでも理解して使用し、一貫した取引の決定を行うことができます。 「アトミックアナリスト」は、新規および経験豊富なトレーダー向けにカスタマイズされた包括的な取引ソリューションです。プレミアムインジケーターとトップノッチの機能を1つの取引戦略に組み合わせ、すべてのタイプのトレーダーにとって汎用性のある選択肢にします。 デイリートレーディングとスキャルピング戦略:高
    FX Volume
    Daniel Stein
    4.58 (33)
    FXのボリュームで真のエッジを得る:究極の出来高指標 FX Volumeは、インサイダーの視点から真の市場センチメントを明らかにする最初で唯一の出来高指標です。機関投資家やブローカーがどのようなポジションをとっているかについての独自の洞察を提供することで、FX Volumeは、通常大手にのみ許される先見の明をもって取引することを可能にします。COTレポートの遅れとはおさらばです。FX Volumeは、この重要な情報をチャート上で即座に提供し、より迅速でスマートな取引判断を可能にします。 FX Volumeがあなたの取引に不可欠な理由 FX Volumeを使用すると、独自の市場データに比類なくアクセスできるため、一般的な出来高指標では得られない洞察力を得ることができます。チャート上で直接追跡できる内容は以下の通りです: ポジション比率:市場センチメントを明確に把握するために、通貨間のロング・ショート比率をご覧ください。 比率の変化:選択した時間枠におけるロングポジションの変化率を表示します。 総取引量:通貨全体の総取引量(ロングとショート)をリアルタイムで追跡します。 詳細なロン
    Graf Mason
    Alexandr Lapin
    5 (9)
    Graf Mason is a tool that will make you a professional analyst! The method of determining wave movements using inclined channels qualitatively conveys the schematics of the movement of any instrument, showing not only possible reversals in the market, but also the goals of further movements!Destroys the myth that the market is alive , clearly showing the schematics of movements from one range to another! A professional tool, suitable for the medium term with the definition of the current trend!
    究極の通貨強度計「FXパワーNG」の実力をフルに引き出す FX Powerは8年以上にわたり、信頼性の高い正確な通貨強度分析で世界中のトレーダーに力を与えてきました。 そして今、FXパワーNGはこの信頼できるツールを次のレベルに引き上げ、比類のない精度、カスタマイズ性、そして洞察力をあなたの取引にもたらす高度な機能を提供します。 FX Power NGが真剣なトレーダーの必需品である理由とは? FX Power NGは、初代FX Powerでご好評いただいたすべての機能をベースに、重要な追加と改良を加えています: 金強度分析(XAU):通貨ペアとともに金の強さを追跡し、より広範な市場洞察を得ることができます。 洗練された計算:すべての分析において、より正確で信頼性の高い結果が得られます。 カスタマイズ可能な分析期間:日中から長期的な洞察まで、取引戦略に合わせて分析期間を調整できます。 高度なマルチインスタンス設定:複数の時間枠や戦略の分析に最適な、包括的なビューのために複数のインスタンスを実行します。 グラフィックの無制限カスタマイズ:各チャートの色やスタイルを取引環境に合わせ
    FX Dynamic - 必要な唯一のATRインジケーター 比類のない精度と洞察力であなたの取引戦略を強化する準備はできていますか? FX Dynamicは 、 通貨ベースの 分析と ブローカーのGMTシフトの自動調整の ために設計された最初で唯一のATR指標です。時代遅れのツールに別れを告げ、市場のボラティリティをマスターするための究極のソリューションをご利用ください。 FX Dynamicがゲームチェンジャーである理由 通貨ベースのATR分析 - 従来のツールからの脱却。FX Dynamicは、FXペアやコモディティのようなシンボルを超えて、個々の通貨の ボラティリティに関する詳細な洞察を 提供する初のATR指標です。 GMTシフト調整による比類のない精度 - もう手動でタイムゾーンを修正する必要はありません。FX DynamicはブローカーのGMTシフトを自動的に計算 し、市場で最も正確で信頼できる分析を保証します。 オールインワンの汎用性 - 短期スキャルピングから長期投資まで、FX Dynamicはカスタマイズ可能な時間枠と精度設定であなたの取引スタイルに適応します
    Order Block Hunter
    Noha Mohamed Fathy Younes Badr
    5 (9)
    Order block hunter indicator is the best indicator for  hunt the order blocks that area where there has been a large concentration of limit orders waiting to be executed Order blocks are identified on a chart by observing previous price action and looking for areas where the price experienced significant movement or sudden changes in direction .This indicator does that for you by using very complicated codes and helps you to take the best areas To buy and sell because it make marks at the best a
    FXレベルの発見:取引成功のための究極の支持線・抵抗線指標 FX Levelsは単なるサポート&レジスタンス・インディケーターではありません。通貨ペア、株価指数、株式、コモディティなど、あらゆる取引シンボルにおいて、正確性、信頼性、シームレスな機能性を求める真剣なトレーダーにとって、画期的なインジケーターです。実績のあるLighthouseメソッドをベースに、ダイナミックでリアルタイムな適応性を強化したFX Levelsは、市場の反転ポイントをチャート上に表示し、正確な利益目標の設定やトレードエントリーの最適化に最適です。 FX Levelsを選ぶ理由 Stein Investmentsのチームは、ブローカーとその様々なデータフィードに関する長年の経験を活かし、FX Levelsを精度と一貫性において傑出したものにしました。異なるブローカー間でほぼ100%同一のレベルを持つFX Levelsは、他のインジケーターにはない比類ないレベルの信頼性を提供します。FX Levelsの細部へのこだわりは、お客様の期待に応えるだけでなく、サポートとレジスタンス分析へのアプローチ方法を変える
    Please contact me after purchase to immediately get your PDF strategy + documentation for Trend Pulse !  Introducing Trend Pulse , a unique and robust indicator capable of detecting bullish, bearish, and even ranging trends! Trend Pulse uses a special algorithm to filter out market noise with real precision. If the current symbol is moving sideways, Trend Pulse will send you a ranging signal, letting you know that it's not a good time to enter a trade. This excellent system makes Trend Pulse  on
    An exclusive indicator that utilizes an innovative algorithm to swiftly and accurately determine the market trend. The indicator automatically calculates opening, closing, and profit levels, providing detailed trading statistics. With these features, you can choose the most appropriate trading instrument for the current market conditions. Additionally, you can easily integrate your own arrow indicators into Scalper Inside Pro to quickly evaluate their statistics and profitability. Scalper Inside
    Break and Retest
    Mohamed Hassan
    4.21 (19)
    This Indicator only places quality trades when the market is really in your favor with a clear break and retest. Patience is key with this price action strategy! If you want more alert signals per day, you increase the number next to the parameter called: Support & Resistance Sensitivity.  After many months of hard work and dedication, we are extremely proud to present you our  Break and Retest price action indicator created from scratch. One of the most complex indicators that we made with ove
    Advanced Supply Demand
    Bernhard Schweigert
    4.91 (295)
    現在33%オフ 初心者にもエキスパートトレーダーにも最適なソリューション このインジケーターは独自の機能と新しい公式を多数内蔵しており、ユニークで高品質かつ手頃な取引ツールです。このアップデートでは、2つの時間枠ゾーンを表示できるようになります。より長いTFだけでなく、チャートTFとより長いTF(ネストゾーンを表示)の両方を表示できます。すべてのSupply Demandトレーダーの皆さんのお気に召すはずです。:) 重要情報の公開 Advanced Supply Demandの可能性を最大化するには、 https://www.mql5.com/ja/blogs/post/720245 にアクセスしてください。   エントリーまたはターゲットの正確なトリガーポイントを正確に特定できれば取引がどのように改善されるか想像してみてください。新しい基盤となるアルゴリズムに基づいて構築されているため、買い手と売り手の間の潜在的な不均衡をさらに簡単に特定できます。これは、最も強い需要と供給のゾーンと、過去のパフォーマンス(古いゾーンを表示)がグラフィカルに表現されるためです。これらの機能は、最適
    Scalper Vault は、スキャルピングを成功させるために必要なすべてを提供するプロフェッショナルなスキャルピング システムです。このインジケーターは、外国為替およびバイナリー オプションのトレーダーが使用できる完全な取引システムです。推奨される時間枠は M5 です。 システムは、トレンドの方向に正確な矢印シグナルを提供します。また、トップとボトムのシグナルとギャン マーケット レベルも提供します。 インジケーターは、プッシュ通知を含むすべてのタイプのアラートを提供します。 インジケータの購入後にご連絡ください。私の個人的な取引の推奨事項と素晴らしいボーナス指標を無料で共有します! 幸せで有益な取引をお祈りします!
    TrendMaestro
    Stefano Frisetti
    5 (3)
    note: this indicator is for METATRADER4, if you want the version for METATRADER5 this is the link:  https://www.mql5.com/it/market/product/108106 TRENDMAESTRO ver 2.4 TRENDMAESTRO recognizes a new TREND in the bud, he never makes mistakes. The certainty of identifying a new TREND is priceless. DESCRIPTION TRENDMAESTRO identifies a new TREND in the bud, this indicator examines the volatility, volumes and momentum to identify the moment in which there is an explosion of one or more of these data a
    TakePropips Donchian Trend Pro
    Eric John Pajarillaga Aldana
    4.44 (16)
    TakePropips Donchian Trend Pro   (MT4) は、ドンチャン チャネルを使用してトレンドの方向を自動的に検出し、エントリーとエグジットの取引シグナルを提供する強力で効果的なツールです! この多機能インジケーターには、トレンド スキャナー、取引シグナル、統計パネル、スクリーナー、取引セッション、およびアラート履歴ダッシュボードが含まれます。取引シグナルを提供し、チャートを分析する時間を節約するように設計されています! ユーザー マニュアルとインストール ガイドは、ブログ投稿 (   https://www.mql5.com/en/blogs/post/751368   ) からダウンロードできます。 今日は 50% オフ! 98ドルから49ドルに値下げ! このインジケーターは、ストラテジー テスターでテストできます (ビジュアル モードを有効にします)。 詳細については、説明の下にあるビデオ チュートリアルも利用できます。 ご不明な点やサポートが必要な場合は、私に連絡してください。 TakePropips Donchian Trend Pro イン
    The All-in-One Trade Indicator (AOTI) determines daily targets for EURUSD, EURJPY, GBPUSD, USDCHF, EURGBP, EURCAD, EURAUD, AUDJPY, GBPAUD, GBPCAD, GBPCHF, GBPJPY, AUDUSD, and USDJPY. All other modules work with any trading instruments. The indicator includes various features, such as Double Channel trend direction, Price channel, MA Bands, Fibo levels, Climax Bar detection, and others. The AOTI indicator is based on several trading strategies, and created to simplify market analysis. All-in-One
    Trins
    Ivan Simonika
    1 (1)
    One of the main definitions for monitoring the currency market is the trend. The Trins indicator is designed to display the trend in a visual form. Trend is a stable direction of price movement. To find it, the indicator uses calculations designed to smooth out sharp fluctuations that do not affect the overall picture of price movement. The trend can be increasing (bullish trend) and decreasing (bearish trend). In most cases, the trend is growing for a long time and drops sharply, but in all
    このダッシュボードは、選択されたシンボルの最新の利用可能なハーモニックパターンを表示するので、時間を節約し、より効率的に / MT5バージョン 。 無料インジケーター: Basic Harmonic Pattern インジケーター列 Symbol : 選択したシンボルが表示されます。 Trend : 強気または弱気 Pattern : パターンの種類(ガートレー、バタフライ、バット、カニ、サメ、サイファー、ABCD) Entry : エントリー価格 SL: ストップロス価格 TP1: 1回目の利食い価格 TP2: 2回目の利食い価格 TP3: 3回目の利食い価格 Current price : 現在値 Age (in bars):  最後に描画されたパターンの年齢 主な入力項目 Symbols: "28 Major Currency Pairs "または "Selected Symbols "から選択。 Selected Symbols: カンマで区切られた監視したいシンボル("EURUSD,GBPUSD,XAUUSD")。ブローカーがペアに接尾辞または接頭辞を付けて
    You’ll love how you can receive alerts to your email and SMS when the candles turn green or red signifying the best buy and sell times in correlation to confirmed uptrends and downtrends. TO USE 1. Buy when green candles appear - this represents an uptrend. 2. Sell when red candles appear - this represents a downtrend. EXTRA FEATURE This indicator NEVER repaints so when a candle closes, that color is final. Also, the blue trend lines in the photos are not included, this is to demonstrate the pri
    製品を購入する前に、以下の情報をお読みください。 Apollo Pips PLUS SP はユニークな製品です。これは、私の新しい「アポロ ピップス」インジケーターと、私のすべての取引インジケーターにアクセスできる「スーパー パック」ボーナスを手に入れたい人のためのものです。 Apollo Pips PLUS SP 製品を購入すると、実際には私の Apollo Pips インジケーターのまったく新しいバージョンを購入することになります。このバージョンのインジケーターには改良されたアルゴリズムと使いやすいパラメーターがあり、あらゆる市場およびあらゆる取引スタイルでインジケーターを使用する機会が得られます。 この製品の購入者は、私のスーパーボーナスとして、他のすべてのインジケーターにも無料でアクセスできます!私のすべての取引ツールにアクセスしたい場合は、この製品が最適です!:) しかし、これがすべてではありません!:) この製品のすべての購入者は、私の新しいインジケーターを無料で入手する資格もあります!:)新しい取引インジケーターを利用できるようになりました。私の特権のある「スーパー パッ
    作者のその他のプロダクト
    Auto Order Block with break of structure based on ICT and Smart Money Concepts (SMC) Futures Break of Structure ( BoS )             Order block ( OB )            Higher time frame Order block / Point of Interest ( POI )    shown on current chart           Fair value Gap ( FVG ) / Imbalance   -  MTF      ( Multi Time Frame )    HH/LL/HL/LH  -  MTF      ( Multi Time Frame )  Choch  MTF      ( Multi Time Frame )  Volume Imbalance     ,  MTF          vIMB Gap’s Power of 3 Equal High
    Quarterly Cycles
    Barend Paul Stander
    5 (1)
    Quarterly Cycles Quarterly Cycles is based on the Quarterly Theory developed by Daye (  traderdaye on X ). This is an aid to the user to find Cycles and it is NOT automatic detected, user can select AMDX or XAMD  in each Cycle and it will be visually drawn on the chart.  Quarterly Cycles:   Yearly, Monthly, Weekly, Daily, 6 Hour (90 minutes) –  Yearly Cycle : The year is divided in four sections of three months each Q1 - January, February, March Q2 - April, May, June Q3 - July, August, Sept
    DR IDR Pro
    Barend Paul Stander
    3 (2)
    Defining Range ( DR ) and Implied Defining Range ( IDR  ) indicator Pro with added features from free version Show DR and IDR ranges Sessions on the chart for   RDR     Regular defining range (New York Session) ADR    After defining range (Asian session) ODR     Outside defining range (London Session) Buttons on chart to enable / disable : Show  Imbalance ( IMB ) Show Volume Imbalance ( VIB ) Show  Gap's between open and close Show  Standard Deviation ( SD ) Show last 3 Sessions
    Candle Range Theory - CRT Mark Candle Range Theory - CRT  bars on the chart. Options: choose between   2 bar CRT or  CRT that include inside bars Show higher time frame CRT on lower time frame chart show current time frame CRT on chart with higher time frame CRT Alert when new CRT has formed Show / Hide Labels Button Menu to select Options for more information on using Candle Range Theory - CRT look on X for @Romeotpt @SpeculatorFL
    Quarterly Cycles Quarterly Cycles is based on the Quarterly Theory developed by Daye (  traderdaye on X ) T his is an aid to the user to find Cycles and it is NOT automatic detected, user can select AMDX or XAMD in each Cycle and it will be visually draw on the chart. Quarterly Cycles:   Yearly, Monthly, Weekly, Daily, 6 Hour (90 minutes) Yearly Cycle: The year is divided in four sections of three months each Q1 - January, February, March Q2 - April, May, June Q3 - July, August, September Q4
    Equal Highs and Lows Indicator Find and Mark Equal Highs and Lows on chart of Selected Multi Time frames. Options: set min and max bars between Equal High's / Low's bars set max points difference between High's / Low's  ( Sensitivity  ) Select time frames by buttons on chart Select / Filter only High's or Low's by a button Extend Equal High's / Low's line forward for chart reference Manual  MT4 version MT5 version Other Indicators
    DR IDR Pro mt4
    Barend Paul Stander
    3 (2)
    Defining Range ( DR ) and Implied Defining Range ( IDR  ) indicator Pro with added features from free version Show DR and IDR ranges Sessions on the chart for   RDR     Regular defining range (New York Session) ADR    After defining range (Asian session) ODR     Outside defining range (London Session) Buttons on chart to enable / disable : Show  Imbalance ( IMB ) Show Volume Imbalance ( VIB ) Show  Gap's between open and close Show  Standard Deviation ( SD ) Show last 3 Sessions
    Imbalance MTF mt4
    Barend Paul Stander
    5 (1)
    Imbalance / FVG  MTF Mark Imbalance on chart of  Selected Multi Time frames. Trend is Manually set to filter signals in the chosen direction by a button on the chart. . Futures Auto Mark Imbalance / FVG on chart on selected time frames Select time frames by buttons on chart Popup Alert, Push Notification or email when New Imbalance Form Popup Alert, Push Notification or email when Imbalance is Taken out Select Alert Mode to be a single or multiple Imbalance ( OR / AND option ) when Imbalan
    Imbalance / FVG MTF Mark Imbalance on chart of  Selected Multi Time frames. Trend is Manually set to filter signals in the chosen direction by a button on the chart. . Futures Auto Mark Imbalance / FVG on chart on selected time frames Select time frames by buttons on chart Popup Alert, Push Notification or email when New Imbalance Form Popup Alert, Push Notification or email when Imbalance is Taken out Select Alert Mode to be a single or multiple Imbalance ( OR / AND option )  when Imbalan
    ICT Kill zone and Macros Indicator mark and display the following zone times on the chart: Kill zones   Kill zone Forex Asian London Open New York Open London Close Central Bank Dealing range Kill zone Indices Asian London Open New York AM New York Lunch New York PM Power Hour Macros London 1 London 2 New York Am 1 New York AM 2 New York Lunch New York PM 1 New York PM 2 Silver bullet London Open New York AM New York PM Sessions Asian London New York Chart The display of  Kill zone ,
    BPS BoS - Break of Structure BoS - Fractal mode , MTF BoS - Zigzag mode , MTF Show HH and LL Alerts - Popup , Push notification and eMail Option to create screenshot on alert Enable / Disable Indicator with a button on chart to select options Choose corner of button location It is not a system but a indicator to help identify break of structure points MT5 version here :  https://www.mql5.com/en/market/product/84734?source=Site+Profile+Seller Other Indicators : https://www.mql5.
    ICT Kill zone and Macros Indicator mark and display the following zone times on the chart: Kill zones   Kill zone Forex Asian London Open New York Open London Close Central Bank Dealing range Kill zone Indices Asian London Open New York AM New York Lunch New York PM Power Hour Macros London 1 London 2 New York Am 1 New York AM 2 New York Lunch New York PM 1 New York PM 2 Silver bullet London Open New York AM New York PM Sessions Asian London New York Chart The display of  Kill zone ,
    BPS BoS - Break of Structure BoS - Fractal mode , MTF BoS - Zigzag mode , MTF Show HH and LL Alerts - Popup , Push notification and eMail Option to create screenshot on alert Enable / Disable Indicator with a button on chart to select options Choose corner of button location It is not a system but a indicator to help identify break of structure points MT 4 Version : https://www.mql5.com/en/market/product/78420?source=Site+Profile+Seller Other Indicators : https://www.mql5.com/en/use
    Equal Highs and Lows Indicator Find and Mark Equal Highs and Lows on chart of Selected Multi Time frames. Options: set min and max bars between Equal High's / Low's bars set max points difference between High's / Low's  ( Sensitivity  ) Select time frames by buttons on chart Select / Filter only High's or Low's by a button Extend Equal High's / Low's line forward for chart reference Manual  MT4 version MT5 version Other Indicators
    Support and Resistance X3 calculate and show Support and Resistance in 3 different modes and 2 different Styles. Modes: ICT High / Low Mode Fractal Mode ZigZag mode Styles: Dot Line Options: Button to choose between  3 Modes Button to choose between 2  Styles Alert when Support and Resistance touched Alert when Support and Resistance break Button to hide / show Menu Button take and save screenshot of current chart
    フィルタ:
    Komitet
    20
    Komitet 2024.06.24 09:31 
     

    Индикатор супер! Мне нравится!

    lauro1956
    5182
    lauro1956 2024.06.21 10:51 
     

    Really good

    Sunny Chukwubuikem Okoli
    157
    Sunny Chukwubuikem Okoli 2024.05.30 21:52 
     

    It used to work, but now it's no longer usable as it doesn't update anymore on a live chart. With lot's of Not-So-Useful features it's now impossible for a low processor computer to even run it. Waste of money

    neirss
    30
    neirss 2024.05.27 17:26 
     

    Волшебный индикатор. Разработчику огромная благодарность. Удачи в новых разработках.

    alinafar
    62
    alinafar 2024.05.21 19:14 
     

    It is a good tool and better features should be added such as choch fibonacci. It is used in general.

    zakir1970
    55
    zakir1970 2023.12.02 17:13 
     

    Day by day he's improving the indicator, very impressive! must say, did a good job and keep going! Another good part of this indicator is not too much unnecessary options which can make people super confused. now my request is please add a new FVG alert when it's formed. Thank for your hard work.

    Jason Pook
    238
    Jason Pook 2023.09.09 20:36 
     

    If you trade ICT concepts this is the best indicator for the MT4 platform and I've tried a few. The author has recently made several updates to add new features that really enhance the use and profitability. Excellent work..

    Thank you for all the recent additions to the indicator - this is the best MT4 ICT indicator by a mile..

    AlphaTraderZen
    305
    AlphaTraderZen 2023.07.11 06:30 
     

    Good Indicator... One suggestion .. Can you put arrow signal when price touches the Orderblocks? This will be a great update.. Thank u..

    Great Update..... Can u please add Signal Buffer on OB Touch? Planning to buy this on MT5 as well.. Waiting for the signal buffer update... Thank u

    sylvain974
    24
    sylvain974 2023.06.22 09:58 
     

    L'indicateur est bien mais il bloque sur mon mt4, ne se mette pas à jour et je ne peux pas le mettre en automatique. Et il manque pas mal de chose sur votre indicateur. les wick, EQL, EQH, CHOCH et encore il manque beaucoup beaucoup de choses à ajouter sur cette indicateur.

    Avinash Reddy Kummetha
    1125
    Avinash Reddy Kummetha 2023.03.05 10:54 
     

    Do not buy it bad customer service. Don’t care about existing customer and bad product design. MTF should have added in the same product, instead new product released, why would I buy exact same product again?? Why won’t you enhance this product instead and also resolve issues with this product.

    En Shahdi
    185
    En Shahdi 2023.01.16 13:35 
     

    great indi!. Make your life easier.

    Jonathan Barack
    23
    Jonathan Barack 2023.01.10 17:05 
     

    ユーザーは評価に対して何もコメントを残しませんでした

    2140097491
    20
    2140097491 2022.09.21 09:05 
     

    It's very good for what it does. But I found a major issue. When you open multiple tabs of the same pair you are trading, when the POI button is turned off, all POI order blocks across all the tabs will be turned off. This is a major issue, please fix.

    MacBidouille
    34
    MacBidouille 2022.08.23 15:41 
     

    ユーザーは評価に対して何もコメントを残しませんでした

    Manase Shovaleka
    55
    Manase Shovaleka 2022.06.19 19:43 
     

    The best investment of my life. This indicator is unbelievable. I still can't believe it simplified my trading 5 years into the future. Keep up with the good work I can't thank u enough.

    RealiRay
    936
    RealiRay 2022.04.22 00:53 
     

    one of the best indicator I've used! only for those who are using smart money concepts.

    Tony Born
    366
    Tony Born 2022.04.21 07:17 
     

    I love this indicator in combo with the dashboard, made a big difference for me. An easy 5 stars.

    whun450
    89
    whun450 2022.04.21 05:12 
     

    Best indicator I have ever spent money on. I watch order blocks and trend on 4 hour chart and I trade off 1 hour and 15 minute POI without changing charts. The indicator is extremely accurate and I promise you that if you trade market structure, you will be amazed at what you get for $60.

    shola.abitogun
    121
    shola.abitogun 2022.03.09 04:53 
     

    Great indicator.

    Mr.
    421
    Mr. 2022.02.28 16:18 
     

    awesome indicator very promising. I hope there will be a toggleable button for all the writings so that the chart will be clean only the supply and demand plus the lines of BOS can be seen.

    12
    レビューに返信
    バージョン 5.7 2024.06.11
    bug fix
    バージョン 5.6 2024.06.11
    add option to change Button colors
    バージョン 5.5 2024.06.11
    POI alert fix
    バージョン 5.4 2024.06.07
    add bar count error checks
    バージョン 5.3 2024.06.05

    add HH , LL , HL , LH

    add HTF Choch / HTF BOS

    add Power of 3

    add manual Fib's functions
    バージョン 5.1 2024.05.16

    add a button to Show / Hide Trade Levels

    add FVG poi / higher time-frame option
    バージョン 4.9 2024.02.09

    add button to move or Hide Menu
    バージョン 4.8 2024.01.27

    add error checking
    vol imbalance extend past bar 0
    バージョン 4.7 2023.12.19
    bug fixes
    バージョン 4.6 2023.12.14

    Add button to take and save a screenshot

    Add FVG formed alert
    バージョン 4.5 2023.11.25

    Upgrade Volume Imbalance to MTF
    Upgrade EQ H/L to MTF
    some fixes
    バージョン 4.4 2023.10.30
    fix POI error
    バージョン 4.3 2023.10.29

    new Menu style buttons
    バージョン 4.2 2023.10.27

    add Weekly and daily NY day open to liquidity

    add Equal_HL alerts

    add a option to set imbalance button to show current only

    add option to show old FVG/ Imbalance up to takeout bars
    バージョン 4.1 2023.10.13

    add date number to session labels

    minor fixes
    バージョン 4.0 2023.10.06
    Fix Menu Location option
    バージョン 3.9 2023.10.06

    add alerts when Liquidity line is touched

    add MTF options to FVG / Imbalance button

    add options to mark sessions time , kill zone times and silver bullet times
    バージョン 3.8 2023.09.19

    add - select Liquidity mode by button
    バージョン 3.7 2023.09.15

    add option to Mark POI touches

    add option to show Liquidity levels on the side of chart
    バージョン 3.6 2023.09.13

    fix OB price labels spacing

    add option to hide menu
    バージョン 3.5 2023.09.09
    minor bug fix
    バージョン 3.4 2023.09.08
    Add Liquidity line Labels
    バージョン 3.3 2023.09.07
    Added :

    - button to turn BOS on/off

    - Vol Imbalance

    - Mark Gap's

    - Show Equal High / Lows

    - Show Liquidity lines :

    PMH - Previous Month High
    PWH - Previous Week High
    PDH - Previous Day High
    HOD - High Of Day
    HOW - High Of Week


    PML - Previous Month Low
    PWL - Previous Week Low
    PDL - Previous Day Low
    LOD - Low Of Day
    LOW - Low Of Week
    バージョン 3.2 2023.07.16
    OB touch markers
    バージョン 3.1 2023.05.03
    Show RR improvements
    バージョン 3.0 2023.03.06
    add new OB formed alert
    バージョン 2.9 2022.05.30
    Add trigger alert once per OB with setting : Alert_on_OB_First_touch_only = true
    バージョン 2.8 2022.03.17

    add FILTER OB can touch BoS line
    バージョン 2.7 2022.03.12
    Add OB Size
    バージョン 2.6 2022.01.10
    Change POI time frame from button
    バージョン 2.5 2022.01.06
    Add option to hide buttons
    バージョン 2.4 2021.12.18
    Add Imbalance Alerts
    バージョン 2.3 2021.12.13
    some bug fixes
    バージョン 2.2 2021.11.19

    add BoS alerts

    limit alerts to X minutes
    バージョン 2.1 2021.11.11
    Add Price levels to Alerts
    Show OB price levels next to Order block
    バージョン 2.0 2021.10.24
    Added Higher time frame POI
    バージョン 1.6 2021.10.10
    Push Notifications Added
    バージョン 1.5 2021.10.05
    OB can be set as Solid or Outline
    バージョン 1.4 2021.09.29
    Add stability_check to indicator
    バージョン 1.3 2021.09.21
    Added function to show Imbalances
    バージョン 1.2 2021.08.26
    Upgrade to version 1.2