• 미리보기
  • 리뷰 (34)
  • 코멘트 (178)
  • 새 소식

Auto Orderblock with Break of Structure

4.45

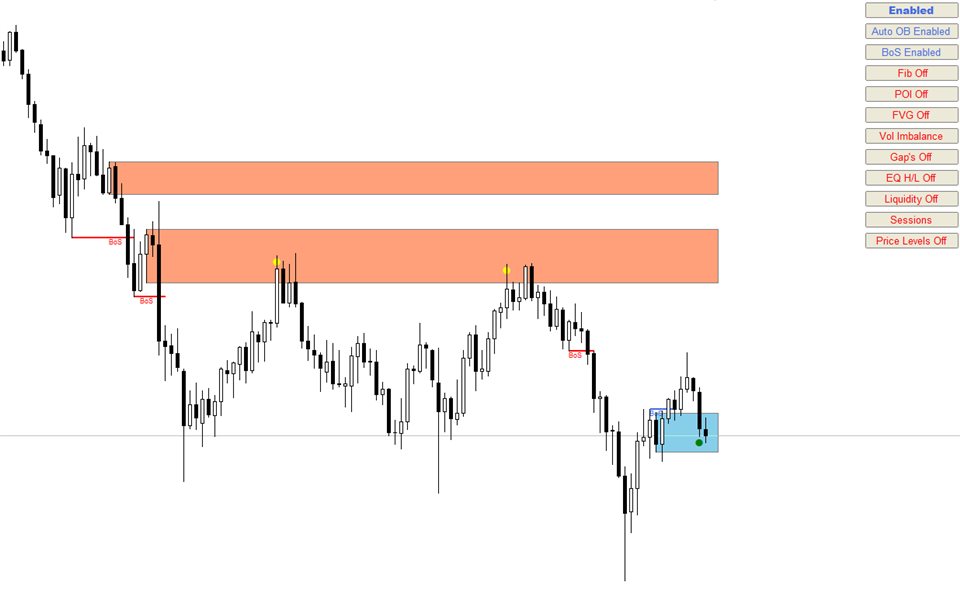
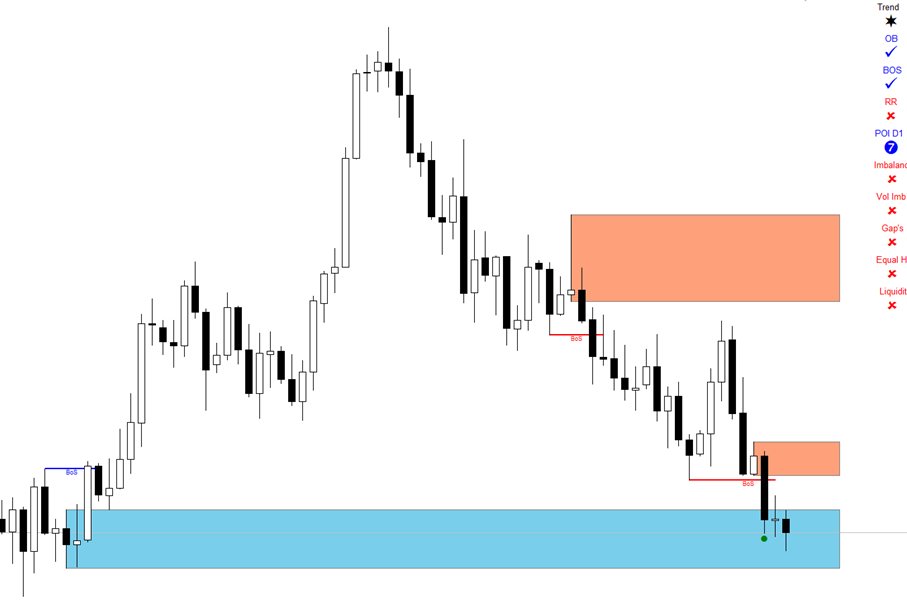
Auto Order Block with break of structure based on ICT and Smart Money Concepts (SMC)

Futures

  • Break of Structure ( BoS )           
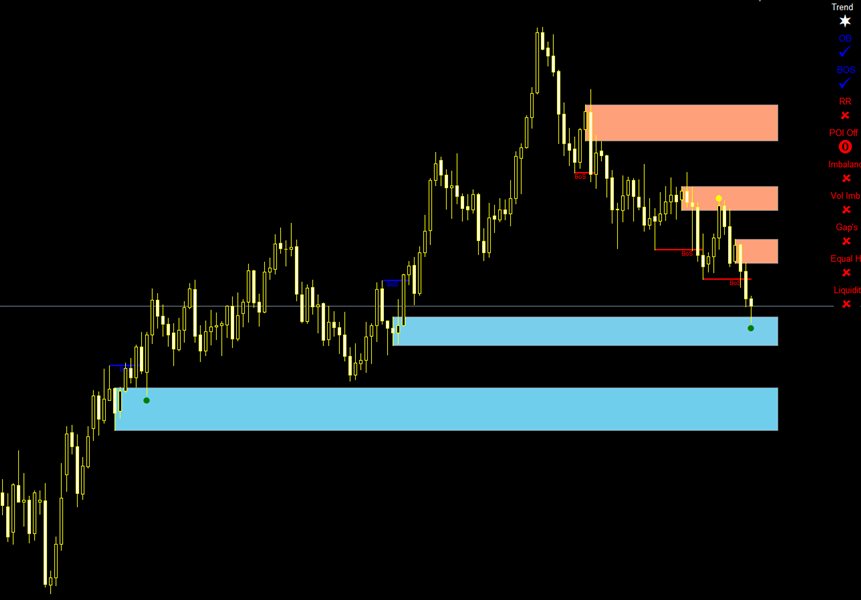
  • Order block ( OB )          
  • Higher time frame Order block / Point of Interest ( POI )   shown on current chart          
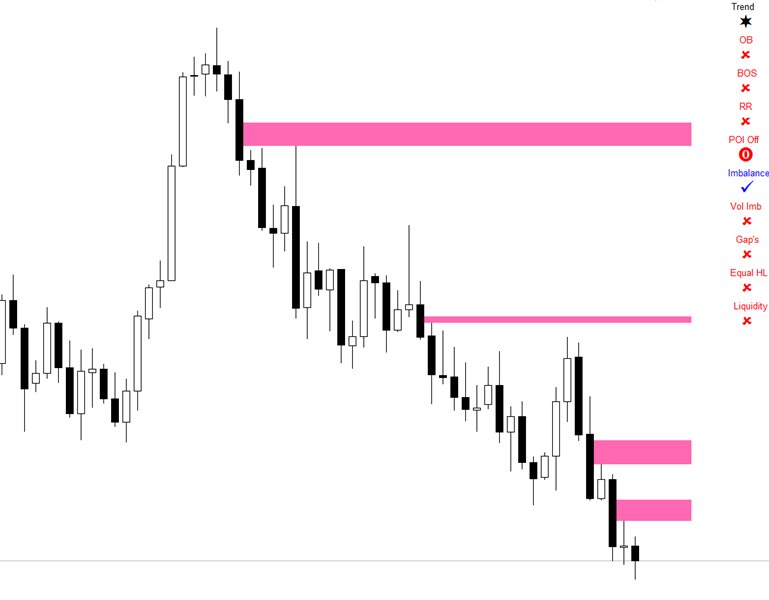
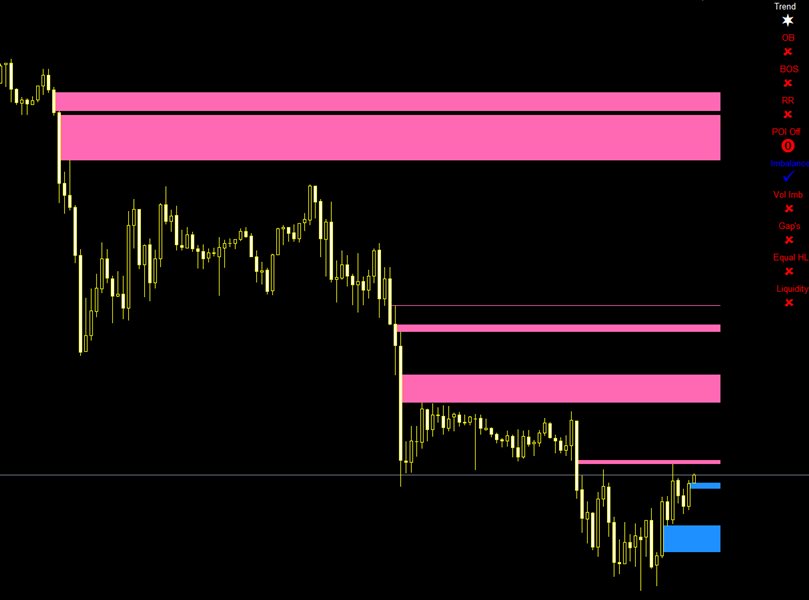
  • Fair value Gap ( FVG ) / Imbalance   -  MTF     ( Multi Time Frame )   
  • HH/LL/HL/LH  -  MTF     ( Multi Time Frame ) 
  • Choch  MTF     ( Multi Time Frame ) 
  • Volume Imbalance    ,  MTF          vIMB
  • Gap’s
  • Power of 3
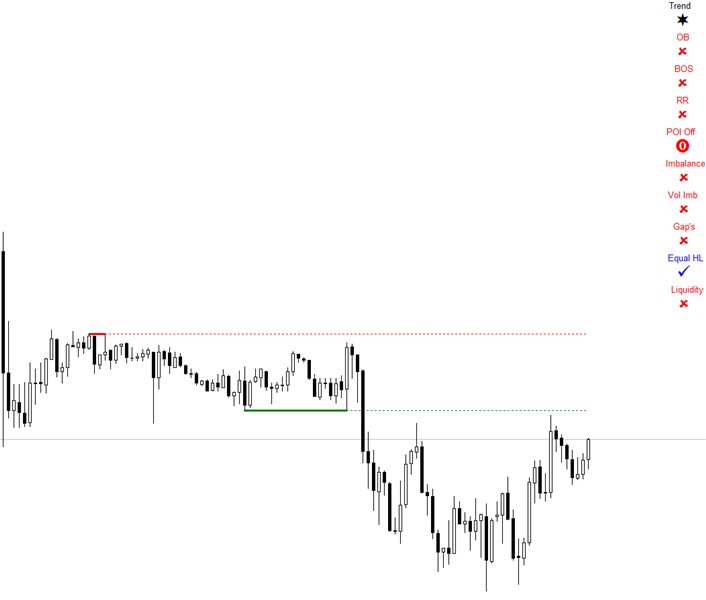
  • Equal High / Low’s     ,  MTF             EQH / EQL
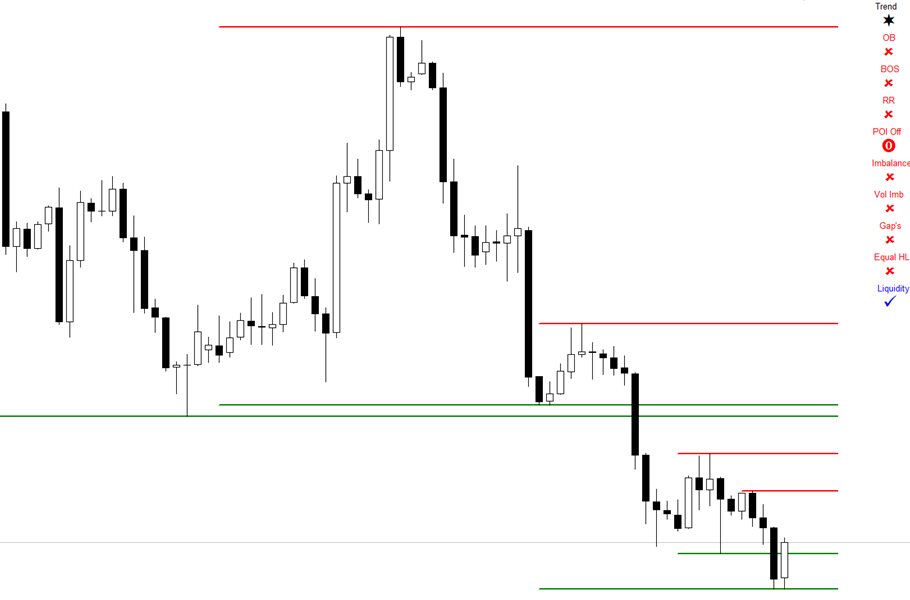
  • Liquidity             
    • Current Day High / Low           HOD / LOD
    • Previous Day High / Low          PDH + PDL
    • Current Week High / Low        HOW / LOW
    • Previous Week High / Low       PWH / PWL
    • Current Month High / Low       HOM / LOM
    • Previous Month High / Low      PMH / PML
    • Previous Day Close                    PDC 
    • Previous Week Close                 PWC 
    • Previous Month Close               PMC
    • Daily Open
    • Weekly Open
  • Premium / Discount - MTF     ( Multi Time Frame ) 
    • Sessions             
      • Asian , London and NY sessions
      • Kill Zone
      • Silver Bullet
    • Alerts
      • BoS Alerts
      • New OB Formed Alerts
      • New High / Low Formed Alerts
      • OB touched Alerts
      • OB  and  POI touch alerts
      • Fair value Gap ( FVG )/ Imbalance touch Alerts
      • Equal High / Low Alerts
      • Liquidity touch Alerts


    Manual Link


    MT5 Version


    Other Indicators 


    리뷰 34
    Komitet
    20
    Komitet 2024.06.24 09:31 
     

    Индикатор супер! Мне нравится!

    lauro1956
    5242
    lauro1956 2024.06.21 10:51 
     

    Really good

    neirss
    30
    neirss 2024.05.27 17:26 
     

    Волшебный индикатор. Разработчику огромная благодарность. Удачи в новых разработках.

    추천 제품
    Bermaui Channel
    Muhammad Elbermawi
    5 (19)
    This is a price channel that shows five important price levels on the chart. Those levels are: 1. The Highest High (HH) of the previous x bars. 2. The Highest Low (HL) of the previous x bars. 3. The Center Line. 4. The Lowest High (LH) of the previous x bars. 5. The Lowest Low (LL) of the previous x bars. How does Bermaui Channels Captures Overbought  area Think of the distance between HH and HL levels as an overbought area. When the price candles or bars crosses the HL to the upside this
    Introduction to Smart Renko The main characteristics of Renko Charting concern price movement. To give you some idea on its working principle, Renko chart is constructed by placing a brick over or below when the price make the movement beyond a predefined range, called brick height. Therefore, naturally one can see clear price movement with less noise than other charting type. Renko charting can provide much clearer trend direction and it helps to identify important support and resistance level
    Holy Renko PRO
    Bianca Seara
    3.5 (2)
    About  Holy Renko is a trend identifier capable of identify small and long market movements. This indicator should be use in Renko Charts. VIDEO (information and tips) [HERE] How to install Renko Charts [HERE] Features Developed for Renko Charts Easy to analyze Fast signals Not repaint (when candle close)  Statistics panel Filters false signals Alerts, emails and push notifications  Advantages of Renko Chart Easy to install Easy to analyze Filter out the noise of wicks  Easy identif
    CyberZingFx Volume
    Afsal Meerankutty
    4.75 (36)
    CyberZingFx Volume Indicator is designed to help traders find market reversals with ease. This powerful tool uses a unique strategy that combines both volume and historical price to provide accurate signals for potential market reversals. The indicator displays volume BUY and SELL power values on the right side of the chart for both BUY and SELL. With customizable settings, you can set alerts at different levels to suit your trading style. The most recent alert value is displayed as Alert High,
    FREE
    Identify Take
    Oleksii Ferbei
    4.5 (2)
    Identify Take - trend trading strategy, market noise filtering and all necessary functions built into one tool! The system itself shows in the form of arrows when to buy and when to sell. Uses only one setting parameter. Simple, visual and effective trend detection. The intelligent algorithm of the Identify Take indicator shows the points of a potential market reversal. Most often, a good trend can be seen visually on the price chart. But an experienced trader must clearly understand the curr
    Find and fill Gaps
    Leandro Oliveira
    This indicator shows the gaps on the current chart with a rectangle shape and indicates when the gap is filled by closing the shape. Gaps are considered over the shadows. Allows sending alerts by e-mail or push notifications when a gap is found. Parameters SizeGAP - Size of the gap that you want to indicate; HGcolor1 - Color of the gap in an upward movement; HGcolor2 - Color of the gap in a downward movement; HGstyle - The style of rectangle to be drawn; StartCalculationFromBar - How many cand
    The expert works on the Fibonacci levels on the previous candle With some digital way to enter the deal On the five minute frame Work on currency pairs only Do not use TakeProfit or Stop Loss How the expert works It is placed on the three currency pairs GBPUSD GBPJPY GBP AUD Same settings without changing anything When he works, he will work on only one currency of them until it closes on a profit Profit is only seven points Please watch the video Explains how the expert works. Max Spread = 0.3
    Projection Trend
    Tatiana Savkevych
    Projection Trend - a Forex arrow indicator without redrawing does not change its signals when the market situation changes, does not adjust to the chart. The signals given by him are unambiguous. Traders build a trading system that provides good signals 80-90% of the time. The indicator showing the points of entry and exit from the market with arrows is able to bring results not only in the Forex market, but also when working with binary options. You can buy it and install it in MetaTrader yo
    This indicator Super Neuro Trend indicator.Indicator displays trend movement. Indicator helps to buy and sell. Features FiltPer- displays indicator period. deviation - displaus indicator deviation. Trend - displaus indicator trend.( true,false) Rectangle - displaus indicator rectangle. (true,false)  How to understand the status: If the trend color is green, trend is up. I f the trend color is red, trend is down. I f the trend waiting,trend waiting.     /////////////////////////////////////////
    Before
    Nadiya Mirosh
    The Before indicator predicts the most likely short-term price movement based on complex mathematical calculations. Most of the standard indicators commonly used in trading strategies are based on fairly simple calculations. This does not mean that there were no outstanding mathematicians in the world at the time of their creation. It is just that computers did not yet exist in those days, or their power was not enough for the sequential implementation of complex mathematical operations. Nowa
    BE Channel OHLC
    Valerij Alekseev
    3 (1)
    The creation of this indicator was inspired by the phrase of the famous trader Michael Covel "Price is the best indicator in the world". Not everyone is able to see the market through the eyes of a professional. Probably an indicator that does not distort the price and visualizes what is happening on the market can help you. Indicator "BE Channel OHLC" has been created for this purpose. The indicator name has not been chosen by chance. The indicator draws a channel using OHLC prices (OPEN, HIGH,
    Rira Renko
    Vitor Palmeira Abbehusen
    RENKO on Time Chart This indicator is an enhanced Renko, so you can watch the Renko bricks on the chart to understand price movement more clearly the other improvement is automated box size according to ATR (Average True Range) period you can set the ATR number as you want and the box size of Renko changes automatically based on price movement Inputs Mode: Box size is the input to specify the size of the Renko box you want to print on the chart. This input lets you choose the fixed b
    RenkoMaPriceChannel
    Sergey Deev
    1 (1)
    The indicator displays Renko bars on the chart, uses their data to calculate and display the moving average, PriceChannel and generates buy/sell signals. Renko is a non-trivial price display method. Instead of displaying each bar within a time interval, only the bars where the price moved a certain number of points are shown. Renko bars do not depend on a time interval, therefore the indicator works on any timeframe without losing its efficiency. The PriceChannel indicator displays the upper, lo
    TMA Channel is a price channel obtained through a special calculation method based on traditional TMA . The channel has upper, middle, and lower tracks . When the price approaches or exceeds the upper track, it is already in an overbought state, and attention should be paid to the situation of reversal and decline; When the price approaches or falls below the lower track, it is already in an oversold state, and attention should be paid to the situation of reversal and rise . The indicator will d
    Scalp and Swing Signals
    Shiffolika Kapila
    4.5 (2)
    Scalp SWING indicator. It works on any time frame and Instruments It works on trending and ranging markets. The signals are robust and does not repaint. The system is robust and requires no supporting indicator. You don’t need any multiple indicators to trade the markets. The alerts/ notifications can be enabled to gain prompt entries. The entries are at Top and Bottom of Trend Cycles It is Very accurate and robust system- yet extremely simplified tools for the pro traders. Sc
    Renko Full Throttle PRO
    Dalya Elsadany
    4.52 (33)
    A Powerful Solution That Analyze The Renko And The Standard Charts And Filters Out The Noise Or The Narrow Range Moves And Gives Entry And Exit Signals. A statistics window is included to show the net points gained from these signals taking into considerations the spread of the pair and to evaluate accurately the overall performance. Advantages It Provides A Clear Buy and Sell signals with take profit and stoploss levels. A Statistical analysis that offers an accurate image of net gained point
    Power Renko MT4
    Pierce Vallieres
    Power Renko is an indicator which plots Renko bricks underneath the chart using a histogram. You can select the brick size and the timeframe of the Renko bricks as well as whether or not to use the close price or the high/low price of the candles. Renko bricks are based on price alone, not time, therefor the Renko bricks will not be aligned with the chart's time. They are extremely useful for trend trading and many different strategies can be formed from them. Buffers are provided allowing you t
    This indicator displays the ZigZag Pointer Fibonacci Expansion Triangle movements timeframes only M1-W1. Parameters InDepth: Displays the Depth movements. InDeviation: Displays the Deviation movements. InBackstep: Displays the Backstep movements. Fibonacci Expansion: Displays the Fibonacci Expansion movements. Fibonacci Expansion true.(false) Triangle: Displays the Triangle movements. Triangle true.(false) How to understand the status: If the Triangle is green, trend is up. If the Triangle is
    Chaos Trader Lite
    John Davis
    1 (1)
    Chaos Trader Lite attempts to use aspects of chaos theory to place trades in the marketplace. This Expert Advisor, in particular, draws upon theories made by Bill Williams. Every version of MetaTrader contains the Bill Williams indicators. I wondered why was he deemed so important as to have his own set of indicators added to MetaTrader with name attribution. Conducting research I found that Bill Williams wrote a book using chaos theory to trade the markets. The Bill Williams indicators are usef
    FREE
    OBTE = Order Block Type I OBTI Indicator MT4 is the most accurate and customizable indicator on the market. It was developed to facilitate the analysis of operations based on candlestick patterns and supply-demand zones. These zones are possible movement reversal points. For this indicator is generated by the order block of smart money concept. Input parameters: 1. Multiple timeframes : M1 M5 M15 M30 H1 H4 D1 W1 MN1 2. Default input: H1 H4 D1 W1 MN1 3. Notifications / Send Emails / Notificatio
    MASi Three Screens
    Aleksey Terentev
    5 (2)
    MASi Three Screens is based on the trading strategy by Dr. Alexander Elder. This indicator is a collection of algorithms. Algorithms are based on the analysis of charts of several timeframes. You can apply any of the provided algorithms. List of versions of algorithms:     ThreeScreens v1.0 - A simple implementation, with analysis of the MACD line;     ThreeScreens v1.1 - A simple implementation, with analysis of the MACD histogram;     ThreeScreens v1.2 - Combines the first two algorithms
    FREE
    The indicator displays Renko bars on the chart, uses their data to calculate and display the Bollinger Bands, MACD oscillator and generates buy/sell signals. Renko is a non-trivial price display method, in which a bar within a time interval is shown on the chart only if the price has moved a certain number of points. Renko bars do not depend on a time interval, therefore the indicator works on any timeframe without losing its efficiency. When attached to a chart, the indicator checks for presenc
    Trade Direction
    Gevorg Hakobyan
    5 (1)
    The oscillator shows trend direction using its own algorithm, which is based on calculating price values ​​by analyzing prices of separate currencies (original valuation of currencies). The histogram shows the average value of physical price change over the selected period. When the histogram has a positive value, the trend is rising, if negative - the trend id falling. The indicator uses standard RSI to determine the current market direction on a selected period as follows: the default value of
    ZhiBiTMG
    Qiuyang Zheng
    ZhiBiTMG is a collection of trends and martingale indicators for all market segments and all chart cycles. Many indicators on the market violate the trend but claim to be accurate, but is it really accurate? In fact, it is not accurate! Because the market must go with the trend. This ZhiBiTMG indicator gives the Martingale signal on the premise of the trend. This will be in line with market rules. Instructions for use: The red line is the downward trend line (Sell), a total of three lines; by de
    Flat Market
    Leonid Basis
    This is a self-explanatory indicator - do nothing when the current price in the "fence" (flat) mode. Definition of a flat market: A market price that is neither Up nor Down. The input parameter  counted_bars  determines on how many bars the indicator's lines will be visible starting from the current Bar backward. The input parameter  barsNum  is used as a Period for aqua "fence" calculation.
    이 소프트웨어 도구는 사용자 정의 가능한 5가지 색상을 선택하여 수평 추세선과 직사각형을 생성하는 프로세스를 간소화하도록 설계되었습니다. MT5에서 정확한 수평 추세선을 그리는 것은 어려울 수 있지만 이 지표를 사용하면 원하는 색상으로 쉽게 추세선을 만들 수 있습니다. 또한 우리 도구는 귀하가 그리는 수평선과 관련된 가격 수준을 명확하게 표시합니다. 우리는 귀하의 피드백을 소중히 여기며 이 도구가 귀하의 거래 요구에 맞는 귀중한 자산이 되기를 바랍니다. 주저하지 말고 귀하의 생각을 우리와 공유해 주십시오. ..................................................................................
    Tree Of Life
    Oeyvind Borgsoe
    Tree Of Life EA is an fully automatic trading advisor which recognise patterns and trends in a highly accurate manner. It is designed to generate stable long-term gains while providing excellent risk management. After years of trading and testing, we have discovered spesific combinations of indicators and internal calculations that secure a solid foundation for a robust strategy. The main indicators Tree Of Life uses are the Moving Average and Stochastic. Together with internal calculation
    ZigZag Lines MTF
    Taras Slobodyanik
    4.38 (13)
    Multi timeframe ZigZag indicator. It displays the support/resistance horizontal lines and their breakouts, as well as draws the current targets of the market. It can also display lines of the Fractals indicator and candles from other periods (up to Quarterly). So, you can actually see the supply and demand levels. You can also use it as indicator for the Break of Structure(BOS) & Market Structure Shift(MSS). The indicator redraws the last (current) point, and in some cases can change the last 2
    Free automatic fibonacci
    Tonny Obare
    4.66 (47)
    Free automatic Fibonacci is an indicator that automatically plots a Fibonacci retracement based on the number of bars you select on the BarsToScan setting in the indicator. The Fibonacci is automatically updated in real time as new highest and lowest values appears amongst the selected bars. You can select which level values to be displayed in the indicator settings. You can also select the color of the levels thus enabling the trader to be able to attach the indicator several times with differe
    FREE
    PowerXXX
    Marco Fornero Monia
    PowerXXX measures the power of the current candlestick and displays it in numerical format and colors. The indicator can cover multiple timeframes and can be placed on the main chart or on the charts of the underlying indicators. The number of timeframes is selectable, as well as the color levels according to the power expressed. In the latest version, the power can be expressed as a function of the opening of the candle itself or as a function of the opening of the total candles before. There
    이 제품의 구매자들이 또한 구매함
    Gann Made Easy
    Oleg Rodin
    4.8 (95)
    Gann Made Easy 는 mr.의 이론을 사용하여 최고의 거래 원칙을 기반으로 하는 전문적이고 사용하기 쉬운 Forex 거래 시스템입니다. W.D. 간. 이 표시기는 Stop Loss 및 Take Profit Levels를 포함하여 정확한 BUY 및 SELL 신호를 제공합니다. PUSH 알림을 사용하여 이동 중에도 거래할 수 있습니다. 구매 후 연락주세요! 내 거래 팁과 훌륭한 보너스 지표를 무료로 공유하겠습니다! 아마도 Gann 거래 방법에 대해 이미 여러 번 들었을 것입니다. 일반적으로 Gann의 이론은 초보자 거래자뿐만 아니라 이미 거래 경험이 있는 사람들에게도 매우 복잡한 것입니다. Gann의 거래 방식은 이론적으로 적용하기 쉽지 않기 때문입니다. 나는 그 지식을 연마하고 Forex 지표에 최고의 원칙을 적용하기 위해 몇 년을 보냈습니다. 표시기는 적용하기가 매우 쉽습니다. 차트에 첨부하고 간단한 거래 권장 사항을 따르기만 하면 됩니다. 지표는 지속적으로 시장 분석 작업
    - Real price is 80$ - 40% Discount ( It is 49$ now ) Contact me for instruction, add group and any questions! Related Products:  Bitcoin Expert , Gold Expert Introduction The breakout and retest strategy is traded support and resistance levels. it involves price breaking through a previous level.  The break and retest strategy is designed to help traders do two main things, the first is to avoid false breakouts. Many false breakouts start with a candlestick that breaks out of a level but ends w
    Dynamic Forex28 Navigator
    Bernhard Schweigert
    5 (2)
    Dynamic Forex28 Navigator - 차세대 외환 거래 도구. 현재 49% 할인. Dynamic Forex28 Navigator는 오랫동안 인기 있는 지표의 진화형으로, 세 가지의 힘을 하나로 결합했습니다. 고급 통화 Strength28 지표(695개 리뷰) + 고급 통화 IMPULSE with ALERT(520개 리뷰) + CS28 콤보 신호(보너스). 지표에 대한 자세한 정보 https://www.mql5.com/en/blogs/post/758844 차세대 Strength 지표는 무엇을 제공합니까?  원래 지표에서 좋아했던 모든 것이 새로운 기능과 더 높은 정확도로 강화되었습니다. 주요 기능: 독점적인 통화 Strength 공식.  모든 시간대에 걸쳐 부드럽고 정확한 강도선. 추세와 정확한 진입을 식별하는 데 이상적입니다. 역동적인 시장 피보나치 수준(시장 피보나치).  이 지표에만 있는 고유한 기능. 가격 차트가 아닌 통화 강도에 피보나치가 적용
    Bull versus Bear
    Mohamed Hassan
    4.44 (16)
    $65 for the first 96 /100   copies ( 4  copies left). Next price is $120 !  Send us a message after your purchase to receive more information on how to get your  BONUS  for FREE  that works in great combination with Bull vs Bear ! Bull versus Bear is an easy-to-use Forex indicator that gives traders clear and accurate signals based on clear trend retests . Forget about lagging indicators or staring at charts for hours because  Bull vs Bear provides real-time entries with no lag and no repai
    Golden Trend Indicator
    Noha Mohamed Fathy Younes Badr
    5 (7)
    Golden Trend indicator  is The best indicator for predicting trend movement this indicator never lags and never repaints and never back paints    and give  arrow buy and sell    before the candle appear  and it will help you and  will make your trading decisions clearer its work on all currencies and  gold and crypto and all time frame This unique  indicator uses very secret algorithms to catch the  trends, so you can trade using this indicator and see the trend clear on charts  manual guide and
    현재 20% 할인 ! 초보자 또는 전문가 트레이더를 위한 최고의 솔루션! 이 대시보드 소프트웨어는 28개의 통화 쌍에서 작동합니다. 2가지 주요 지표(Advanced Currency Strength 28 및 Advanced Currency Impulse)를 기반으로 합니다. 전체 Forex 시장에 대한 훌륭한 개요를 제공합니다. 고급 통화 강도 값, 통화 이동 속도 및 모든(9) 시간대의 28 Forex 쌍에 대한 신호를 보여줍니다. 추세 및/또는 스캘핑 기회를 정확히 파악하기 위해 차트의 단일 지표를 사용하여 전체 시장을 볼 수 있을 때 거래가 어떻게 개선될지 상상해 보십시오! 잠재적인 거래를 식별하고 확인하면서 강력한 통화와 약한 통화를 더욱 쉽게 식별할 수 있도록 이 지표에 기능을 내장했습니다. 이 표시기는 통화의 강세 또는 약세가 증가 또는 감소하는지 여부와 모든 시간대에서 수행되는 방식을 그래픽으로 보여줍니다. 추가된 새로운 기능은 현재 시장 조건 변화에 적
    Easy Breakout
    Mohamed Hassan
    Official release price of $75  for the first  25 copies (13 left). After that, price will automatically increase! After your purchase, feel free to contact me for more details on how to receive a bonus indicator called VFI, which pairs perfectly with Easy Breakout for enhanced confluence!   Easy Breakout is a powerful price action trading system built on one of the most popular and widely trusted strategies among traders: the Breakout strategy ! This indicator delivers crystal-clear Buy a
    MetaBands M4
    Vahidreza Heidar Gholami
    5 (3)
    MetaBands uses powerful and unique algorithms to draw channels and detect trends so that it can provide traders with potential points for entering and exiting trades. It’s a channel indicator plus a powerful trend indicator. It includes different types of channels which can be merged to create new channels simply by using the input parameters. MetaBands uses all types of alerts to notify users about market events. Features Supports most of the channel algorithms Powerful trend detection algorith
    Enigmera
    Ivan Stefanov
    5 (3)
    에니메라: 시장의 핵심 https://www.enigmera.com 소개 이 지표 및 트레이딩 시스템은 금융 시장에 대한 놀라운 접근 방식입니다. 에니메라는 프랙탈 주기를 사용하여 지지선과 저항선을 정확하게 계산합니다. 진정한 축적 단계를 보여주고 방향과 목표를 제시합니다.  추세에 있든 조정에 있든 작동하는 시스템입니다.  어떻게 작동하나요? 에니메라는 지지선/저항선, 목표선, 편차선의 세 가지 라인으로 구성됩니다. 이 시스템은 과거 데이터를 현재와 미래로 추정하는 일반적인 시장 지표와 달리 현재에 대한 완전한 그림을 제공합니다. 지지선 위에 있으면 실제 지지를 의미하고 저항선 위에 있으면 실제 저항을 의미합니다. 레벨이 깨지면 추세의 변화를 나타냅니다. 다시 그리지 않습니다. 시장이 지속적으로 진화함에 따라 에니메라는 평가 도구를 조정하여 전략을 정기적으로 수정합니다.   이를 통해 모든 시나리오를 철저히 평가할 수 있습니다. 이 시장 지표의 고유성은 분명하며 그 기
    TPSproTREND PrO
    Roman Podpora
    4.79 (19)
    TPSpro TREND PRO는   시장을 자동으로 분석하여 추세와 각 변화에 대한 정보를 제공할 뿐만 아니라 다시 그리지 않고도 거래에 진입할 수 있는 신호를 제공하는 추세 지표입니다! 지표는 각 양초를 사용하여 개별적으로 분석합니다. 다른 임펄스를 언급합니다 - 업 또는 다운 임펄스. 통화, 암호화폐, 금속, 주식, 지수 거래의 정확한 진입점! 버전 MT5                   표시기에 대한 전체 설명       표시기   와 함께 사용하는 것이 좋습니다   -   RFI LEVELS 주요 기능: 렌더링 없이 정확한 입력 신호! 신호가 나타나면 관련성은 유지됩니다! 이는 신호를 제공한 후 변경하여 예금 자금 손실을 초래할 수 있는 다시 그리기 지표와의 중요한 차이점입니다. 이제 더 큰 확률과 정확도로 시장에 진입할 수 있습니다. 화살표가 나타난 후 목표에 도달(이익실현)하거나 반전 신호가 나타날 때까지 캔들을 색칠하는 기능도 있습니다. STOP LOSS / TAK
    Apollo Pips PLUS SP
    Oleg Rodin
    5 (4)
    제품을 구매하기 전에 아래 정보를 읽어보세요! Apollo Pips PLUS SP는 독특한 제품입니다! 모든 거래 지표에 액세스할 수 있는 새로운 "APOLLO PIPS" 지표와 "슈퍼 팩" 보너스를 받고 싶은 분들을 위한 것입니다! Apollo Pips PLUS SP 제품을 구매하면 실제로 Apollo Pips 표시기의 완전히 새로운 버전을 구매하게 됩니다. 이 버전의 지표에는 개선된 알고리즘과 사용하기 쉬운 매개변수가 있어 모든 시장 및 거래 스타일에서 지표를 사용할 수 있는 기회를 제공합니다. 이 제품의 구매자는 슈퍼 보너스로 다른 모든 표시기에 무료로 액세스할 수 있습니다! 내 모든 거래 도구에 액세스하고 싶었다면 이 제품이 당신에게 딱 맞습니다! :) 하지만 이것이 전부는 아닙니다! :) 이 제품의 모든 구매자는 또한 내 새로운 지표를 무료로 받을 자격이 있습니다! :) 새로운 거래 지표를 사용할 수 있게 되었는데, 귀하는 저의 특별한 "SUPER PACK" 평생 보너스
    FX Volume
    Daniel Stein
    4.58 (33)
    FX 볼륨으로 외환 거래에서 진정한 우위를 점하세요: 최고의 거래량 지표 FX 거래량은 내부자 관점에서 진정한 시장 심리를 보여주는 최초이자 유일한 거래량 지표입니다. FX 거래량은 기관 시장 참여자와 브로커의 포지션에 대한 고유한 인사이트를 제공함으로써 일반적으로 메이저 플레이어에게만 있는 선견지명을 가지고 거래할 수 있게 해줍니다. FX 볼륨은 차트에서 이 중요한 정보를 즉시 제공하므로 더 빠르고 현명한 트레이딩 결정을 내릴 수 있습니다. FX 볼륨이 트레이딩에 필수적인 이유 FX 거래량을 사용하면 고유한 시장 데이터에 비할 데 없이 접근할 수 있어 일반적인 거래량 지표가 제공하지 못하는 인사이트를 얻을 수 있습니다. 차트에서 직접 추적할 수 있는 항목은 다음과 같습니다: 포지션 비율: 통화별 롱/숏 포지션 비율을 확인하여 시장 심리를 명확하게 파악하세요. 비율 변화: 선택한 기간 동안 매수 포지션의 비율 변화를 확인하세요. 총 거래량: 통화별 총 거래량(매수 및 매도)을
    Trend Screener
    STE S.S.COMPANY
    4.81 (89)
    트렌드 표시기, 트렌드 트레이딩 및 필터링을 위한 획기적인 고유 솔루션, 하나의 도구 안에 내장된 모든 중요한 트렌드 기능! Forex, 상품, 암호 화폐, 지수 및 주식과 같은 모든 기호/도구에 사용할 수 있는 100% 다시 칠하지 않는 다중 시간 프레임 및 다중 통화 표시기입니다. 기간 한정 특가: 지원 및 저항 스크리너 지표는 단 100달러에 평생 제공됩니다. (원래 가격 50 달러) (제안 연장) Trend Screener는 차트에 점이 있는 화살표 추세 신호를 제공하는 효율적인 지표 추세 추종 지표입니다. 추세 분석기 표시기에서 사용할 수 있는 기능: 1. 트렌드 스캐너. 2. 최대 이익 분석이 있는 추세선. 3. 추세 통화 강도 측정기. 4. 경고가 있는 추세 반전 점. 5. 경고가 있는 강력한 추세 점. 6. 추세 화살표 Trend Screener Indicator가 있는 일일 분석 예, 일일 신호 성능...등은 여기에서 찾을 수 있습니다.   여기를 클릭하십시오.
    FX Power MT4 NG
    Daniel Stein
    5 (14)
    FX 파워 NG의 모든 기능을 활용하세요: 궁극의 통화 강도 측정기 FX Power는 8년 이상 전 세계 트레이더에게 믿을 수 있고 정확한 통화 강세 분석을 제공해 왔습니다. 이제 FX Power NG는 이 신뢰할 수 있는 도구를 한 단계 더 발전시켜 거래에 탁월한 정확성, 사용자 지정 및 통찰력을 제공하는 고급 기능을 제공합니다. FX Power NG가 진지한 트레이더에게 필수품인 이유는 무엇인가요? FX Power NG는 기존 FX Power에서 좋아했던 모든 기능을 기반으로 주요 기능을 추가하고 개선했습니다: 금 강도 분석(XAU): 이제 통화쌍과 함께 금의 강세를 추적하여 더욱 폭넓은 시장 인사이트를 얻을 수 있습니다. 정교한 계산: 모든 분석에서 더욱 정확하고 신뢰할 수 있는 결과를 경험하세요. 사용자 지정 가능한 분석 기간: 일중부터 장기 인사이트까지 트레이딩 전략에 맞게 분석 기간을 조정할 수 있습니다. 고급 다중 인스턴스 설정: 여러 인스턴스를 실행하여 종합적으
    Gold Stuff
    Vasiliy Strukov
    4.87 (245)
    Gold Stuff는 금을 위해 특별히 설계된 추세 지표이며 모든 금융 상품에서도 사용할 수 있습니다. 표시기가 다시 그려지지 않고 지연되지 않습니다. 권장 기간 H1. 표시기에서 완전 자동 Expert Advisor EA Gold Stuff를 작동합니다. 내 프로필에서 찾을 수 있습니다. 설정 및 개인 보너스를 받으려면 구매 후 즉시 저에게 연락하십시오!   강력한 지원 및 트렌드 스캐너 표시기의 무료 사본을 받으실 수 있습니다. 메시지를 보내주세요. 나!   설정 화살표 그리기 - 켜기 끄기. 차트에 화살표 그리기. 경고 - 가청 경고를 끕니다. 이메일 알림 - 켜기 끄기. 이메일 알림. Puch-notification - 켜기 끄기. 푸시 알림. 다음으로 색 영역을 조정합니다. Gold Stuff는 금을 위해 특별히 설계된 추세 지표이며 모든 금융 상품에서도 사용할 수 있습니다. 표시기가 다시 그려지지 않고 지연되지 않습니다. 권장 기간 H1. 표시기에서 완
    Supply and Demand Dashboard PRO
    Bernhard Schweigert
    4.8 (20)
    현재 20% 할인! 이 대시보드는 여러 기호와 최대 9개의 타임프레임에서 작동하는 매우 강력한 소프트웨어입니다. 주요 지표(최상의 리뷰: 고급 공급 수요)를 기반으로 합니다.   Advanced Supply Demand 대시보드는 훌륭한 개요를 제공합니다. 다음과 같이 표시됩니다.  영역 강도 등급을 포함하여 필터링된 공급 및 수요 값, 영역에 대한/및 영역 내 Pips 거리, 중첩된 영역을 강조 표시하고 모든 (9) 시간 프레임에서 선택한 기호에 대해 4가지 종류의 경고를 제공합니다. 그것은 당신의 개인적인 필요에 맞게 고도로 구성 가능합니다! 당신의 혜택! 모든 트레이더에게 가장 중요한 질문: 시장에 진입하기에 가장 좋은 수준은 무엇입니까? 최고의 성공 기회와 위험/보상을 얻으려면 강력한 공급/수요 영역 내 또는 그 근처에서 거래를 시작하십시오. 손절매를 위한 최적의 장소는 어디입니까? 가장 안전하려면 강력한 수요/공급 구역 아래/위에 정
    Scalper Vault
    Oleg Rodin
    5 (27)
    Scalper Vault 는 성공적인 스캘핑에 필요한 모든 것을 제공하는 전문 스캘핑 시스템입니다. 이 표시기는 외환 및 바이너리 옵션 거래자가 사용할 수 있는 완전한 거래 시스템입니다. 권장 시간 프레임은 M5입니다. 시스템은 추세 방향으로 정확한 화살표 신호를 제공합니다. 또한 상단 및 하단 신호와 Gann 시장 수준을 제공합니다.  이 시스템은 사용하기가 매우 쉽습니다. 원하는 시장 지역의 화살표만 따라가면 됩니다. 엑시트는 가격이 적정 수준에 도달하거나 시장의 고점 또는 저점 신호가 나타날 때 수행됩니다.  표시기는 PUSH 알림을 포함한 모든 유형의 경고를 제공합니다. 인디케이터 구매 후 연락주세요. 내 개인 거래 권장 사항과 훌륭한 보너스 지표를 무료로 공유합니다! 나는 당신에게 행복하고 유익한 거래를 기원합니다!
    우선적으로, 이 거래 도구는 전문적인 거래에 이상적인 비-다시 그리기 및 지연되지 않는 지표입니다.  온라인 강좌, 사용자 매뉴얼 및 데모. 스마트 가격 액션 컨셉트 인디케이터는 신규 및 경험 많은 트레이더 모두에게 매우 강력한 도구입니다. Inner Circle Trader Analysis 및 Smart Money Concepts Trading Strategies와 같은 고급 거래 아이디어를 결합하여 20가지 이상의 유용한 지표를 하나로 결합합니다. 이 인디케이터는 스마트 머니 컨셉트에 중점을 두어 대형 기관의 거래 방식을 제공하고 이동을 예측하는 데 도움을 줍니다.  특히 유동성 분석에 뛰어나 기관이 어떻게 거래하는지 이해하는 데 도움을 줍니다. 시장 트렌드를 예측하고 가격 변동을 신중하게 분석하는 데 탁월합니다. 귀하의 거래를 기관 전략에 맞추어 시장의 동향에 대해 더 정확한 예측을 할 수 있습니다. 이 인디케이터는 시장 구조를 분석하고 중요한 주문 블록을 식별하고 다양한
    Trend Punch
    Mohamed Hassan
    4.79 (24)
    This indicator is unstoppable when combined with our other indicator called  Support & Resistance . After purchase, send us a message and you will get it   for  FREE as a BONUS! Introducing Trend Punch , the revolutionary forex trend indicator that will transform the way you trade! Trend Punch is uniquely designed to provide precise buy and sell arrows during strong market trends, making your trading decisions clearer and more confident. Whether you're trading major currency pairs or exotic sym
    Atomic Analyst
    Issam Kassas
    5 (2)
    우선적으로 언급할 점은이 거래 지표가 다시 그리지 않고 지연되지 않으며 이를 통해 수동 및 로봇 거래 모두에 이상적이라는 점입니다. 사용자 매뉴얼: 설정, 입력 및 전략. Atomic Analyst는 가격의 강도와 모멘텀을 활용하여 시장에서 더 나은 이점을 찾는 PA Price Action Indicator입니다. 고급 필터를 장착하여 잡음과 거짓 신호를 제거하고 거래 잠재력을 높이는 데 도움이 됩니다. 복잡한 지표의 다중 레이어를 사용하여 Atomic Analyst는 차트를 스캔하고 복잡한 수학적 계산을 간단한 신호와 색상으로 변환하여 초보 트레이더가 이해하고 일관된 거래 결정을 내릴 수 있도록합니다. "Atomic Analyst"는 새로운 및 경험이 풍부한 트레이더를위한 종합적인 거래 솔루션입니다. 프리미엄 지표와 최고 수준의 기능을 하나의 거래 전략에 결합하여 모든 종류의 트레이더에 대한 다재다능한 선택지가되었습니다. 인트라데이 거래 및 스캘핑 전략 : 빠르고 정확한
    FX Levels MT4
    Daniel Stein
    FX 레벨 알아보기: 트레이딩 성공을 위한 궁극적인 지지 및 저항 지표 FX 레벨은 단순한 지지 및 저항 지표가 아니라 통화쌍, 지수, 주식, 원자재 등 모든 거래 기호에 대해 정확성, 신뢰성, 원활한 기능을 원하는 진지한 트레이더를 위한 게임 체인저입니다. 입증된 라이트하우스 방식을 기반으로 하고 동적 실시간 적응성으로 강화된 FX 레벨은 차트에 바로 시장 반전 포인트를 표시해 정확한 수익 목표를 설정하고 거래 진입을 최적화하는 데 적합합니다. 왜 FX 레벨을 선택해야 하나요? 스타인 인베스트먼트 팀은 브로커와 다양한 데이터 피드에 대한 다년간의 경험을 활용하여 정확성과 일관성이 뛰어난 FX 레벨을 만들었습니다. 여러 브로커에서 거의 100% 동일한 레벨을 제공하는 FX 레벨은 다른 지표가 제공할 수 없는 탁월한 수준의 신뢰성을 제공합니다. FX 레벨을 향상시키는 것은 세부 사항에 대한 우리의 약속이며, 기대치를 충족시킬뿐만 아니라지지 및 저항 분석에 접근하는 방식을 변화시
    Chart Patterns All in One
    Davit Beridze
    4.54 (13)
    구매 후 댓글을 남기시면 고품질의 인디케이터 4개를 보너스로 받으실 수 있습니다. Chart Patterns All-in-One 지표는 트레이더가 기술 분석에서 흔히 사용되는 다양한 차트 패턴을 시각화하는 데 도움을 줍니다. 이 지표는 잠재적인 시장 움직임을 식별하는 데 도움이 되지만, 수익성을 보장하지는 않습니다. 구매 전에 데모 모드에서 지표를 테스트하는 것이 좋습니다. 현재 할인 : "Chart Patterns All in One" 지표 50% 할인 중. 포함된 패턴 : 1-2-3 패턴 : 세 가지 주요 지점(고점 또는 저점)을 사용하여 시장 반전을 감지합니다. 매수 : 연속된 두 저점 이후, 이전 고점보다 낮은 고점이 발생할 때. 매도 : 연속된 두 고점 이후, 이전 저점보다 높은 저점이 발생할 때. 시각화 : 선과 화살표가 감지된 지점을 연결합니다. 더블 탑과 더블 바텀 : 가격이 두 개의 연속된 고점(더블 탑) 또는 저점(더블 바텀)을 형성할 때, 반전의 가능성을 나타냅니
    TPSpro RFI Levels
    Roman Podpora
    4.82 (22)
    지침         러시아   -        영어       표시기와 함께 사용하는 것이 좋습니다   .       -       TPSpro   트렌드 프로 -   MT4 버전         거래에서 핵심 요소는 거래 상품을 매수 또는 매도하기로 결정하는 구역 또는 수준입니다. 주요 업체가 시장에서 자신의 존재를 숨기려는 시도에도 불구하고, 그들은 필연적으로 흔적을 남깁니다. 우리의 과제는 이러한 흔적을 식별하고 올바르게 해석하는 방법을 배우는 것이었습니다. 주요 기능:: 판매자와 구매자를 위한 활성 영역을 표시합니다! 이 지표는 매수 및 매도를 위한 모든 올바른 초기 임펄스 레벨/존을 보여줍니다. 진입점 검색이 시작되는 이러한 레벨/존이 활성화되면 레벨의 색상이 바뀌고 특정 음영으로 채워집니다. 또한 상황을 보다 직관적으로 이해하기 위해 화살표가 나타납니다. 더 높은 시간대의 레벨/존 표시(MTF 모드) 더 높은 시간 간격을 사용하여 레벨/존을 표시하는 기능을 추가했습니다.
    Order Block Hunter
    Noha Mohamed Fathy Younes Badr
    5 (9)
    Order block hunter indicator is the best indicator for  hunt the order blocks that area where there has been a large concentration of limit orders waiting to be executed Order blocks are identified on a chart by observing previous price action and looking for areas where the price experienced significant movement or sudden changes in direction .This indicator does that for you by using very complicated codes and helps you to take the best areas To buy and sell because it make marks at the best a
    Trend Pulse
    Mohamed Hassan
    5 (5)
    Please contact me after purchase to immediately get your PDF strategy + documentation for Trend Pulse !  Introducing Trend Pulse , a unique and robust indicator capable of detecting bullish, bearish, and even ranging trends! Trend Pulse uses a special algorithm to filter out market noise with real precision. If the current symbol is moving sideways, Trend Pulse will send you a ranging signal, letting you know that it's not a good time to enter a trade. This excellent system makes Trend Pulse  on
    Scalper Inside PRO
    Alexey Minkov
    4.74 (57)
    An exclusive indicator that utilizes an innovative algorithm to swiftly and accurately determine the market trend. The indicator automatically calculates opening, closing, and profit levels, providing detailed trading statistics. With these features, you can choose the most appropriate trading instrument for the current market conditions. Additionally, you can easily integrate your own arrow indicators into Scalper Inside Pro to quickly evaluate their statistics and profitability. Scalper Inside
    TakePropips Donchian Trend Pro
    Eric John Pajarillaga Aldana
    4.44 (16)
    TakePropips Donchian Trend Pro   (MT4)는 Donchian 채널을 사용하여 추세의 방향을 자동으로 감지하고 진입 및 퇴장 거래 신호를 제공하는 강력하고 효과적인 도구입니다! 이 다기능 지표에는 추세 스캐너, 거래 신호, 통계 패널, 스크리너, 거래 세션 및 경고 내역 대시보드가 포함됩니다. 거래 신호를 제공하고 차트 분석 시간을 절약하도록 설계되었습니다! 다음 블로그 게시물에서 사용자 설명서 및 설치 가이드를 다운로드할 수 있습니다.   https://www.mql5.com/en/blogs/post/751368 오늘 50% 할인을 받으세요! 가격이 $98에서 $49로 인하되었습니다! 전략 테스터에서 이 지표를 테스트할 수 있습니다(비주얼 모드 활성화).  자세한 내용은 설명 아래에 비디오 자습서도 제공됩니다. 질문이 있거나 도움이 필요하면 저에게 연락하십시오. TakePropips Donchian Trend Pro 지표는 모든 Forex 쌍, 금속
    Stratos Pali
    Michela Russo
    5 (1)
    Stratos Pali Indicator   is a revolutionary tool designed to enhance your trading strategy by accurately identifying market trends. This sophisticated indicator uses a unique algorithm to generate a complete histogram, which records when the trend is Long or Short. When a trend reversal occurs, an arrow appears, indicating the new direction of the trend. Important Information Revealed Leave a review and contact me via mql5 message to receive My Top 5 set files for Stratos Pali at no cost! D
    Advanced Currency IMPULSE with ALERT
    Bernhard Schweigert
    4.9 (483)
    현재 31% 할인!! 초보자 또는 전문가 트레이더를 위한 최고의 솔루션! 이 지표는 우리가 독점 기능과 비밀 공식을 통합했기 때문에 독특하고 고품질이며 저렴한 거래 도구입니다. 단 하나의 차트로 28개 통화 쌍 모두에 대한 경고를 제공합니다. 새로운 추세 또는 스캘핑 기회의 정확한 트리거 포인트를 정확히 찾아낼 수 있기 때문에 거래가 어떻게 개선될지 상상해 보십시오! 새로운 기본 알고리즘을 기반으로 구축되어 잠재적인 거래를 훨씬 더 쉽게 식별하고 확인할 수 있습니다. 이는 통화의 강세 또는 약세가 가속되는지 여부를 그래픽으로 표시하고 가속 속도를 측정하기 때문입니다. 자동차의 속도계처럼 생각하면 됩니다. 가속화할 때 Forex 시장에서 동일한 일이 분명히 더 빠르게 발생합니다. 즉, 반대 방향으로 가속화되는 통화를 페어링하면 잠재적으로 수익성 있는 거래를 식별한 것입니다. 통화 모멘텀의 수직선과 화살표가 거래를 안내합니다! 역동적인 Market Fibonacci 23
    Graf Mason
    Alexandr Lapin
    5 (9)
    Graf Mason is a tool that will make you a professional analyst! The method of determining wave movements using inclined channels qualitatively conveys the schematics of the movement of any instrument, showing not only possible reversals in the market, but also the goals of further movements!Destroys the myth that the market is alive , clearly showing the schematics of movements from one range to another! A professional tool, suitable for the medium term with the definition of the current trend!
    제작자의 제품 더 보기
    Auto Order Block with break of structure based on ICT and Smart Money Concepts (SMC) Futures Break of Structure ( BoS )             Order block ( OB )            Higher time frame Order block / Point of Interest ( POI )    shown on current chart           Fair value Gap ( FVG ) / Imbalance   -  MTF      ( Multi Time Frame )    HH/LL/HL/LH  -  MTF      ( Multi Time Frame )  Choch  MTF      ( Multi Time Frame )  Volume Imbalance     ,  MTF          vIMB Gap’s Power of 3 Equal High
    Quarterly Cycles
    Barend Paul Stander
    5 (1)
    Quarterly Cycles Quarterly Cycles is based on the Quarterly Theory developed by Daye (  traderdaye on X ). This is an aid to the user to find Cycles and it is NOT automatic detected, user can select AMDX or XAMD  in each Cycle and it will be visually drawn on the chart.  Quarterly Cycles:   Yearly, Monthly, Weekly, Daily, 6 Hour (90 minutes) –  Yearly Cycle : The year is divided in four sections of three months each Q1 - January, February, March Q2 - April, May, June Q3 - July, August, Sept
    CRT Candle Range Theory
    Barend Paul Stander
    Candle Range Theory - CRT Mark Candle Range Theory - CRT  bars on the chart. Options: choose between   2 bar CRT or  CRT that include inside bars Show higher time frame CRT on lower time frame chart show current time frame CRT on chart with higher time frame CRT Alert when new CRT has formed Show / Hide Labels Button Menu to select Options for more information on using Candle Range Theory - CRT look on X for @Romeotpt @SpeculatorFL
    EaGo Market Structure
    Barend Paul Stander
    The EaGo Market Structure Indicator is a powerful tool designed to display market structure on the current chart, with buffers available for seamless integration into your trading system - Expert Advisor (EA)   Key Features: Identifies key market structure points including: Higher High Lower High Higher Low Lower Low Break of Structure (BoS) Bullish Break of Structure (BoS) Bearish Change of Character (ChoCH) Bullish Change of Character (ChoCH) Bearish   All of these data points are accessible
    EaGo Liquidity
    Barend Paul Stander
    The EaGo Liquidity Indicator is a powerful tool designed to display Daily Liquidity  on the current chart, with buffers available for seamless integration into your trading system - Expert Advisor (EA)   Key Features: Identifies key market structure points including: Previous Day High Previous Day Low Previous Week High Previous Week Low Previous Month High Previous Month Low Daily Liquidity High Levels  * 7 Daily Liquidity Low Levels  * 7   All of these data points are accessible through bu
    DR IDR Pro
    Barend Paul Stander
    3 (2)
    Defining Range ( DR ) and Implied Defining Range ( IDR  ) indicator Pro with added features from free version Show DR and IDR ranges Sessions on the chart for   RDR     Regular defining range (New York Session) ADR    After defining range (Asian session) ODR     Outside defining range (London Session) Buttons on chart to enable / disable : Show  Imbalance ( IMB ) Show Volume Imbalance ( VIB ) Show  Gap's between open and close Show  Standard Deviation ( SD ) Show last 3 Sessions
    Equal Highs and Lows mt4
    Barend Paul Stander
    5 (4)
    Equal Highs and Lows Indicator Find and Mark Equal Highs and Lows on chart of Selected Multi Time frames. Options: set min and max bars between Equal High's / Low's bars set max points difference between High's / Low's  ( Sensitivity  ) Select time frames by buttons on chart Select / Filter only High's or Low's by a button Extend Equal High's / Low's line forward for chart reference Manual  MT4 version MT5 version Other Indicators
    Quarterly Cycles mt4
    Barend Paul Stander
    Quarterly Cycles Quarterly Cycles is based on the Quarterly Theory developed by Daye (  traderdaye on X ) T his is an aid to the user to find Cycles and it is NOT automatic detected, user can select AMDX or XAMD in each Cycle and it will be visually draw on the chart. Quarterly Cycles:   Yearly, Monthly, Weekly, Daily, 6 Hour (90 minutes) Yearly Cycle: The year is divided in four sections of three months each Q1 - January, February, March Q2 - April, May, June Q3 - July, August, September Q4
    Imbalance MTF mt4
    Barend Paul Stander
    5 (1)
    Imbalance / FVG  MTF Mark Imbalance on chart of  Selected Multi Time frames. Trend is Manually set to filter signals in the chosen direction by a button on the chart. . Futures Auto Mark Imbalance / FVG on chart on selected time frames Select time frames by buttons on chart Popup Alert, Push Notification or email when New Imbalance Form Popup Alert, Push Notification or email when Imbalance is Taken out Select Alert Mode to be a single or multiple Imbalance ( OR / AND option ) when Imbalan
    Imbalance MTF mt5
    Barend Paul Stander
    Imbalance / FVG MTF Mark Imbalance on chart of  Selected Multi Time frames. Trend is Manually set to filter signals in the chosen direction by a button on the chart. . Futures Auto Mark Imbalance / FVG on chart on selected time frames Select time frames by buttons on chart Popup Alert, Push Notification or email when New Imbalance Form Popup Alert, Push Notification or email when Imbalance is Taken out Select Alert Mode to be a single or multiple Imbalance ( OR / AND option )  when Imbalan
    DR IDR Pro mt4
    Barend Paul Stander
    3 (2)
    Defining Range ( DR ) and Implied Defining Range ( IDR  ) indicator Pro with added features from free version Show DR and IDR ranges Sessions on the chart for   RDR     Regular defining range (New York Session) ADR    After defining range (Asian session) ODR     Outside defining range (London Session) Buttons on chart to enable / disable : Show  Imbalance ( IMB ) Show Volume Imbalance ( VIB ) Show  Gap's between open and close Show  Standard Deviation ( SD ) Show last 3 Sessions
    BPS Break of Structure
    Barend Paul Stander
    BPS BoS - Break of Structure BoS - Fractal mode , MTF BoS - Zigzag mode , MTF Show HH and LL Alerts - Popup , Push notification and eMail Option to create screenshot on alert Enable / Disable Indicator with a button on chart to select options Choose corner of button location It is not a system but a indicator to help identify break of structure points MT5 version here :  https://www.mql5.com/en/market/product/84734?source=Site+Profile+Seller Other Indicators : https://www.mql5.
    ICT Kill zone and Macros Indicator mark and display the following zone times on the chart: Kill zones   Kill zone Forex Asian London Open New York Open London Close Central Bank Dealing range Kill zone Indices Asian London Open New York AM New York Lunch New York PM Power Hour Macros London 1 London 2 New York Am 1 New York AM 2 New York Lunch New York PM 1 New York PM 2 Silver bullet London Open New York AM New York PM Sessions Asian London New York Chart The display of  Kill zone ,
    BPS Break of Structure MT5
    Barend Paul Stander
    5 (1)
    BPS BoS - Break of Structure BoS - Fractal mode , MTF BoS - Zigzag mode , MTF Show HH and LL Alerts - Popup , Push notification and eMail Option to create screenshot on alert Enable / Disable Indicator with a button on chart to select options Choose corner of button location It is not a system but a indicator to help identify break of structure points MT 4 Version : https://www.mql5.com/en/market/product/78420?source=Site+Profile+Seller Other Indicators : https://www.mql5.com/en/use
    Equal Highs and Lows
    Barend Paul Stander
    Equal Highs and Lows Indicator Find and Mark Equal Highs and Lows on chart of Selected Multi Time frames. Options: set min and max bars between Equal High's / Low's bars set max points difference between High's / Low's  ( Sensitivity  ) Select time frames by buttons on chart Select / Filter only High's or Low's by a button Extend Equal High's / Low's line forward for chart reference Manual  MT4 version MT5 version Other Indicators
    ICT Kill zone and Macros Indicator mark and display the following zone times on the chart: Kill zones   Kill zone Forex Asian London Open New York Open London Close Central Bank Dealing range Kill zone Indices Asian London Open New York AM New York Lunch New York PM Power Hour Macros London 1 London 2 New York Am 1 New York AM 2 New York Lunch New York PM 1 New York PM 2 Silver bullet London Open New York AM New York PM Sessions Asian London New York Chart The display of  Kill zone ,
    Support and Resistance X3 calculate and show Support and Resistance in 3 different modes and 2 different Styles. Modes: ICT High / Low Mode Fractal Mode ZigZag mode Styles: Dot Line Options: Button to choose between  3 Modes Button to choose between 2  Styles Alert when Support and Resistance touched Alert when Support and Resistance break Button to hide / show Menu Button take and save screenshot of current chart
    필터:
    Komitet
    20
    Komitet 2024.06.24 09:31 
     

    Индикатор супер! Мне нравится!

    lauro1956
    5242
    lauro1956 2024.06.21 10:51 
     

    Really good

    Sunny Chukwubuikem Okoli
    157
    Sunny Chukwubuikem Okoli 2024.05.30 21:52 
     

    It used to work, but now it's no longer usable as it doesn't update anymore on a live chart. With lot's of Not-So-Useful features it's now impossible for a low processor computer to even run it. Waste of money

    neirss
    30
    neirss 2024.05.27 17:26 
     

    Волшебный индикатор. Разработчику огромная благодарность. Удачи в новых разработках.

    alinafar
    62
    alinafar 2024.05.21 19:14 
     

    It is a good tool and better features should be added such as choch fibonacci. It is used in general.

    zakir1970
    55
    zakir1970 2023.12.02 17:13 
     

    Day by day he's improving the indicator, very impressive! must say, did a good job and keep going! Another good part of this indicator is not too much unnecessary options which can make people super confused. now my request is please add a new FVG alert when it's formed. Thank for your hard work.

    Jason Pook
    238
    Jason Pook 2023.09.09 20:36 
     

    If you trade ICT concepts this is the best indicator for the MT4 platform and I've tried a few. The author has recently made several updates to add new features that really enhance the use and profitability. Excellent work..

    Thank you for all the recent additions to the indicator - this is the best MT4 ICT indicator by a mile..

    AlphaTraderZen
    305
    AlphaTraderZen 2023.07.11 06:30 
     

    Good Indicator... One suggestion .. Can you put arrow signal when price touches the Orderblocks? This will be a great update.. Thank u..

    Great Update..... Can u please add Signal Buffer on OB Touch? Planning to buy this on MT5 as well.. Waiting for the signal buffer update... Thank u

    sylvain974
    24
    sylvain974 2023.06.22 09:58 
     

    L'indicateur est bien mais il bloque sur mon mt4, ne se mette pas à jour et je ne peux pas le mettre en automatique. Et il manque pas mal de chose sur votre indicateur. les wick, EQL, EQH, CHOCH et encore il manque beaucoup beaucoup de choses à ajouter sur cette indicateur.

    Avinash Reddy Kummetha
    1125
    Avinash Reddy Kummetha 2023.03.05 10:54 
     

    Do not buy it bad customer service. Don’t care about existing customer and bad product design. MTF should have added in the same product, instead new product released, why would I buy exact same product again?? Why won’t you enhance this product instead and also resolve issues with this product.

    En Shahdi
    185
    En Shahdi 2023.01.16 13:35 
     

    great indi!. Make your life easier.

    Jonathan Barack
    23
    Jonathan Barack 2023.01.10 17:05 
     

    사용자가 평가에 대한 코멘트를 남기지 않았습니다

    2140097491
    20
    2140097491 2022.09.21 09:05 
     

    It's very good for what it does. But I found a major issue. When you open multiple tabs of the same pair you are trading, when the POI button is turned off, all POI order blocks across all the tabs will be turned off. This is a major issue, please fix.

    MacBidouille
    34
    MacBidouille 2022.08.23 15:41 
     

    사용자가 평가에 대한 코멘트를 남기지 않았습니다

    Manase Shovaleka
    55
    Manase Shovaleka 2022.06.19 19:43 
     

    The best investment of my life. This indicator is unbelievable. I still can't believe it simplified my trading 5 years into the future. Keep up with the good work I can't thank u enough.

    RealiRay
    936
    RealiRay 2022.04.22 00:53 
     

    one of the best indicator I've used! only for those who are using smart money concepts.

    Tony Born
    366
    Tony Born 2022.04.21 07:17 
     

    I love this indicator in combo with the dashboard, made a big difference for me. An easy 5 stars.

    whun450
    89
    whun450 2022.04.21 05:12 
     

    Best indicator I have ever spent money on. I watch order blocks and trend on 4 hour chart and I trade off 1 hour and 15 minute POI without changing charts. The indicator is extremely accurate and I promise you that if you trade market structure, you will be amazed at what you get for $60.

    shola.abitogun
    121
    shola.abitogun 2022.03.09 04:53 
     

    Great indicator.

    Mr.
    421
    Mr. 2022.02.28 16:18 
     

    awesome indicator very promising. I hope there will be a toggleable button for all the writings so that the chart will be clean only the supply and demand plus the lines of BOS can be seen.

    12
    리뷰 답변
    버전 5.8 2024.12.11

    fix vol imbalance
    버전 5.7 2024.06.11
    bug fix
    버전 5.6 2024.06.11
    add option to change Button colors
    버전 5.5 2024.06.11
    POI alert fix
    버전 5.4 2024.06.07
    add bar count error checks
    버전 5.3 2024.06.05

    add HH , LL , HL , LH

    add HTF Choch / HTF BOS

    add Power of 3

    add manual Fib's functions
    버전 5.1 2024.05.16

    add a button to Show / Hide Trade Levels

    add FVG poi / higher time-frame option
    버전 4.9 2024.02.09

    add button to move or Hide Menu
    버전 4.8 2024.01.27

    add error checking
    vol imbalance extend past bar 0
    버전 4.7 2023.12.19
    bug fixes
    버전 4.6 2023.12.14

    Add button to take and save a screenshot

    Add FVG formed alert
    버전 4.5 2023.11.25

    Upgrade Volume Imbalance to MTF
    Upgrade EQ H/L to MTF
    some fixes
    버전 4.4 2023.10.30
    fix POI error
    버전 4.3 2023.10.29

    new Menu style buttons
    버전 4.2 2023.10.27

    add Weekly and daily NY day open to liquidity

    add Equal_HL alerts

    add a option to set imbalance button to show current only

    add option to show old FVG/ Imbalance up to takeout bars
    버전 4.1 2023.10.13

    add date number to session labels

    minor fixes
    버전 4.0 2023.10.06
    Fix Menu Location option
    버전 3.9 2023.10.06

    add alerts when Liquidity line is touched

    add MTF options to FVG / Imbalance button

    add options to mark sessions time , kill zone times and silver bullet times
    버전 3.8 2023.09.19

    add - select Liquidity mode by button
    버전 3.7 2023.09.15

    add option to Mark POI touches

    add option to show Liquidity levels on the side of chart
    버전 3.6 2023.09.13

    fix OB price labels spacing

    add option to hide menu
    버전 3.5 2023.09.09
    minor bug fix
    버전 3.4 2023.09.08
    Add Liquidity line Labels
    버전 3.3 2023.09.07
    Added :

    - button to turn BOS on/off

    - Vol Imbalance

    - Mark Gap's

    - Show Equal High / Lows

    - Show Liquidity lines :

    PMH - Previous Month High
    PWH - Previous Week High
    PDH - Previous Day High
    HOD - High Of Day
    HOW - High Of Week


    PML - Previous Month Low
    PWL - Previous Week Low
    PDL - Previous Day Low
    LOD - Low Of Day
    LOW - Low Of Week
    버전 3.2 2023.07.16
    OB touch markers
    버전 3.1 2023.05.03
    Show RR improvements
    버전 3.0 2023.03.06
    add new OB formed alert
    버전 2.9 2022.05.30
    Add trigger alert once per OB with setting : Alert_on_OB_First_touch_only = true
    버전 2.8 2022.03.17

    add FILTER OB can touch BoS line
    버전 2.7 2022.03.12
    Add OB Size
    버전 2.6 2022.01.10
    Change POI time frame from button
    버전 2.5 2022.01.06
    Add option to hide buttons
    버전 2.4 2021.12.18
    Add Imbalance Alerts
    버전 2.3 2021.12.13
    some bug fixes
    버전 2.2 2021.11.19

    add BoS alerts

    limit alerts to X minutes
    버전 2.1 2021.11.11
    Add Price levels to Alerts
    Show OB price levels next to Order block
    버전 2.0 2021.10.24
    Added Higher time frame POI
    버전 1.6 2021.10.10
    Push Notifications Added
    버전 1.5 2021.10.05
    OB can be set as Solid or Outline
    버전 1.4 2021.09.29
    Add stability_check to indicator
    버전 1.3 2021.09.21
    Added function to show Imbalances
    버전 1.2 2021.08.26
    Upgrade to version 1.2