MACD Intraday Trend PRO
MACD Intraday Trend PROは、1960年代にGeraldAppelによって作成された元のMACDを応用して開発されたインジケーターです。
長年の取引を通じて、MACDのパラメーターをフィボナッチの比率で変更することにより、トレンドの動きの連続性をより適切に表現できることが観察され、価格トレンドの開始と終了をより効率的に検出できるようになりました。
価格トレンドの検出が効率的であるため、トップとボトムの相違を非常に明確に識別し、取引機会をより有効に活用することもできます。
特徴
- インディケータMACD日中トレンドPROは、任意の通貨ペア、任意の時間枠、および練行足チャートで機能します。
- 5つのモードを選択することにより、トレンド検出速度を設定することができます。
- 最速
- 速い
- 正常
- スロー
- 最も遅い
資力
- 6つの構成可能なアラートがあります。
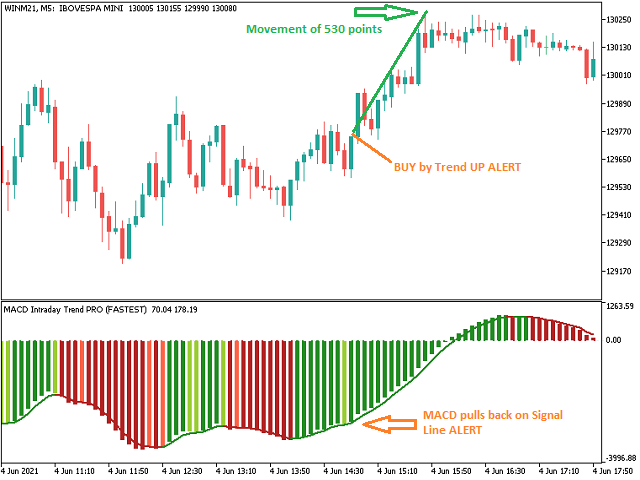
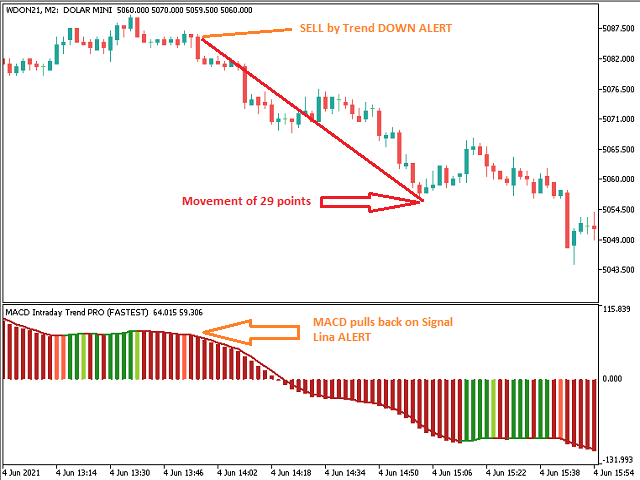
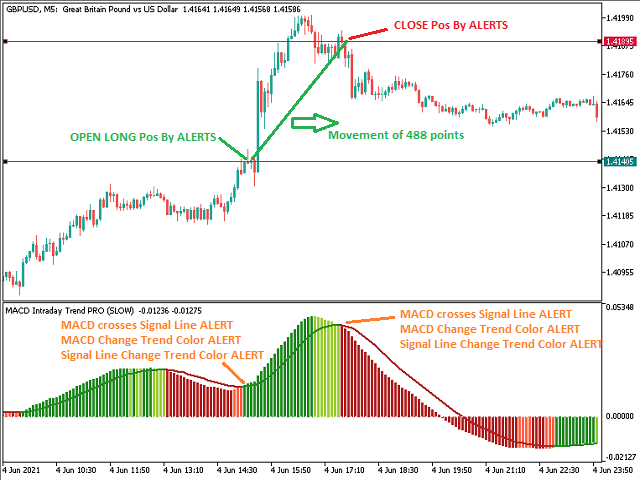
- MACDがシグナルラインを引き戻す
- MACDが信号線を横切る
- MACDがレベル0を超える
- 信号線がレベル0を超えています
- MACDはトレンドカラーを変更します
- 信号線変更トレンドカラー
- アラートごとに、以下を構成できます。
- 現れる
- 音(13種類の音があります。)
- スマートフォン通知
- ポップアップとサウンド
- ポップアップとスマートフォンの通知
- 音とスマートフォンの通知
- ポップアップ、サウンド、スマートフォンの通知
エキスパートアドバイザーまたは他の指標との統合
- アクセスおよびエキスパートアドバイザーやその他のインジケーターとの統合に使用できるバッファーは8つあり、アラートがオフになっていてもいっぱいになります。次のとおりです。
- バッファーID5:MACD値
- バッファID6:信号線の値
- バッファID12:アラート1
- バッファID13:アラート2
- バッファID14:アラート3
- バッファID15:アラート4
- バッファID16:アラート5
- バッファID17:アラート6
- 6つのアラートを参照するバッファーには、次の値を含めることができます。
- 下降トレンド:(-1)
- 未定義の傾向:(0)
- 上昇トレンド:(+ 1)
それでも質問がある場合は、ダイレクトメッセージで私に連絡してください:https://www.mql5.com/jp/users/robsjunqueira/


Great indicator