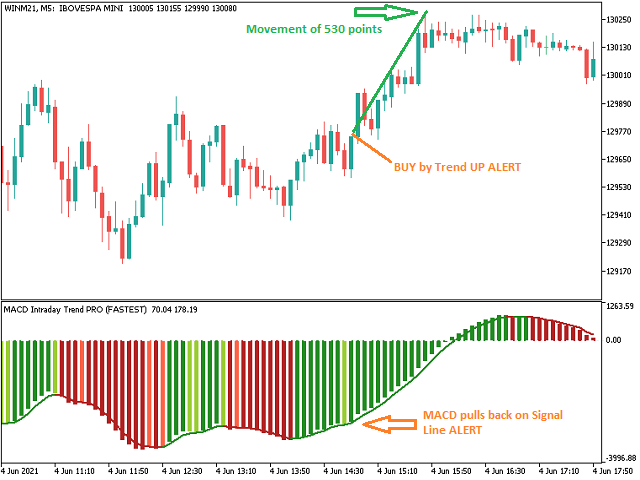
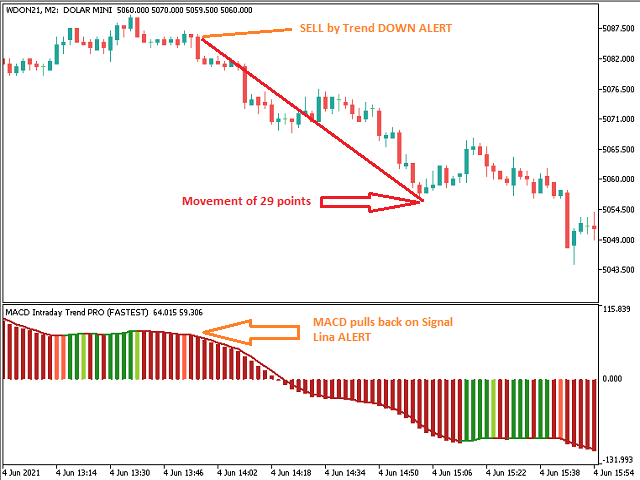
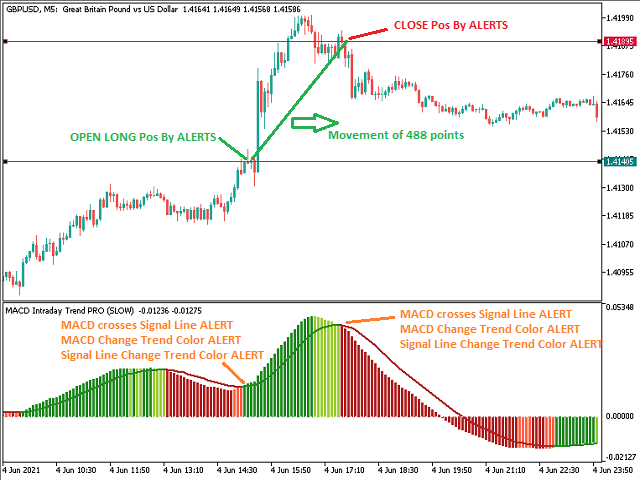
MACD Intraday Trend PRO
MACD Intraday Trend PRO는 1960년대 Gerald Appel이 만든 원본 MACD를 개조하여 개발한 지표입니다.
수년간의 거래를 통해 MACD의 매개변수를 피보나치 비율로 변경함으로써 추세 움직임의 연속성을 더 잘 표현함으로써 가격 추세의 시작과 끝을 보다 효율적으로 감지할 수 있다는 것이 관찰되었습니다.
가격 추세를 감지하는 효율성으로 인해 상단과 하단의 차이를 매우 명확하게 식별하여 거래 기회를 더 잘 활용할 수도 있습니다.
특징
- 표시기 MACD Intraday Trend PRO는 모든 통화 쌍, 모든 시간대 및 Renko 차트에서 작동합니다.
- 5가지 모드를 선택하여 추세 감지 속도를 설정할 수 있습니다.
- 가장 빠른
- 빠른
- 정상
- 느린
- 가장 느림
자원
- 6개의 구성 가능한 경고가 있습니다.
- MACD는 신호 라인에서 후퇴
- MACD가 신호선을 넘다
- MACD는 레벨 0을 교차
- 신호선이 레벨 0을 넘습니다.
- MACD 변경 트렌드 색상
- 신호선 변경 TREND 색상
- 각 경고에 대해 다음을 구성할 수 있습니다.
- 팝업
- 소리(13가지의 소리가 있습니다.)
- 스마트폰 알림
- 팝업 및 사운드
- 팝업 및 스마트폰 알림
- 소리 및 스마트폰 알림
- 팝업, 소리 및 스마트폰 알림
Expert Advisors 또는 기타 지표와의 통합
- 전문가 조언자 또는 기타 표시기와의 액세스 및 통합에 사용할 수 있는 8개의 버퍼가 있으며 경고가 꺼진 상태에서도 채워집니다.
- 버퍼 ID 5: MACD 값
- 버퍼 ID 6: 신호 라인 값
- 버퍼 ID 12: 경고 1
- 버퍼 ID 13: 경고 2
- 버퍼 ID 14: 경고 3
- 버퍼 ID 15: 경고 4
- 버퍼 ID 16: 경고 5
- 버퍼 ID 17: 경고 6
- 6개의 경고를 참조하는 버퍼에는 다음 값이 포함될 수 있습니다.
- 하락 추세: (-1)
- 정의되지 않은 추세: (0)
- 상승 추세: (+1)


Great indicator