• 概要
  • レビュー
  • コメント
  • 最新情報

Candle Size

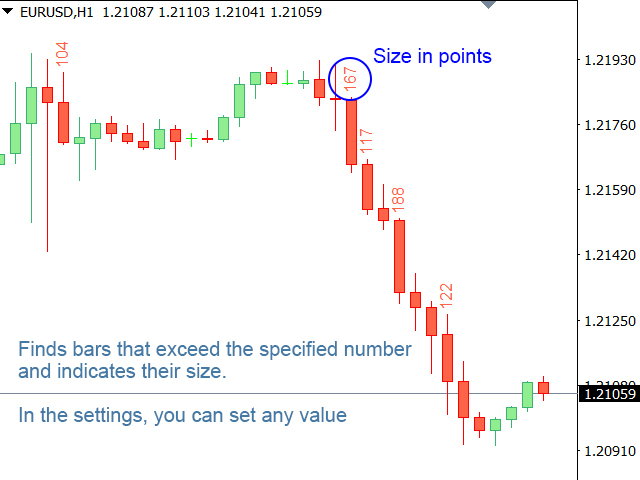
Finds bars that exceed the specified size


My #1 Utility: includes 65+ functions  |  Contact me if you have any questions

2 operating modes:

  1. Real body: the difference between the open and close prices will be used;
  2. Extremes: the difference between the maximum and minimum prices will be used;


This Indicator:

  • Convenient for filter patterns in a period of low volatility;
  • Indicates the beginning of a trend;
  • Helps to see the most significant bars;
  • Can be used when trading binary options;

Input settings:

  • Bar Size: Set the size in points: the bars that exceed or equal this value will be indicated.
  • Real Bodies: 1) if truethe difference (Open-Close) will be used; 2) if false: the difference (High-Low) will be used;
  • Alert: Enable / disable notifications about the formation of new bars with the desired size;
  • Font Size: font size to indicate the size;
  • Up Color:  font color for bullish bars;
  • BearColor: font color for bear bars;
おすすめのプロダクト
Was: $249  Now: $99   Market Profile defines a number of day types that can help the trader to determine market behaviour. A key feature is the Value Area, representing the range of price action where 70% of trading took place. Understanding the Value Area can give traders valuable insight into market direction and establish the higher odds trade. It is an excellent addition to any system you may be using. Blahtech Limited presents their Market Profile indicator for the MetaTrader community. Ins
Trade with Gann on your side!! MASTER CIRCLE 360 CIRCLE CHART, originally created by Gann admitted that this is “The Mother of all charts”. It is one of the last studies that this great trader left for us. The numeric tab le is apparently quite simple like all the tables and is based on square numbers, the SQUARE OF 12 and is by evolution, one of the most important square numbers. Here we can find CYCLE, PRICE AND TIME thanks to angles and grades, to show past and future support and resistance.
TWO PAIRS SQUARE HEDGE METER INDICATOR Try this brilliant 2 pairs square indicator It draws a square wave of the relation between your two inputs symbols when square wave indicates -1 then it is very great opportunity to SELL pair1 and BUY Pair2 when square wave indicates +1 then it is very great opportunity to BUY pair1 and SELL Pair2 the inputs are : 2 pairs of symbols         then index value : i use 20 for M30 charts ( you can try other values : 40/50 for M15 , : 30 for M30 , : 10 for H1 ,
The Point61 indicator is the result of many years of monitoring of price behavior of currency pairs and metals. It is not a secret, that in times of uncertainty, traders are looking for possible levels of support and resistance - the point, where price should stop its movement. There are 2 possible scenarios at these points: 1. Reverse (correction) to the opposite direction; 2. Breakthrough to continue movement. Very often these points are used to set stop orders - TakeProfit or
VR Cub
Vladimir Pastushak
VR Cub は、質の高いエントリーポイントを獲得するためのインジケーターです。このインジケーターは、数学的計算を容易にし、ポジションへのエントリーポイントの検索を簡素化するために開発されました。このインジケーターが作成されたトレーディング戦略は、長年にわたってその有効性が証明されてきました。取引戦略のシンプルさはその大きな利点であり、初心者のトレーダーでもうまく取引することができます。 VR Cub はポジション開始ポイントとテイクプロフィットとストップロスのターゲットレベルを計算し、効率と使いやすさを大幅に向上させます。取引の簡単なルールを理解するには、以下の戦略を使用した取引のスクリーンショットを見てください。 設定、設定ファイル、デモ版、説明書、問題解決方法は、以下から入手できます。 [ブログ] レビューを読んだり書いたりすることができます。 [リンク] のバージョン [MetaTrader 5] エントリーポイントの計算ルール ポジションをオープンする エントリーポイントを計算するには、VR Cub ツールを最後の高値から最後の安値までストレッチする必要があります。
これは、キャンドルの終値を予測する指標です。 このインジケータは、主にD1チャートでの使用を目的としていますが. この指標は、従来の外国為替取引とバイナリオプション取引の両方に適しています。 インジケーターは、スタンドアロンのトレーディングシステムとして使用することも、既存のトレーディングシステムへの追加として機能させることもできます。 このインジケーターは、現在のキャンドルを分析し、キャンドル自体の内部の特定の強度係数と、前のキャンドルのパラメーターを計算します。 したがって、この指標は、市場の動きのさらなる方向性と現在のキャンドルの終値を予測します。 この方法のおかげで、この指標は、短期の日中取引だけでなく、中期および長期の取引にも適しています。 インジケーターを使用すると、市場の状況の分析中にインジケーターが生成する潜在的な信号の数を設定できます。 インジケーターの設定には、このための特別なパラメーターがあります。 また、インジケーターは、チャート上のメッセージの形式で、電子メールで、およびPUSH通知の形式で、新しい信号について通知することができます。 購入後は必ず私に書いて
This multicurrency indicator is the Lite version of the Cosmic Diviner Reversal Zone Pro indicator. The indicator is based on original formulas for analyzing the volatility and price movement strength. This allows determining the overbought and oversold states of instruments with great flexibility, as well as setting custom levels for opening buy or sell orders when the overbought or oversold values of the instruments reach a user-defined percentage. A huge advantage of Reversal Zone Lite is the
インディケータは現在のクオートを作成し、これを過去のものと比較して、これに基づいて価格変動予測を行います。インジケータには、目的の日付にすばやく移動するためのテキスト フィールドがあります。 オプション: シンボル - インジケーターが表示するシンボルの選択; SymbolPeriod - 指標がデータを取る期間の選択; IndicatorColor - インジケータの色; HorisontalShift - 指定されたバー数だけインディケータによって描画されたクオートのシフト; Inverse - true は引用符を逆にします。false - 元のビュー。 ChartVerticalShiftStep - チャートを垂直方向にシフトします (キーボードの上下矢印)。 次は日付を入力できるテキストフィールドの設定で、「Enter」を押すとすぐにジャンプできます。
EZT Trade History This is a great tool to analyze past trades or follow current ongoing trades, especially when you using an EA to manage your transactions. You will see the exact candle where the trade was opened and closed. Collapsible floating panel on the chart, free to move anywhere with your mouse. When you using multiple EA’s with different magic numbers, you have 5 options to separate those trades, so you will know which EA opened specific transactions. You can set the day limits how fa
Scalper indicator designed for accurate entry into trade transactions. Designed for intraday and medium-term trading on any instrument. The indicator does not redraw and does not lag. There is a possibility of visual and sound notification of the appearance of a signal to enter. The indicator also sends signals to digital buffers, which makes it possible to create automated trading systems based on it.
Trend indicator with calculation of dynamic levels and signaling their intersection. Description of input parameters: StepTF = true; - Calculation of the indicator by closing the bar (true) or by each tick (false) BarsCount = 300; - Number of settlement bars Price = PRICE_CLOSE; - Type of price used TimeFrame = PERIOD_CURRENT; - Estimated timeframe TrendPeriod = 9; - Trend calculation period TrendDeviations = 4.9; - coefficient of deviation PeriodTrendSmooth = 1; - Trend smoothi
The Gann Box (or Gann Square) is a market analysis method based on the "Mathematical formula for market predictions" article by W.D. Gann. This indicator can plot three models of Squares: 90, 52(104), 144. There are six variants of grids and two variants of arcs. You can plot multiple squares on one chart simultaneously. Parameters Square — selection of a square model: 90 — square of 90 (or square of nine); 52 (104) — square of 52 (or 104); 144 — universal square of 144; 144 (full) — "full"
Arrow X
Pieter Gerhardus Van Zyl
エントリを支援する非再描画矢印インジケーター トレンド市場ではより良いシグナルが発せられる 現在のバーが閉じるまで待ち、矢印を所定の位置に固定します 混乱するような設定をせずにチャートをロードするだけです 矢印の色とサイズを調整できます このインジケーターは、外国為替、暗号通貨など、あらゆるペアまたはあらゆる時間枠で使用できます。 より大きな時間枠のトレンドに合わせて取引する方が良い -------------------------------------------------- ---------------------------------------------------------------
Matrix is a Forex arrow indicator. Displays signals simply and clearly! The arrows show the direction of the transaction, and are colored accordingly, which can be seen in the screenshots. As you can see, trading with such an indicator is easy. I waited for an arrow to appear in the desired direction - I opened a deal. An arrow formed in the opposite direction - closed the deal. The indicator also displays the lines with the help of which the arrow signals are formed, taking into account the int
VN Trade Panel II
Vyacheslav Nekipelov
4 (1)
The new version of the trading panel, which now has the ability to separately close Buy and Sell orders, display targets for all orders on the chart, as well as the ability to use the panel to trade with brokers working on the FIFO rule. Also, the new version adds option buttons for separate management of open orders. It has a convenient visualized interface and intuitive control without a lot of additional tabs to which traders have to be distracted and switch their attention. Thanks to this
設定した時差で時間ラインを表示します。(30分単位の時差には対応していません。) また、100.000、.100、.200のようにキリの良い価格で価格ラインを表示します。 標準ではMT4による時間と価格でグリッドラインが表示されていますが、ブローカーの時間となり価格とともに中途半端な位置で表示されるので、非常に分かりにくいものとなっています。 それを非表示にし ユーザーが設定した時差と価格の分かりやすい位置でグリッドラインを表示します 。他のEAや裁量取引に負荷をかけないよう、軽快に動作するよう実装しております。 時間ラインは未来の時間も表示 します。事前に節目となる時間の把握ができます。(土日の時間軸は表示されません。) アジア、EU、USの時間帯を色付きで表示できます。 マーケットの開始時刻や、イベントの時間など特定の時間をSpecial Timeとしてラインを表示することができます。 パラメーター説明 ・Time offset:  MT4上の時間に対する時差を設定します。 ・Bars time range:  時間ラインを表示する範囲をバーの本数で設定します。 ・P
Volume Profile Indicator for MT4 Gain a trading edge with the "Volume Profile" indicator for MetaTrader 4 (MT4). This advanced technical analysis tool allows you to precisely identify key support and resistance levels based on transaction volume. Easily visualize market areas of high interest, where trading volumes are highest, and use this information to make more informed trading decisions. Key Features: Clear and detailed visualization : The indicator displays volume histograms directly on th
We present you the indicator "Candle closing counter", which will become your indispensable assistant in the world of trading. That’s why knowing when the candle will close can help: If you like to trade using candle patterns, you will know when the candle will be closed. This indicator will allow you to check if a known pattern has formed and if there is a possibility of trading. The indicator will help you to prepare for market opening and market closure. You can set a timer to create a p
Noize Absorption Index - is the manual trading system that measures the difference of pressure between bears forces and bulls forces. Green line - is a noize free index that showing curent situation. Zero value of index shows totally choppy/flat market.Values above zero level shows how powerfull bullish wave is and values below zero measures bearish forces.Up arrow appears on bearish market when it's ready to reverse, dn arrow appears on weak bullish market, as a result of reverse expectation. S
This indicator is a conventional analytical tool for tick volumes changes. It calculates tick volumes for buys and sells separately, and their delta on every bar, and displays volumes by price clusters (cells) within a specified bar (usually the latest one). The algorithm used internally is the same as in the indicator VolumeDelta , but results are shown as cumulative volume delta bars (candlesticks). Analogous indicator for MetaTrader 5 exists - VolumeDeltaBars . This is a limited substitution
This is a trend indicator without redrawing Developed instead of the binary options strategy (by the color of the Martingale candlestick) Also works well in forex trading When to open trades (binary options) A signal will appear in the place with a candle signaling the current candle It is recommended to open a deal for one candle of the current timeframe M1 and M5 When a blue dot appears, open a deal up When a red dot appears, open a trade down. How to open trades on Forex. When a signal is rec
チャートオーバーレイ インジケーターは、同じチャートで複数の商品の価格アクションを表示し、通貨ペアが互いにどのように変動するかを評価できます。 [ インストールガイド | 更新ガイド | トラブルシューティング | よくある質問 | すべての製品 ] 買われ過ぎまたは売られ過ぎの通貨ペアを簡単に見つける 同じチャートに最大6つの通貨ペアを重ねてプロット 必要に応じて反転記号を表示する チャートのサイズ、ズーム、時間枠に適応 自動価格レベル計算 カスタマイズ可能な価格レベル密度 カスタマイズ可能な色とサイズ 通貨ペアの反転とは何ですか? 通貨ペアの反転とは、取引の主要通貨を反転させた2つの通貨間の為替レートを表示することです。たとえば、EURUSD、GBPUSD、およびUSDJPYを同じオーバーレイチャートにプロットする場合、価格が逆レートを反映するためにUSDJPYを反転することは理にかなっています:JPYUSD。これにより、JPYUSDの価格は、オーバーレイチャートの他の2つのシンボルと正の相関関係で移動し、チャートの学習が容易になります。 インジケーターのテスト
The Chaikin Oscillator is a technical indicator developed by Marc Chaikin that combines price and volume data to measure the accumulation and distribution of a financial instrument. It aims to identify potential buying and selling opportunities in the market. The Chaikin Oscillator is calculated by subtracting a 10-day exponential moving average of the Accumulation Distribution Line (ADL) from a 3-day exponential moving average of the ADL. Here's how to use the Chaikin Oscillator indicator in tr
The PatternMMB trading indicator finds the most common candlestick analysis patterns and provides trading recommendations based on them. The PatternMMB trading indicator is designed to search for candlestick patterns on the price chart and issue trading recommendations depending on the nature of the found candlestick pattern. It is also possible to send sound notifications when all or any of the selected patterns appear, with an explanation of the pattern and its interpretation. In addition, th
A technical indicator that calculates its readings on trading volumes. In the form of a histogram, it shows the accumulation of the strength of the movement of the trading instrument. It has independent calculation systems for bullish and bearish directions. Works on any trading instruments and time frames. Can complement any trading system. The indicator does not redraw its values, the signals appear on the current candle. It is easy to use and does not load the chart, does not require additi
The Volumebyprice.com Indicator for MetaTrader 4 features Volume Profile and Market Profile TPO (Time Price Opportunity). Volume and TPO histogram bar and line charts. Volume Footprint charts. TPO letter and block marker collapsed and split structure charts. Static, dynamic and flexible range segmentation and compositing methods with relative and absolute visualizations. Session hours filtering and segment concatenation with Market Watch and custom user specifications. Graphical layering, posit
The Supply and Demand Zones indicator is one of the best tools we have ever made. This great tool automatically draws supply and demand zones, the best places for opening and closing positions. It has many advanced features such as multi timeframe zones support, displaying the width of zones, alert notifications for retouched zones, and much more. Because of market fractality, this indicator can be used for any kind of trading. Whether you are a positional, swing, or intraday trader does not ma
Daily FIBO Pro
Mark Thimoty Evangelista
BERG Daily FIBO Proであなたのトレーディングの可能性を解き放とう BERG Daily FIBO Pro   は、MetaTrader 4 (MT4) プラットフォーム専用に設計された強力でカスタマイズ可能なフィボナッチ・リトレースメント指標です。経験豊富なトレーダーであれ、初心者であれ、このインジケーターは重要なサポートとレジスタンスレベルを識別し、市場分析を向上させ、トレーディング戦略を最適化するための理想的なツールです。 BERG Daily FIBO Proを選ぶ理由   フィボナッチ分析の精度:   前日の高値と安値に基づいて自動的に計算されたフィボナッチ・リトレースメントレベルで、市場での優位性を手に入れましょう。 BERG Daily FIBO Pro   は、0%、23.6%、38.2%、50%、61.8%、78.6%、100% の各レベルを描画し、潜在的な市場の転換点を簡単に特定できるようにします。   インテリジェントアラートシステム:   カスタマイズ可能なアラートで、価格がフィボナッチレベルに触れた時に通知されるため、チャンスを逃し
This indicator displays the histogram and arrows on chart. When Simple The Best Pro are placed on a chart, they identify the trend.  The color of may be blue or red. The blue color stands for upside moves and the red color stands for downside trends. The indicator offers to set Stop Loss (SL) and  Take Profit (TP)  setting. The default value is ATR. Indicator has automatic optimization. The STB is a unique indicator that shows the tendency (button Bars) of a particular signals. The STB tells us
このプロダクトを購入した人は以下も購入しています
Gann Made Easy は、ミスター・ギャンの理論を使用した取引の最良の原則に基づいた、プロフェッショナルで使いやすい外国為替取引システムです。 W・D・ガン。このインジケーターは、ストップロスとテイクプロフィットレベルを含む正確な買いと売りのシグナルを提供します。 PUSH通知を利用して外出先でも取引可能です。 購入後はご連絡ください!私の取引のヒントと素晴らしいボーナスインジケーターを無料で共有します! おそらく、ギャンの取引手法についてはすでに何度も聞いたことがあるでしょう。通常、ギャンの理論は初心者のトレーダーだけでなく、すでにある程度の取引経験がある人にとっても非常に複雑なものです。なぜなら、ギャンの取引手法は理論的にはそれほど簡単に適用できるものではないからです。私はその知識を磨き、最良の原則を私の外国為替インジケーターに組み込むために数年を費やしました。 このインジケーターは非常に簡単に適用できます。必要なのは、それをチャートに添付し、簡単な取引推奨事項に従うだけです。このインジケーターは常に市場分析の仕事を行い、取引の機会を探します。適切なエントリーポイントを検出
最初のパルスレベルを反転 (RFI)     指示する     ロシア     -        utilizar con   el indicador の ESP 推奨事項 -   TPSpro トレンド プロフェッショナル版 -   MT5のバージョン 最も重要なことは、将来においても最も重要なことです。 機能のプリンシパル: ゾーンのほとんどは、ベンダーとコンプラドールによってアクティブ化されます。 状況を直感的に把握できるよう、初期の衝動を修正します。 LOGIC AI: MUESTRA zonas (círculos) parabuscar puntos de entrada cuando se activa una plantilla 視覚的に優れた視覚効果があり、最も重要な機能がすべて揃っていることに注意してください。 優れたニベレス/ゾーンの視覚化 (modo MTF) 世界で最も人気のある場所/ゾーンです。これを使用するのに最適な方法です (   TPSproTREND PRO   )。 アルゴリズム プロフェッショナル セパラド パソ ア パソ パラ オペラ それは
まず第一に、この取引インジケーターは再描画されず、再描画されず、遅延しないことを強調する価値があります。これにより、手動取引とロボット取引の両方に理想的なものになります。 ユーザーマニュアル:設定、入力、戦略。 アトミックアナリストは、価格の強さとモメンタムを利用して市場でより良いエッジを見つけるためのPA価格アクションインジケーターです。ノイズや誤ったシグナルを除去し、取引ポテンシャルを高めるための高度なフィルターを備えています。複雑なインジケーターの複数のレイヤーを使用して、アトミックアナリストはチャートをスキャンし、複雑な数学的計算をシンプルなシグナルと色に変換します。これにより、どのような初心者トレーダーでも理解して使用し、一貫した取引の決定を行うことができます。 「アトミックアナリスト」は、新規および経験豊富なトレーダー向けにカスタマイズされた包括的な取引ソリューションです。プレミアムインジケーターとトップノッチの機能を1つの取引戦略に組み合わせ、すべてのタイプのトレーダーにとって汎用性のある選択肢にします。 デイリートレーディングとスキャルピング戦略:高
Gold Stuff
Vasiliy Strukov
4.89 (238)
Gold Stuff は、金専用に設計されたトレンド指標であり、あらゆる金融商品にも使用できます。 インジケーターは再描画せず、遅れません。 推奨時間枠 H1. それインディケータでフルオートExpert Advisor EA Gold Stuffが動作します。 あなたは私のプロフィールでそれを見つけることができます. 設定と個人的なボーナスを得るために、購入後すぐに私に連絡してください! トレンド スキャナーの強力なサポートを利用して、無料のインジケーターを入手し、プライバシーを守ります。あーみー!   設定 矢印を描く - オンオフ。 チャートに矢印を描く。 アラート - 可聴アラートのオンオフ。 メール通知 - オンオフ。 電子メール通知。 プチ通知 - オンオフ。 プッシュ通知。 次に、色域を調整します。 Gold Stuff は、金専用に設計されたトレンド指標であり、あらゆる金融商品にも使用できます。 インジケーターは再描画せず、遅れません。 推奨時間枠 H1. それインディケータでフルオートExpert Advisor EA Gold Stuff
Trend Punch
Mohamed Hassan
4.95 (19)
This indicator is unstoppable when combined with our other indicator called  Support & Resistance . After purchase, send us a message and you will get it   for  FREE as a BONUS! Introducing Trend Punch , the revolutionary forex trend indicator that will transform the way you trade! Trend Punch is uniquely designed to provide precise buy and sell arrows during strong market trends, making your trading decisions clearer and more confident. Whether you're trading major currency pairs or exotic sym
An exclusive indicator that utilizes an innovative algorithm to swiftly and accurately determine the market trend. The indicator automatically calculates opening, closing, and profit levels, providing detailed trading statistics. With these features, you can choose the most appropriate trading instrument for the current market conditions. Additionally, you can easily integrate your own arrow indicators into Scalper Inside Pro to quickly evaluate their statistics and profitability. Scalper Inside
TPSpro TREND PRO は 、市場を自動的に分析し、トレンドとその各変化に関する情報を提供し、再描画せずに取引に参加するためのシグナルを提供するトレンド指標です。 インディケータは各ローソク足を使用し、個別に分析します。さまざまなインパルス(アップまたはダウンインパルス)を指します。通貨、仮想通貨、金属、株、指数の取引への正確なエントリーポイント! バージョンMT5                   インジケーターの完全な説明   インジケーター -   RFI LEVELS と併用することをお勧めします。 主な機能: レンダリングなしで正確な入力信号! シグナルが表示された場合、それは関連性を維持します。これは、シグナルを提供してからそれを変更する可能性があり、入金時の資金の損失につながる可能性があるリドローインジケーターとの重要な違いです。より高い確率と精度で市場に参入できるようになりました。矢印が表示された後、ターゲットに達する (利益確定) か反転シグナルが表示されるまで、ローソク足を色付けする機能もあります。 STOP LOSS / TAKE PROFIT
mql5と Telegramの モーニング・ブリーフィングで、詳細とスクリーンショットを含む毎日のマーケット・アップデートをご覧 ください! FX Power MT4 NGは 、長年の人気を誇る通貨強度計FX Powerの次世代モデルです。 この次世代ストレングスメーターは何を提供するのでしょうか?初代FXパワーの魅力すべて プラス GOLD/XAUの強さ分析 より正確な計算結果 個別に設定可能な分析期間 カスタマイズ可能な計算上限値により、さらに優れたパフォーマンスを実現 もっと見たい人のための特別なマルチインスタンス設定 すべてのチャートでお好みの色を無限に設定可能 数え切れないほどの通知オプションにより、重要なことを見逃すことはありません。 Windows 11とmacOSのスタイルで角を丸くした新しいデザイン 魔法のように動くインジケーターパネル FXパワーの主な機能 すべての主要通貨の強さの完全な履歴 すべての時間枠における通貨の強さの履歴 すべてのブローカーとチャートで同一の計算結果 100%信頼できるリアルタイム計算 -> リペイントなし ドロップダウン・リストから
現在20%OFF! 初心者やエキスパートトレーダーのためのベストソリューション! このダッシュボードソフトウェアは、28の通貨ペアで動作しています。それは私達の主要な指標(高度な通貨の強さ28と高度な通貨インパルス)の2に基づいています。それは全体の外国為替市場の大きい概観を与えます。それは、すべての(9)時間枠で28の外国為替ペアのための高度な通貨の強さの値、通貨の動きの速度と信号を示しています。チャート上で1つのインディケータを使用して市場全体を観察し、トレンドやスキャルピングの機会をピンポイントで見つけることができたら、あなたのトレードがどのように改善されるか想像してみてください。 このインディケータには、強い通貨と弱い通貨の識別、潜在的な取引の識別と確認がより簡単になるような機能が搭載されています。このインディケータは、通貨の強さや弱さが増加しているか減少しているか、また、すべての時間枠でどのように機能しているかをグラフィカルに表示します。 新機能として、現在の市場環境の変化に適応するダイナミックなマーケットフィボナッチレベルが追加され、すでに当社のAdvan
Trend Screener
STE S.S.COMPANY
4.8 (87)
トレンドインジケーター、1つのツールに組み込まれたすべての重要なトレンド機能を備えたトレンドトレーディングとフィルタリングのための画期的なユニークなソリューション! これは、すべてのシンボル/商品(外国為替、商品、暗号通貨、インデックス、株式)で使用できる100%再描画されていないマルチタイムフレームおよびマルチ通貨インジケーターです。 期間限定オファー: サポートおよびレジスタンス スクリーナー インジケーターは、たった 50 ドルで永久的にご利用いただけます。(元の価格 250 ドル) (オファー延長) トレンドスクリーナーは、チャート内のドットで矢印トレンドシグナルを提供するインジケーターに続く効率的なインジケーターです。 トレンド分析インジケーターで使用できる機能: 1.トレンドスキャナー。 2.最大利益分析を備えたトレンドライン。 3.トレンド通貨強度メーター。 4.アラート付きのトレンド反転ドット。 5.アラート付きの強いトレンドドット。 6.トレンド矢印 毎日の分析例、毎日のシグナルパフォーマンス...など、トレンドスクリーナーインジケーターを使用して、ここで見つけること
FX Volume
Daniel Stein
4.58 (33)
mql5と Telegramの モーニング・ブリーフィングで、詳細とスクリーンショットを含む毎日のマーケット・アップデートをご覧 ください! FX Volumeは、ブローカーの視点から市場のセンチメントをリアルに洞察する、最初で唯一の出来高インジケーターです。 ブローカーのような機関投資家が外国為替市場でどのようなポジションをとっているか、COTレポートよりもはるかに速く、素晴らしい洞察を提供します。 この情報をチャート上で直接見ることは、あなたの取引にとって真のゲームチェンジャーであり、画期的なソリューションです。 以下のようなユニークなマーケットデータ洞察から利益を得てください。 比率は 、通貨のロングポジションとショートポジションの比率をパーセントで表示します。 比率の変化は 、選択した期間内のロング比率とその変化率を表示します。 Volumes Totalは 、通貨の取引量(ロングとショート)の合計をロット単位で表示します。 Volumes Long :全通貨のロングポジションの取引量を表示します。 Volumes(ショート )は、全通貨のショートポジションの取引量を表示
- Real price is 80$ - 40% Discount ( It is 49$ now ) Contact me for instruction, add group and any questions! Related EA Product: Bitcoin Expert Introduction The breakout and retest strategy is traded support and resistance levels. it involves price breaking through a previous level.  The break and retest strategy is designed to help traders do two main things, the first is to avoid false breakouts. Many false breakouts start with a candlestick that breaks out of a level but ends with an immedi
現在31%オフ! 初心者やエキスパートトレーダーに最適なソリューション! このインジケータは、独自の機能と秘密の数式を組み込んだ、ユニークで高品質かつ手頃な価格のトレーディングツールです。たった1枚のチャートで28の通貨ペアのアラートを表示します。新しいトレンドやスキャルピングチャンスの引き金となるポイントを正確に把握することができるので、あなたのトレードがどのように改善されるか想像してみてください! 新しい基本的なアルゴリズムに基づいて構築されているため、潜在的な取引の特定と確認がより簡単になります。これは、通貨の強さや弱さが加速しているかどうかをグラフィカルに表示し、その加速のスピードを測定するためです。加速すると物事は明らかに速く進みますが、これはFX市場でも同じです。つまり、反対方向に加速している通貨をペアにすれば、利益を生む可能性のある取引を特定することができるのです。 通貨の勢いを示す縦の線と矢印は、あなたの取引の指針となるでしょう。 ダイナミックマーケットフィボナッチ23レベルはアラートトリガーとして使用され、市場の動きに適応します。もしインパルスが黄色
Enigmera
Ivan Stefanov
5 (3)
エニグメラ:市場の中核 https://www.enigmera.com はじめに このインディケータと取引システムは、金融市場に対する驚くべきアプローチです。ENIGMERAは、フラクタルサイクルを使用して、サポートとレジスタンスレベルを正確に計算します。本格的な蓄積局面を示し、方向性と目標を示します。 トレンド中でも調整中でも機能するシステムです。 どのように作動するのか? ENIGMERAは、支持線・抵抗線、目標線、乖離線の3つのラインで構成されています。このシステムは、過去のデータを現在と未来に外挿する典型的な市場指標とは異なり、現在の完全な画像を提供します。支持線上にある場合、それは本当の支持を意味し、抵抗線上にある場合、それは本当の抵抗を意味する。ある水準が破られた場合、それはトレンドの変化を意味する。再描画はしない。 市場は常に進化しているため、ENIGMERAはその評価ツールを適応させ、定期的に戦略を修正しています。  これにより、すべてのシナリオが徹底的に評価されることが保証されます。この市場指標の独自性は、その能力を見れば明らかです。  ENIGM
トレンドカッターは、M1 や M5 などの下位時間枠を含むあらゆる時間枠で使用できるトレンド指標です。このインジケーターは日中取引を好むトレーダーにとって理想的であり、長期取引を好むトレーダーにも役立ちます。このインジケーターは、取引システムの基礎として、またはスタンドアロンの取引ソリューションとして使用できます。 このインジケーターは、PUSH 通知を含むあらゆるタイプのアラートを提供します。 インジケーターの使い方はとても簡単です。信号に従えばいいだけです。また、このインジケーターのすべてのユーザーに、このメソッドをできるだけ効率的に使用するのに役立つ追加のインジケーターも無料で提供します。 取引のヒントと素晴らしいボーナスを入手するには、購入後にご連絡ください。
PRO Renko Systemは、特別にRENKOチャートを取引するために設計された高精度の取引システムです。 これは、様々な取引商品に適用することができる普遍的なシステムです。 システムは効果的に正確な逆転信号へのアクセスを与えるいわゆる市場の騒音を中和する。 表示器は非常に使いやすく、信号の生成に責任がある1つの変数だけがあります。 あなたは簡単にお好みの任意の取引ツールとレンコバーのサイズにツールを適応させることができます。 私はいつもあなたが私のソフトウェアで収益性の高い取引を支援するために余分なサポートを提供する準備ができています! 私はあなたに幸せで収益性の高い取引をしたいです! ご購入後にご連絡ください! 私はあなたに私のレンコチャートジェネレータを送信します。 私はまた、私の個人的な推奨事項やシステムの他のモジュールを無料で共有します!
現在26%オフ 初心者やエキスパートトレーダーに最適なソリューション! このインジケーターは、独自の機能と新しい計算式を取り入れた、ユニークで高品質、かつ手頃な価格のトレーディングツールです。たった1枚のチャートで28の為替ペアの通貨強度を読み取ることができます。新しいトレンドやスキャルピングチャンスの引き金となるポイントを正確に特定することができるので、あなたのトレードがどのように改善されるか想像してみてください。 ユーザーマニュアルはこちら  https://www.mql5.com/en/blogs/post/697384 これが最初の1本、オリジナルだ! 価値のないクローンを買わないでください。 特別な サブウィンドウの矢印で強い通貨の勢いを表示 GAPがあなたのトレードを導く! 基準通貨や気配値が売られすぎ・買われすぎのゾーン(外相フィボナッチレベル)にあるとき、個別チャートのメインウィンドウに警告表示。 通貨がレンジの外側から反落した場合、プルバック/リバーサルのアラート。 クロスパターンの特別なアラート 複数の時間枠を選択可能で、トレンドを素早く
ブレーカートレーダーになり、価格が反転すると市場構造からの利益が変化します。 注文ブロックブレーカーインジケーターは、トレンドまたは価格の動きが枯渇に近づいており、逆転の準備ができていることを識別します。通常、反転または大規模なプルバックが発生しようとしているときに発生する市場構造の変化について警告します。 この指標は、ブレイクアウトと価格の勢いを識別する独自の計算を使用します。使い果たされる可能性のあるポイントの近くで新しい高値が形成されるたびに、インディケーターはその高値の作成を担当する最後の注文ブロックを描きます。次に、移動する価格とともに注文ブロックを追跡します。その後、価格が反対方向にシフトし、その注文ブロックを突破すると、新しい市場構造を作成し、トレンドまたは大きな後退の可能性のある反転の開始を警告します。 注文ブロックは、高値/安値が作成される前の最後の反対色のろうそくであり、価格がこれらの重要な領域を下抜けすると、トレンドの短期的ま​​たは長期的な反転の兆候です。 特徴 重要な枯渇点での市場構造の変化を警告します 価格が使い果たされるレベルに近づくと、
TakePropips Donchian Trend Pro
Eric John Pajarillaga Aldana
4.44 (16)
TakePropips Donchian Trend Pro   (MT4) は、ドンチャン チャネルを使用してトレンドの方向を自動的に検出し、エントリーとエグジットの取引シグナルを提供する強力で効果的なツールです! この多機能インジケーターには、トレンド スキャナー、取引シグナル、統計パネル、スクリーナー、取引セッション、およびアラート履歴ダッシュボードが含まれます。取引シグナルを提供し、チャートを分析する時間を節約するように設計されています! ユーザー マニュアルとインストール ガイドは、ブログ投稿 (   https://www.mql5.com/en/blogs/post/751368   ) からダウンロードできます。 今日は 50% オフ! 98ドルから49ドルに値下げ! このインジケーターは、ストラテジー テスターでテストできます (ビジュアル モードを有効にします)。 詳細については、説明の下にあるビデオ チュートリアルも利用できます。 ご不明な点やサポートが必要な場合は、私に連絡してください。 TakePropips Donchian Trend Pro イン
支持線と抵抗線、そしてローソク足のギャップをチャート上に自動的に表示するため、価格が次に向かう可能性のある場所や反転する可能性のある場所を確認することができます。 このインジケーターは、私のウェブサイト(The Market Structure Trader)で教えているポジショントレード手法の一部として使用するように設計されており、ターゲットとエントリーの可能性のための重要な情報を表示します。 このインジケーターには、2つのコア機能と4つの追加機能があります: コア機能1 - 日足、週足、月足のサポートラインとレジスタンスラインの自動表示 このインジケーターは、直近2日間、最大6週間前、数ヶ月前のサポートレベルとレジスタンスレベルを自動的に引き込みます。これらのレベルの見た目は完全にカスタマイズすることができ、いくつ表示されるかを表示することもできます。これらの重要な水準は、しばしば主要な支持線と抵抗線として機能し、価格が転換して引き戻されたり反転したりする場所です。また、価格が向かうターゲットでもあるため、価格が転換する前に、取引に利用できる潜在的な距離を素早く確認するこ
通貨強さウィザードは、取引を成功させるためのオールインワン ソリューションを提供する非常に強力な指標です。このインジケーターは、複数の時間枠のすべての通貨のデータを使用して、このまたはその外国為替ペアのパワーを計算します。このデータは、使いやすい通貨インデックスと通貨パワーラインの形式で表され、特定の通貨のパワーを確認するために使用できます。 必要なのは、取引したいチャートにインジケーターを接続することだけです。インジケーターは、取引する通貨の実際の強さを示します。このインジケーターは、トレンドに合わせて取引するときに有利に利用できる売買高の圧力の極値も示します。このインジケーターには、フィボナッチに基づく可能なターゲットも表示されます。 このインジケーターは、PUSH 通知を含むあらゆるタイプのアラートを提供します。 購入後ご連絡下さい。私の取引のヒントをあなたと共有し、素晴らしいボーナスインジケーターを無料で提供します! 幸せで有益な取引をお祈りします。
IX Powerは 、FX Powerの無敵の精度をついにFX以外のシンボルにも提供します。 お気に入りの指数、株式、コモディティ、ETF、さらには暗号通貨の短期、中期、長期のトレンドの強さを正確に判断します。 お使いの端末が提供する すべてを分析する ことができます。ぜひお試しいただき、取引 タイミングが大幅に改善 されることをご体験ください。 IXパワーの主な特徴 100%正確で再描画されない計算結果 - ターミナルで利用可能なすべての取引シンボルに対して 予め設定され、さらに個別に設定可能な強度分析期間のドロップダウン選択 Eメール、メッセージ、モバイル通知による無数の通知オプション EAリクエストのためのアクセス可能なバッファ カスタマイズ可能な計算制限により、さらに優れたパフォーマンスを実現 もっと見たい人のための特別なマルチインスタンス設定 すべてのチャートでお好みの色を無限に設定可能 Windows 11とmacOSのスタイルで角を丸くした新しいパネルデザイン サブ・ウィンドウとメイン・チャートの間をシームレスに移動する、魔法のように動く
ADR反転インジケーターは、通常の1日の平均レンジに関連して価格が現在取引されている場所を一目で示します。価格が選択した平均範囲とレベルを超えると、ポップアップ、電子メール、またはプッシュを介して即座にアラートを受け取るため、プルバックと逆転にすばやくジャンプできます。インディケータは、チャート上に1日の平均レンジの極値で水平線を描画し、それらを超える価格の数学的確率が付加されているレベルを超える延長も描画します。詳細については、以下をご覧ください... インジケーターとモニターを補完するADRアラートダッシュボードここでも利用可能なすべてのペア:https:// www.mql5.com/en/market/product/62756 MT5バージョンはこちらからも入手できます:https:// www.mql5.com/en/market/product/64477/ 通常の1日平均レンジ(ADR)内で価格が取引され、これらのレベルを上回っている時間の約60%は、通常、その後の引き戻し(利益確定)の動きを伴う急激な価格の動きの指標です。毎日の範囲の上部または下部からの
Please contact me after purchase to immediately get your PDF strategy + documentation for Trend Pulse !  Introducing Trend Pulse , a unique and robust indicator capable of detecting bullish, bearish, and even ranging trends! Trend Pulse uses a special algorithm to filter out market noise with real precision. If the current symbol is moving sideways, Trend Pulse will send you a ranging signal, letting you know that it's not a good time to enter a trade. This excellent system makes Trend Pulse
RSI / TDIアラートダッシュボードを使用すると、取引するすべての主要ペアでRSIを一度に(ユーザーが選択可能に)監視できます。 次の2つの方法で使用できます。 1.複数の時間枠を選択すると、通常の取引条件を超えて延長された複数の時間枠がある場合にダッシュが表示されます。複数の時間枠にわたって買われ過ぎまたは売られ過ぎのレベルを達成したため、価格が最近激しく押し上げられたため、引き戻しまたは逆転が間もなく行われることを示す優れた指標です。 2. 1つの時間枠(トレードするのが好き)と複数のRSIレベルを使用して、その時間枠でのRSIの延長の強さを示します。これは、価格が一方向に非常に長く押し込まれ、市場が利益を得ることになっている場合に、平均回帰取引を行うための優れた戦略です。スクリーンショットの例では、H4 RSIが25レベルを超えて2ペアで拡張されていることがわかります。これは、通常の価格アクションよりもはるかに遠いため、長く行く良い機会です。 ダッシュボードは、選択した時間枠でろうそくが閉じたときに、選択したレベルでの延長された状態(買われ過ぎと売られ過
Stratos Pali Indicator   is a revolutionary tool designed to enhance your trading strategy by accurately identifying market trends. This sophisticated indicator uses a unique algorithm to generate a complete histogram, which records when the trend is Long or Short. When a trend reversal occurs, an arrow appears, indicating the new direction of the trend. Important Information Revealed Leave a review and contact me via mql5 message to receive My Top 5 set files for Stratos Pali at no cost! D
Gold Channel is a volatility-based indicator, developed with a specific timing algorithm for the XAUUSD pair, which consists of finding possible corrections in the market. This indicator shows two outer lines, an inner line (retracement line) and an arrow sign, where the theory of the channel is to help identify overbought and oversold conditions in the market. The market price will generally fall between the boundaries of the channel. If prices touch or move outside the channel it is a tra
M1 Arrow
Oleg Rodin
4.73 (15)
市場の2つの基本原則に基づく日中戦略。 このアルゴリズムは、追加のフィルターを使用したボリュームと価格の波の分析に基づいています。インディケータのインテリジェントアルゴリズムは、2つの市場要因が1つに結合した場合にのみシグナルを出します。インディケータは、より高い時間枠のデータを使用して、M1チャート上の特定の範囲の波を計算します。そして波を確認するために、インジケーターはボリュームによる分析を使用します。 このインディケータはレディトレーディングシステムです。トレーダーが必要とするのは、信号に従うことだけです。また、インジケーターはあなた自身の取引システムの基礎になることができます。取引はミニッツチャートでのみ行われます。 インジケーターがMTFの原則を使用しているという事実にもかかわらず、インジケーターのアルゴリズムは可能な限り安定しています。 購入後、必ず私に書いてください!私の取引設定と推奨事項をあなたと共有します!
Bomb Bank Signal
Igor Pereira Calil
5 (1)
Bomb Bank シグナル: MetaTrader 4 の信頼度インジケーター Bomb Bank Signal は、金融市場で最も関連性の高いトレンドを特定するように設計された MetaTrader 4 の強力なインジケーターです。動きを正確に予測するツールをお探しなら、Bomb Bank が最適です。 仕組み: このインジケーターは、出来高分析、ローソク足終値、対称トレンドという 3 つの異なる方法を組み合わせて、売買の機会を検出してシグナルを送ります。 Bomb Bank は、買いの機会を特定するときは「爆弾」のようなものであり、売りシグナルを検出するときは「ドクロ」のようなものです。 ボムバンクはなぜ違うのですか? 完全な信頼性: Bomb Bank Signal は信号を削除しません。一度シグナルが発せられると、シグナルは残り続けるので、チャンスを逃すことはありません。 極めて高い精度: Bomb Bank は誤った信号を送信しません。リアルタイムで最新情報を更新し、市場の進化に合わせて調整しながら、以前のシグナルの透明性を維持します。 ライブアップデ
Advanced Supply Demand
Bernhard Schweigert
4.91 (294)
現在33%オフ 初心者にもエキスパートトレーダーにも最適なソリューション このインジケーターは独自の機能と新しい公式を多数内蔵しており、ユニークで高品質かつ手頃な取引ツールです。このアップデートでは、2つの時間枠ゾーンを表示できるようになります。より長いTFだけでなく、チャートTFとより長いTF(ネストゾーンを表示)の両方を表示できます。すべてのSupply Demandトレーダーの皆さんのお気に召すはずです。:) 重要情報の公開 Advanced Supply Demandの可能性を最大化するには、 https://www.mql5.com/ja/blogs/post/720245 にアクセスしてください。   エントリーまたはターゲットの正確なトリガーポイントを正確に特定できれば取引がどのように改善されるか想像してみてください。新しい基盤となるアルゴリズムに基づいて構築されているため、買い手と売り手の間の潜在的な不均衡をさらに簡単に特定できます。これは、最も強い需要と供給のゾーンと、過去のパフォーマンス(古いゾーンを表示)がグラフィカルに表現されるためです。これらの機能は、最適
作者のその他のプロダクト
Trade Assistant 38 in 1
Makarii Gubaydullin
4.89 (18)
多機能ツール 搭載機能: ロット計算機、プライスアクション、リスク/リワードレシオ、トレードマネージャー、需要供給ゾーンなどをはじめ65以上の機能。 バージョ:デモ版   |   ユーザーマニュアル   |    MT5版 このユーティリティはストラテジー テスターでは機能しません。 ここからデモ   バージョンをダウンロードして製品をテストできます。 ご不明な点や改善提案、バグの発見などございましたら、 連絡してください 。 取引プロセスを簡素化、高速化、自動化します。このダッシュボードで標準端末機能を拡張します 1. 新しい取引を開始します : ロット / リスク / RR の計算 1. Lot計算機(リスクサイズに基づく取引量計算 2. リスク計算機(ロットサイズに基づくリスク量) 3. リスク/リワードレシオ (R/R) 4. 注文のアクティベーション トリガー + Buy StopLimit / Sell StopLimit 5. 仮想 SL / TP レベル (隠しSL、TP: ブローカーには見えない) 6.  Smart SL / エントリー レベル: バ
多機能ツール 搭載機能: ロット計算機、プライスアクション、リスク/リワードレシオ、トレードマネージャー、需要供給ゾーンなどをはじめ65以上の機能。 バージョ:デモ版   |   ユーザーマニュアル   |    MT5版 このユーティリティはストラテジー テスターでは機能しません。 ここからデモ バージョンをダウンロードして製品をテストできます。 ご不明な点や改善提案、バグの発見などございましたら、 連絡してください 。 取引プロセスを簡素化、高速化、自動化します。このダッシュボードで標準端末機能を拡張します 1. 新しい取引を開始します : ロット / リスク / RR の計算 1. Lot計算機(リスクサイズに基づく取引量計算 2. リスク計算機(ロットサイズに基づくリスク量) 3. リスク/リワードレシオ (R/R) 4. 注文のアクティベーション トリガー + Buy StopLimit / Sell StopLimit: MT4でも可  5. 仮想 SL / TP レベル (隠しSL、TP: ブローカーには見えない) 6.  Smart SL / エントリー レ
The indicator displays the   specified Risk Level   on the chart, for long and short positions. My   #1 Utility : includes 65+ functions  |   Contact me  if you have any questions It may be useful when setting the Stop Loss level, the value of which is visible on the right price axis. To calculate the level of risk, a   Fixed  / or   Last used   lot size is used. Imput Settings: Last traded lot:  set " true " to make the calculation for your last used   trading lot; Lot Size: set the value of t
秒ごとの更新で現在の市場情報を表示します。 広がりのサイズ; スワップサイズ:短期および長期のポジションの場合; 現地時間(オプション); 私の#1アシスタント: 38+機能が含まれています| ご質問がある場合は私に連絡してください インジケータの設定では、次の設定を行うことができます: フォントサイズ; テキストの色; 位置を選択します:チャートの左/右隅; 現地時間:オン/オフ; プログラムファイルは"Indicators"ディレクトリに配置する必要があります。 私の#1アシスタント: 38+機能が含まれています| ご質問がある場合は私に連絡してください .................................
FREE
Visualization of the trade deals, distributed by price levels. You can set any period for calculation: between 2 vertical lines, or set a fixed time interval. The histogram levels are relative: a wider bar means more trading volume. Distribution extremes can be used as a support and resistance levels. All styles, sizes and colors are customizable. My  #1 Utility : includes 65+ functions  |   Contact me  if you have any questions  |  MT4 version In the settings of the indicator, you can config
Informer for calculating the results of open trades. My   #1 Utility : includes 65+ functions  |   Contact me  if you have any questions The information panel groups open orders into 2 categories: Buys Sells For each category, the symbol and the current number of pips are displayed. The total result for all open trades is shown below. Notifications can be enabled or disabled by simply clicking on the button: When the notification is enabled, you will know when the profit on any symbol has excee
Timer Countdown
Makarii Gubaydullin
5 (2)
Countdown timer till the bar closure, + % Progress status:  My   #1 Utility :   includes 65+ functions  |   Contact me  if you have any questions In the settings of the indicator, you can configure: Timeframe for Calulculation; true / false:   Higher TimeFrame option (next from the currently used: M15->M30, H4->D1...) Position: 1 = Bottom Left corner; 2 = Bottom Right corner; 3 = Top Left corner; 4 = Top Right corner; Font Size; Color; Font Style;
FREE
The indicator displays the levels that are extremes for the specified time frames. Resistance level is the maximum price of the last closed bar; Support level is the minimum price of the last closed bar; My   #1 Utility : includes 65+ functions  |   Contact me  if you have any questions 2 operating modes: Real bodies:  Open and Close prices will be used; Extremes:  High and Low prices will be used; This indicator: Helps to see potential reversal levels; Patterns formed near the levels have mo
Spread and Swap
Makarii Gubaydullin
5 (1)
秒ごとの更新で現在の市場情報を表示します。 広がりのサイズ; スワップサイズ:短期および長期のポジションの場合; 現地時間(オプション); 私の#1アシスタント: 38+機能が含まれています| ご質問がある場合は私に連絡してください インジケータの設定では、次の設定を行うことができます: フォントサイズ; テキストの色; 位置を選択します:チャートの左/右隅; 現地時間:オン/オフ; プログラムファイルは"Indicators"ディレクトリに配置する必要があります。 私の#1アシスタント: 38+機能が含まれています| ご質問がある場合は私に連絡してください .................................
FREE
Countdown timer till the bar closure, + % Progress status:  My   #1 Utility :   includes 65+ functions  |   Contact me  if you have any questions In the settings of the indicator, you can configure: Timeframe for Calulculation; true / false: Higher TimeFrame option (next from the currently used: M15->M30, H4->D1...) Position: 1 = Bottom Left corner; 2 = Bottom Right corner; 3 = Top Left corner; 4 = Top Right corner; Font Size; Color; Font Style;
FREE
Quickly find the lot size  directly in the terminal , to comply with risk management. My   #1 Utility : includes 65+ functions  |   Contact me  if you have any questions it works on any trading instruments: Forex, Stocks, Futures, Indices, CFD, Bonds, Cryptocurrencies; interface minimization function; flexibility of use; money management; It is especially useful for short-term traders, when they need to act  quickly . For calculation it is necessary to specify 2 parameters: The size of the ris
The indicator displays the most important Price Action Patterns that indicate a potential reversal / continuation of the trend. My   #1 Utility : includes 65+ functions  |   Contact me  if you have any questions Avaliable Patterns: Pin bar; Engulfing; Inside bar (Harami); Morning star; Evening star; Dark Cloud Cover; Piercing Line; Features: You can   select patterns   to display and disable unnecessary patterns; Notifications : alerts in the terminal, Email and Push-notifications (to the mobil
Automatically draws Fibonacci levels, basen on the last closed bar of the specified time frame. My   #1 Utility : includes 65+ functions  |   Contact me  if you have any questions helps to see potential reversal levels; patterns formed near the levels have more potential; significantly saves time spent on manual level plotting; Adjustable parameters: The time frame used to plot the levels; Personalization of Fibonacci levels: main correction levels + extension levels; Line color, line width an
The indicator shows the operating time of the world exchanges. Help you to see which markets are currently most active. My   #1 Utility : includes 65+ functions  |   Contact me  if you have any questions Helps to select the most volatile instruments at the moment; Especially useful for an intraday traders; 1) When using on time frames 1H and below: the lines will correspond to the actual location of the bars on the chart, and when moving the chart, the lines of the trading sessions will move
Shows the direction of the bars on all major timeframes. My #1 Utility : 65+ functions   |   Version for MT5 The meaning of the visual signals ( squares): Red : Close price is  lower  than the Open price: Close < Open;  Green : Close price is  higher  than the Open price: Close > Open; Blue : Close price is  equal  to the Open price: Close = Open; You can set the Shift of the calculated bar, relative to the current bar: Shift = 0: the direction of the currenttly open (floating) bars, Shift
14 Indicators and auxiliary tools for convenient trading This utility contains 14 additional tools that can be useful for certain actions of the trader,   thereby simplifying and speeding up the trading process. My   #1 Utility : includes 65+ functions  |   Contact me  if you have any questions Due to the different monitor resolutions, some users may encounter the fact that the labels will be displayed with an overlay or be too small. If you encounter such a problem, you can adjust the font size
Informer for tracking daily trading results. My   #1 Utility : includes 65+ functions  |   Contact me  if you have any questions In the upper part of the panel, you set the daily profit target (in pips): Manually entering a value; Using the + and - buttons (the change step can be configured in the settings); The dashboard then groups trades into 2 categories: Current floating result; Summing up closed trades; The final result is displayed at the bottom: achievement or non-achievement of your da
Displays the appearance of a gap on the chart (when the closing price of the previous bar differs from the opening price of the new bar). My   #1 Utility:  includes 65+ functions  |   Contact me  if you have any questions In the initial settings you can configure: The size of the gap (in points): only gaps that exceed this value will be displayed. Arrow color : separate for up and down gaps. When you hover the mouse over the gap arrows on the chart, their size will be displayed ; I recommend ch
Market information and detailed statistics: analysis of volatility and price bars. My   #1 Utility : includes 65+ functions  |   Contact me  if you have any questions Specify any currency pair/trading instrument to get information: Market information: Current spread; Swap for long positions (buys); Swap for short positions (sells); Select a time frame and number of periods to analyze price changes: Average volatility; Maximum volatility; Minimum volatility; Maximum price; Minimum price; Numb
Monitor your favorite Symbols My   #1 Utility:  includes 65+ functions, including this tool  |   Contact me  if you have any questions This tool opens in a separate window: it can be moved (drag anywhere), and minimized [v]. You can adjust the Watchlist on the panel: Click [edit list] to add / remove the Symbols from the Watchlist. Calculated value: it may either be the last [closed bar], or the current [floating bar]. Select the [timeframe] for calculation. There are 2 types of the value sorti
The indicator helps you analyze 3 different Time Intervals on a single screen to see the overall price action. My   #1 Utility : includes 65+ functions  |   Contact me  if you have any questions In the initial settings you can configure: TimeFrame 1; TimeFrame 2; TimeFrame 3; The number of bars to be shown; Colors of bullish and bearish bars; My other products: Indicators: 14 in  1
Detailed statistics of your trading for the selected period My   #1 Utility : includes 65+ functions  |   Contact me  if you have any questions Statistics display modes: For the  selected   currency pair/trading instrument Statistics for  all trades   (" ALL ") You can select the period for which you want to get statistics: 1 day 1 week 1 month 2   months 3   months 6   months 1 year 2 years All trading history Displayed information:  Gross profit Gross loss Total profit/loss Number of trade
Utility for setting notifications when a given price level is reached. My   #1 Utility : includes 65+ functions  |   Contact me  if you have any questions The alert can be set in three ways: Manual entry of the price level; Setting the price change: in percent / in pips / in market points; By moving the level with the mouse: there is also a magnet function, when activated, the level will snap to the nearest OHLC values; Optionally, you can enable / disable each type of alert: Notifications in t
Management of active and pending orders: automatic breakeven, TP/SL changes, partial / full closing, visual display of levels on the chart My   #1 Utility : includes 54+ functions  |   Contact me  if you have any questions Ex4  file must be located in the "Experts" directory! Auto Trading   must be activated ! 1) Main window: to manage orders, you can set a specific symbol [Symbol], or select all symbols [ALL] Close all active positions [ALL] Close all profitable trades [profits] Close all loos
Detailed statistics of your trading for the selected period My   #1 Utility : includes 65+ functions  |   Contact me  if you have any questions The utility includes 2 separate tools: Trade Statistics WeekDays Analyzer Statistics display modes: For the selected  currency pair/trading instrument Statistics for all trades   (" ALL ") You can select the period for which you want to get statistics: 1 day 1 week 1 month 2   months 3   months 6   months 1 year 2 years All trading history 1. Trade Stat
The indicator shows the currently forming candle of the selected time frame My   #1 Utility : includes 65+ functions  |   Contact me  if you have any questions Due to the different monitor resolutions, some users may encounter the fact that the Countdown label will be too small/big. If you encounter such a problem, you can  adjust the font size:  the 4th parameter in the input variables. 1) In the settings, when activating the indicator, s elect the timeframe   that will be used to display the f
Profit/loss statistics for each day of the week on which the trade was opened My   #1 Utility : includes 65+ functions  |   Contact me  if you have any questions Statistics display modes: For the    selected   currency pair/trading instrument Statistics for    all trades   (" ALL ") You can select the period for which you want to get statistics: 1 day 1 week 1 month 2   months 3   months 6   months 1 year 2 years All trading history Displayed information:  You will see statistics for each day of
Analyze up to 3 additional charts of other timeframes , without switching the main chart. My   #1 Utility : includes 65+ functions  |   Contact me  if you have any questions The indicator opens in a  separate window: The window   can be moved   to any place on the chart (using the   [<M>]   button). The window can also be minimized to save space ( [ <^>]  button) In the window that appears, you can configure: The period   of the 1st chart (left); The period   of the 2nd chart (center); The peri
The indicator displays the levels of potential profit/loss for each direction (buy and sell). My   #1 Utility : includes 65+ functions  |   Contact me  if you have any questions You can set:  Lot size (there is also an option to auto-set the last used lot); Grid step : percentage / amount of money (green switch); Number of levels for each direction; Risk calculation for the current account balance / or for the free margin; In the initial settings of the indicator, you can select: Color of lines
Short-term scalper Currency pair: EURUSD; Timeframe: 5 minutes. My   #1 Utility : includes 65+ functions  |   Contact me  if you have any questions Since the EA works on a low timeframe, it is important to use a broker where the typical spread on EURUSD does not exceed 2 . A higher spread can significantly affect the results. The strategy is based on the idea of long-term stability. The results attached in the screenshots are a backtest from 1999.
フィルタ:
レビューなし
レビューに返信
バージョン 1.20 2021.06.13
Added the option to receive an alert when the desired bar occurs;

Added the option to select a color to indicate the size of the bars;