• 概要
  • レビュー (4)
  • コメント (2)
  • 最新情報

Narrow Range Timeframe

4.67

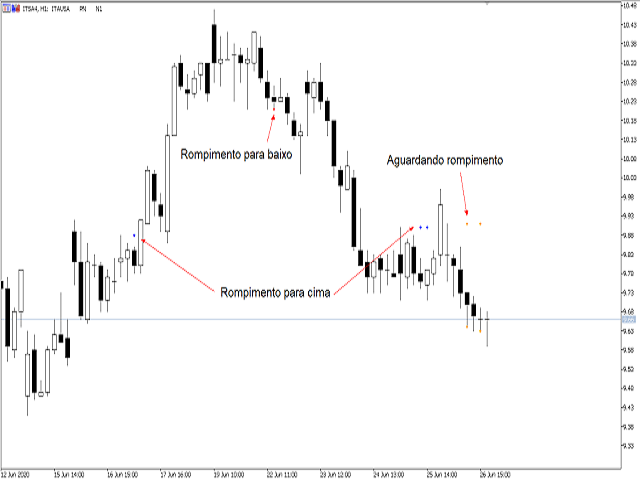
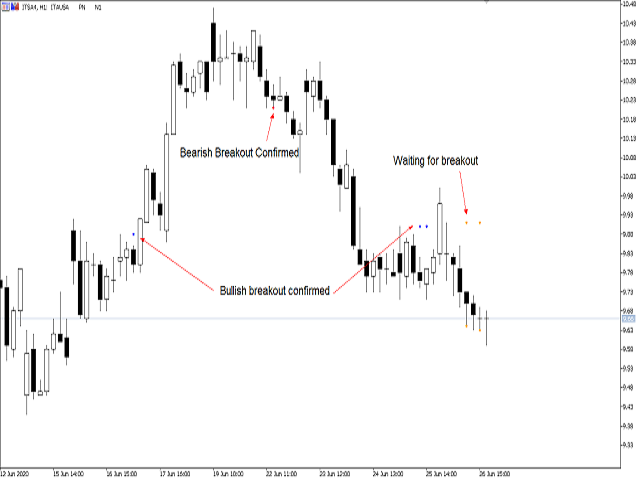
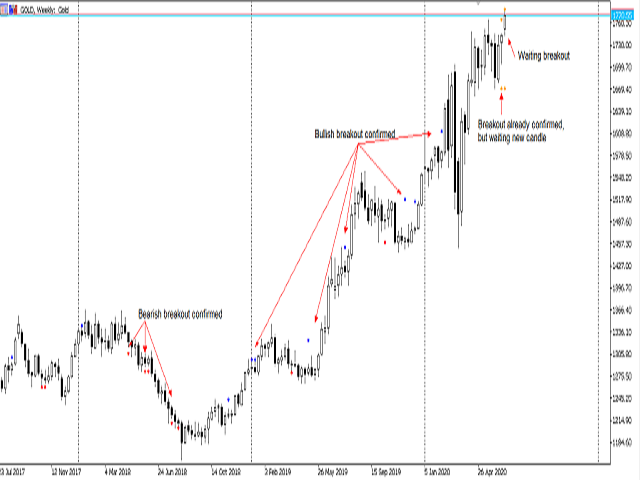
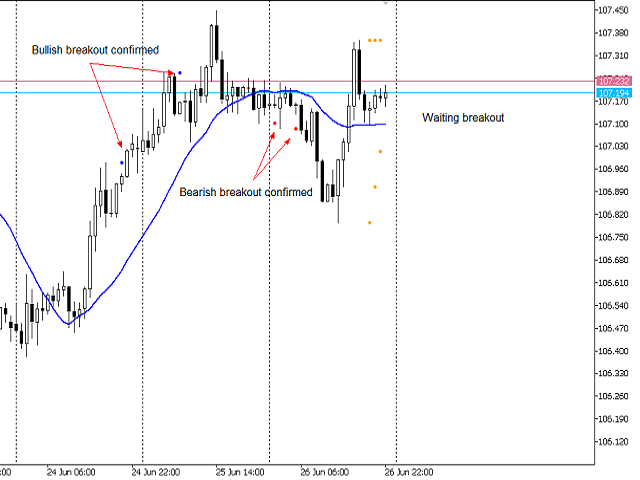
This indicator utilizes the Narrow Range 7 concept. This concept says that if the seventh candle is the one with the smallest range, that is, the smallest difference between maximum and minimum of all 7 candles. The indicator marks this candle with two markers and waits for a breakout to happens in the next 6 candles.

It's called "timeframe" because if in the next 6 candles the breakout not happens, it will remove all marks on candle. If it exceeds 7 times the timeframe, it also will remove the marks. Let's say a trading session is 9 hours and third candle on H1 timeframe, it is waiting a breakout. But, in that session there was no breakout. In the next trading session, the previous marked candle will be unmarked because the breakout didn't happen.

This indicator shares some index information:

  • 0, value marked on graph or zero
  • 1, color index
  • 2, lower value marked during waiting
  • 3, candle ponctuaction (to count sequential NR7)
  • 4, highest high on 6 previous candles
  • 5, lowest low on 6 previous candles
  • 6, how many active marks waiting a breakout

I invite you to know our other product: Weis Wave!

レビュー 4
jleiton
94
jleiton 2022.02.17 02:40 
 

Really easy to set up and accurate. Thank you

Aleksandr Tamonin
4109
Aleksandr Tamonin 2021.01.24 12:07 
 

Отличный инструмент можно использовать совместно с другими индикаторами, спасибо.

Mustafa Nail Sertoglu
1046
Mustafa Nail Sertoglu 2023.12.02 17:25 
 

Trying to get the logic and coordination with my trading style, thx for sharing

おすすめのプロダクト
QuantumAlert Stoch Navigator is a free indicator available for MT4/MT5 platforms, its work is to provide "alerts" when the market is inside "overbought and oversold" regions in the form of "buy or sell" signals. This indicator comes with many customization options mentioned in the parameter section below, user can customise these parameters as needful. Join our   MQL5 group , where we share important news and updates. You are also welcome to join our private channel as well, contact me for the p
FREE
QuantumAlert RSI Navigator is a free indicator available for MT4/MT5 platforms, its work is to provide "alerts" when the market is inside "overbought and oversold" regions in the form of "buy or sell" signals. This indicator comes with many customization options mentioned in the parameter section below, user can customise these parameters as needful. Join our MQL5 group , where we share important news and updates. You are also welcome to join our private channel as well, contact me for the priva
FREE
QuantumAlert CCI Navigator is a free indicator available for MT4/MT5 platforms, its work is to provide "alerts" when the market is inside "overbought and oversold" regions in the form of "buy or sell" signals. This indicator comes with many customization options mentioned in the parameter section below, user can customise these parameters as needful. Join our   MQL5 group , where we share important news and updates. You are also welcome to join our private channel as well, contact me for the pri
FREE
This indicator is stand alone version from  MP Pivot Levels  (All in one) containing Demark's Pivots. Calculations:     PP = X / 4     R1 = X / 2 - LOWprev     S1 = X / 2 - HIGHprev Uses: When the pair currency price may change the direction of movement. Possible constraints of support and resistance that creates plateaus for the currency pair prices. Tendency identification by comparing the present prices according to current day's pivot point and also the prior day's pivot points. ___________
FREE
VWAP Indicator
LUC JACOBUS A VERHEECKE
4.19 (21)
Volume Weighted Average Price (VWAP) The volume weighted average price (VWAP) is a   trading   benchmark   used by traders that gives the average price a security has traded at throughout the day, based on both volume and price. It is important because it provides traders with insight into both the trend and value of a security. This indicator VWAP V2 is free and is the manual version of the extended Easy VWAP indicator (30 Euro), where the date and time properties are automatically entered. Wit
FREE
Wave Box Market Frenquency
Jean Jacques Huve Ribeiro
4.83 (6)
Totally linked to the result of a movement and the duration he had. Its height records how many ticks the asset walked during a given movement, its width shows us the duration that movement had. Its configuration must be in line with the Weis Wave Indicator configuration to observe the movement force and can indicate a possible accumulation or distribution of the movement;
FREE
Cybertrade Keltner Channels - MT5 Created by Chester Keltner, this is a volatility indicator used by technical analysis. It is possible to follow the trend of financial asset prices and generate support and resistance patterns. In addition, envelopes are a way of tracking volatility in order to identify opportunities to buy and sell these assets. It works on periods longer than the period visible on the chart. All values ​​are available in the form of buffers to simplify possible automations.
FREE
Donchian Pro
Paulo Henrique Faquineli Garcia
5 (2)
The Donchian Channel Channels are among the most popular tools of technical analysis, as they visually convey to the analyst the limits within which most price movement tends to occur. Channel users know that valuable information can be obtained at any time, whether prices are in the central region of a band or close to one of the border lines. One of the best known techniques to explore these concepts is Bollinger Bands. However, John Bollinger was not the only one to research the applicatio
FREE
Equidistant bands indicator with calculated moving average, allows you to configure the band size and can be used freely as an entry / exit indicator. Buffer 0 = price, buffer 1 = upper band, buffer 2 = lower band. you can also configure the periods of moving averages used in the calculations and also the shift to previous bars in addition to the price that can CLOSE (default) or OPEN. Excellent for fast daily moving pairs and frequent returns.
FREE
Are you tired of drawing trendlines every time you're analyzing charts? Or perhaps you would like more consistency in your technical analysis. Then this is for you. This indicator will draw trend lines automatically when dropped on a chart. How it works Works similar to standard deviation channel found on mt4 and mt5. It has 2 parameters: 1. Starting Bar 2. Number of bars for calculation The   starting bar   is the bar which drawing of the trend lines will begin, while the   number of bars for c
FREE
VWAP Simple
Deibson Carvalho
4.03 (33)
The Volume Weighted Average Price is similar to a moving average, except volume is included to weight the average price over a period.    Volume-Weighted Average Price [VWAP] is a dynamic, weighted average designed to more accurately reflect  a security’s true average price over a given period . Mathematically, VWAP is the summation of money (i.e., Volume x Price) transacted divided by the total volume over any time horizon, typically from market open to market close. VWAP reflects the capital
FREE
An indicator for analyzing different currency pairs simultaneously Forex is a complex market that requires several currency pairs to be analyzed simultaneously Determine the number of currency pairs yourself Determine the currency pair you want to analyze to analyze 4 of the most important and similar currency pairs at the same time. For direct and simple analysis, some currency pairs have changed (EURUSD>>>USDEUR) Do not doubt that to succeed in this market, you must analyze several currency pa
FREE
Swiss CandleTime What ist CandleTime for This indicaor just displays the remaining time for a candle to build. It is best used if you trade with timframes from 3 minutes. I use it in M3 to keep postions. If I have two following red candles i usually liquidate the position. Timeframes M1 to H1 Inputs Arrow displayed => Edit your arrow string Arrow for waiting conditions => Arrow if chart is offline Text Color => color of the text Tell if there is a trend change => tells you, if the two preciding
FREE
Value Chart Candlesticks
Flavio Javier Jarabeck
4.67 (9)
The idea of a Value Chart indicator was presented in the very good book I read back in 2020 , " Dynamic Trading Indicators: Winning with Value Charts and Price Action Profile ", from the authors Mark Helweg and David Stendahl. The idea is simple and the result is pure genius: Present candlestick Price analysis in a detrended way! HOW TO READ THIS INDICATOR Look for Overbought and Oversold levels. Of course, you will need to test the settings a lot to find the "correct" one for your approach.
FREE
Shape Pack MT5
John Louis Fernando Diamante
This indicator provides common shapes as drawing object options. The shapes are rotatable, resizable, draggable, and will keep their proportions (according to their handle trendline) across different chart scales. Multiple drawings are supported. Shapes: Square Rhombus Triangle (quadrilateral & isosceles) Circle (grid, overlapped grid, flexi grid, rotatable grid, concentric circles) Features: rays (all object edges will be rays) show/hide each individual drawing type, or all delete last drawn
FREE
The concept is simple: Plotting Price behavior within several periods of time. Some Symbols behave very well during the trading day - with this I mean Intraday trading - and this behavior ends up plotting effectively well with the proposed Exponential Moving Averages in this indicator... Obviously that this behavior could not be seen in all Symbols, but you can give it a try... Just drop this indicator in a chart and you will see for yourself... This indicator is intended for "Feeling the Trend
FREE
これは、ほぼ10年前に初めて公開された私の有名なスキャルパー、ゴールドフィンチEAの最新版です。短期間で起こる急激なボラティリティの拡大で市場をスキャルピングします。突然の価格上昇の後、価格変動の慣性を利用しようとします。この新しいバージョンは、トレーダーがテスターの最適化機能を簡単に使用して最適な取引パラメーターを見つけられるように簡素化されています。 [ インストールガイド | 更新ガイド | トラブルシューティング | よくある質問 | すべての製品 ] 最適化を容易にするシンプルな入力パラメーター カスタマイズ可能な取引管理設定 取引セッションの選択 平日の選択 資金管理 注意してください... 多くの要因が見返りを台無しにする可能性があるため、ダニのダフ屋は危険です。変動スプレッドとスリッページは、取引の数学的期待値を低下させ、ブローカーからの低いティック密度は幻の取引を引き起こす可能性があり、ストップレベルは利益を確保する能力を損ない、ネットワークラグはリクオートを意味します。注意が必要です。 バックテスト Expert Advisorはティックデータのみを使
FREE
すべてのストラテジーをスキャンし、選択したアクティブのすべてのタイムフレームでの買いポイントと売りポイントを表示するスキャナーをお持ちになったことはありますか? それがまさにこのスキャナーが行うことです。このスキャナーは、 Rule Plotter: プログラミング不要のストラテジー作成ツール で作成した買いシグナルと売りシグナルを表示し、さまざまなアクティブとタイムフレームで実行するために設計されています。 Rule Plotterのデフォルトストラテジーは陽線と陰線だけです。つまり、Rule Plotter内に何のストラテジーも描かない場合、このスキャナーは選択したアクティブのすべてのタイムフレームでのキャンドルの色を表示します。キャンドルが陰線の場合は赤で、陽線の場合は緑です。 好きなだけストラテジーを作成 標準のストラテジーに制限されることはありません。Metatraderで利用可能なすべての指標を使用して従来のストラテジーを構築するか、お好きな指標を使用してカスタムストラテジーを構築できます。 このスキャナーはRule Plotterが提供するもののほんの一部であり、Rule
FREE
Swiss VWAPsimple Motivation Did not find free VWAP that works, the one that I found craseh. So I created a VWAP which calculates values only for the actual day. So computer resouces are not over stressed. What is VWAP, how is it used?  VWAP stands for Volume Weighed Average Price, it calculates the running sum of tick volume and the runnung sum of price times tickvolume. The division of these sums result in a weighed price (Sum P*V/Sum V). The calculation starts normally at midnight. The value
FREE
Spike Catch Pro 22:03 release updates Advanced engine for searching trade entries in all Boom and Crash pairs (300,500 and 1000) Programmed strategies improvements Mx_Spikes (to combine Mxd,Mxc and Mxe), Tx_Spikes,   RegularSpikes,   Litho_System,   Dx_System,   Md_System,   MaCross,   Omx_Entry(OP),  Atx1_Spikes(OP),   Oxc_Retracement (AT),M_PullBack(AT) we have added an arrow on strategy identification, this will help also in the visual manual backtesting of the included strategies and see h
FREE
A countdown timer for the  Volume bar chart generator  and  Tick chart generator  products, which are available for download from the MQL5 Market: Tick chart generator: https://www.mql5.com/en/market/product/29215 Volume bar chart generator: https://www.mql5.com/en/market/product/47197 The counter conveniently displays the number of ticks or transactions (depending on the chart) that need to pass for a new bar to start printing. The user can set the following indicator inputs. Volume type
FREE
Dieser Expert Advisor ist ein Trendfolge Roboter. Der Expert Advisor hat sehr viele Einstellungen und sollte im H1 EURUSD eingesetzt werden.  Es ist auch möglich diesen Roboter GBP zu verwenden, auch sind andere Timeframes möglich.  Nachdem sehr viele Einstellungen möglich sind, kann sehr viel getestet werden.  Ziehl ist es mit diesem Roboter langfristig erfolgreich zu sein.
FREE
Supertrendingsignal
OTAVIO AGUIAR CAMPOS Aguiar
O indicador Supertrendingsignal imprime um sinal na tela indicando início de uma forte tendência. O sinal não mostra o ponto de entrada com melhor risco retorno, apenas faz a indicação de uma forte tendência.  Foi idealizado a partir de um conjunto de médias móveis e volume. Parametros: Periodmalongo: Períodos da média longa Periodmamedio: Períodos da segunda media Periodmamedio2: Perídos da terceira media Periodmacurto: Períodos da média curta. PeriodATR: Períodos do indicador ATR para adequar
FREE
Bar Countdown
Mario Antonio Oliveira
4.8 (5)
Bar Countdown is a simple indicator for MetaTrader 5 that shows the time remaining of the each candle. It can be placed in any corner of the chart or near of the price close and it'll help you to know if the current candle is ending. Choose the counter format between HR:MIN:SEC and MIN:SEC It is so easy to use, configure the color, size and counter position on the chart and that's it!!! The Countdown starts now! Updates: 2021/02/28; v1.0: Initial release 2021/03/16; v1.1: Minor code changes
FREE
GiGa FX
Fabio Sorrentino
GiGa FX is designed to work on EURUSD Subscribe   to our new channel for   promo/FREE  and   updates! :  https://www.mql5.com/it/channels/genkidamasolutions Subscribe  to profile to get new   announcements   and look behind the scenes!  https://www.mql5.com/en/users/asodoco Please support us to building FREE EAs! Leave a review ! Thank you Recommendations Timeframe: H1 Symbol:  EURUSD An  Ecn  broker is always recommended A low latency   vps   is always recommended. The recommended Leverage a
FREE
Stackable VWAP
Flavio Javier Jarabeck
3.33 (6)
Volume Weighted Average Price (VWAP) is a trading benchmark commonly used by Big Players that gives the average price a Symbol has traded throughout the day. It is based on both Volume and price. Additionally we put in this indicator the MVWAP (Moving Volume Weighted Average Price). For those who do not know the usage and the importance od this indicator I recommend a great article about this subject at Investopedia ( https://www.investopedia.com/articles/trading/11/trading-with-vwap-mvwap.asp
FREE
Spread Viewer
Aurelio Miguel Machado Da Silva
4 (1)
FREE
This Mt5 Indicator Signals when there is two opposite direction bars engulfed by current bar.  has a recent Exponential Moving Average Cross and past bar was oversold/bought Expert Advisor Available in Comments  Free Version Here : https://www.mql5.com/en/market/product/110114?source=Site&nbsp ; Full Alerts for mt5 terminal , phone , email, print to file, print to journal  Buy Signal ( blue line ) Past ema cross ( set at 30 bars back ) Past bar rsi is oversold ( level 40  ) Engulfing bar closes
FREE
Candle Zones
Flavio Javier Jarabeck
5 (1)
You probably heard about Candlesticks behaviors, which in most of the times could denote and trace Volume behaviors even if you are not watching Volume itself... Well, this indicator will do this. Naked traders love to rely solely on candlesticks patterns and with Candle Zones you can trap special patterns and DRAW THEM on your chart. As simple as that. There are several filters you can tweak in order to achieve the analysis you want. Just give it a try. After several months of testing, we think
FREE
Combining the best of Price Action , Directional Movement , and Divergence/Convergence analysis, Candle Color Trend is a easy and reliable way to identify trend direction. The indicator automatically paints the candles according to the assumption that an uptrend is defined by prices that form a series of higher highs and higher lows. In contrast, a downtrend is defined by prices that form a series of lower highs and lower lows. Additionally, ADX Wilder indicator is used to measure trend weakness
FREE
このプロダクトを購入した人は以下も購入しています
まず第一に、このトレーディングシステムがノンリペイント、ノンリドロー、ノンラグのインジケーターであることを強調する価値がある。これにより、手動取引とロボット取引の両方に理想的なものになっています。 「スマートトレンドトレーディングシステム MT5」は、新規および経験豊富なトレーダー向けにカスタマイズされた包括的なトレーディングソリューションです。10以上のプレミアムインジケーターを組み合わせ、7つ以上の堅実なトレーディング戦略を備えており、多様な市場状況に対応する多目的な選択肢となっています。 トレンドフォロー戦略:トレンドを効果的に乗り越えるための正確なエントリーとストップロス管理を提供します。 リバーサル戦略:潜在的なトレンドの反転を特定し、トレーダーがレンジ相場を活用できるようにします。 スキャルピング戦略:高速で正確なデイトレードおよび短期取引のために設計されています。 安定性:すべてのインジケーターはノンリペイント、ノンリドロー、ノンラグであり、信頼性の高いシグナルを保証します。 カスタマイズ:個々の取引の嗜好に合わせたカスタム戦略をサポートします。7つ以上の戦略と組み合わせ
まず第一に、この取引インジケーターは再描画されず、再描画されず、遅延しないことを強調する価値があります。これにより、手動取引とロボット取引の両方に理想的なものになります。 アトミックアナリストは、価格の強さとモメンタムを利用して市場でより良いエッジを見つけるためのPA価格アクションインジケーターです。ノイズや誤ったシグナルを除去し、取引ポテンシャルを高めるための高度なフィルターを備えています。複雑なインジケーターの複数のレイヤーを使用して、アトミックアナリストはチャートをスキャンし、複雑な数学的計算をシンプルなシグナルと色に変換します。これにより、どのような初心者トレーダーでも理解して使用し、一貫した取引の決定を行うことができます。 「アトミックアナリスト」は、新規および経験豊富なトレーダー向けにカスタマイズされた包括的な取引ソリューションです。プレミアムインジケーターとトップノッチの機能を1つの取引戦略に組み合わせ、すべてのタイプのトレーダーにとって汎用性のある選択肢にします。 デイリートレーディングとスキャルピング戦略:高速で正確なデイトレーディングおよび短期トレード
FX Volume MT5
Daniel Stein
4.94 (17)
mql5と Telegramの モーニング・ブリーフィングで、詳細とスクリーンショットを含む毎日のマーケット・アップデートをご覧 ください! FX Volumeは、ブローカーの視点から市場のセンチメントをリアルに洞察する、最初で唯一の出来高インジケーターです。 ブローカーのような機関投資家が外国為替市場でどのようなポジションをとっているか、COTレポートよりもはるかに速く、素晴らしい洞察を提供します。 この情報をチャート上で直接見ることは、あなたの取引にとって真のゲームチェンジャーであり、画期的なソリューションです。 以下のようなユニークなマーケットデータ洞察から利益を得てください。 比率は 、通貨のロングポジションとショートポジションの比率をパーセントで表示します。 比率の変化は 、選択した期間内のロング比率とその変化率を表示します。 Volumes Totalは 、通貨の取引量(ロングとショート)の合計をロット単位で表示します。 Volumes Long :全通貨のロングポジションの取引量を表示します。 Volumes(ショート )は、全通貨のショートポジションの取引量を表示
ご紹介   クォンタム トレンド スナイパー インジケーターは 、トレンド反転を特定して取引する方法を変革する画期的な MQL5 インジケーターです。 13年以上の取引経験を持つ経験豊富なトレーダーのチームによって開発されました。     クォンタムトレンドスナイパーインジケーター   は、非常に高い精度でトレンドの反転を識別する革新的な方法で、あなたのトレーディングの旅を新たな高みに押し上げるように設計されています。 ***Quantum Trend Sniper Indicatorを購入すると、Quantum Breakout Indicatorを無料で入手できます!*** クォンタム ブレイクアウト インジケーターは、トレンドの反転を特定するとアラートを発し、矢印を示し、3 つのテイクプロフィットレベルを提案します。 初心者トレーダーにもプロのトレーダーにも適しています。 量子EAチャネル:       ここをクリック MT4のバージョン:       ここをクリック 推奨事項: 期間:すべての時間枠。最良の結果を得るには、M
トレンド スクリーナー インジケーターでトレンド取引の力を解き放ちます。ファジー ロジックと複数通貨システムを活用した究極のトレンド取引ソリューションです。 ファジー ロジックを活用した革新的なトレンド インジケーターである Trend Screener を使用して、トレンド取引を向上させます。 これは、13 を超えるプレミアム ツールと機能、および 3 つの取引戦略を組み合わせた強力なトレンド追跡インジケーターであり、Metatrader をトレンド アナライザーにする多用途の選択肢となります。 期間限定オファー : トレンド スクリーナー インジケーターは、わずか 50 ドルで生涯ご利用いただけます。 (元の価格 125$ ) (オファー延長) Trend Screener の 100% 非再描画精度の揺るぎない精度を体験して、取引の決定が過去の価格変動の影響を受けないようにしてください。 マルチタイムフレームおよびマルチ通貨機能の多用途性を解放し、比類のない自信を持って外国為替、商品、暗号通貨、インデックスの世界を取引できるようにします。 Trend Screener の包括的な
Gold Stuff mt5
Vasiliy Strukov
4.89 (166)
Gold Stuff mt5 は、金専用に設計されたトレンド指標であり、あらゆる金融商品にも使用できます。 インジケーターは再描画せず、遅れません。 推奨時間枠 H1. 設定と個人的なボーナスを得るために、購入後すぐに私に連絡してください!   設定 矢印を描く - オンオフ。 チャートに矢印を描く。 アラート - 可聴アラートのオンオフ。 メール通知 - オンオフ。 電子メール通知。 プチ通知 - オンオフ。 プッシュ通知。 次に、色域を調整します。 Gold Stuff mt5 は、金専用に設計されたトレンド指標であり、あらゆる金融商品にも使用できます。 インジケーターは再描画せず、遅れません。 推奨時間枠 H1. 設定と個人的なボーナスを得るために、購入後すぐに私に連絡してください!   設定 矢印を描く - オンオフ。 チャートに矢印を描く。 アラート - 可聴アラートのオンオフ。 メール通知 - オンオフ。 電子メール通知。 プチ通知 - オンオフ。 プッシュ通知。 次に、色域を調整します。
まず第一に、この取引ツールはノンリペイント、ノンリドロー、ノンラグの指標であり、プロの取引に理想的ですことを強調する価値があります。 スマートプライスアクションコンセプトインジケーターは、新米から経験豊富なトレーダーまで、非常 に強力なツールです。Inner Circle Trader AnalysisやSmart Money Concepts Trading Strategiesなど、20以上の有用な指標を1つに組み合わせています。このインジケーターはスマートマネーコンセプトに焦点を当て、大手機関の取引方法を提供し、彼らの動きを予測するのに役立ちます。 特に、流動性分析に優れており、機関がどのように取引しているかを理解しやすくしています。市場のトレンドを予測し、価格の動きを慎重に分析するのに優れています。機関の戦略とトレードを合わせることで、市場の動向についてより正確な予測ができます。このインジケーターは多目的であり、市場構造を分析し、重要な注文ブロックを特定し、さまざまなパターンを認識するのに優れています。 このインジケーターはBOSやCHoCHなどのパターンの識
これはMT5のインジケーターで、再描画なしで取引に参入するための正確なシグナルを提供します。 外国為替、暗号通貨、金属、株式、インデックスなど、あらゆる金融資産に適用できます。かなり正確な見積もりを提供し、取引を開始して終了するのに最適な時期を教えてくれます。1つのシグナルを処理しただけでインジケーターの元が取れた例の 動画 (6:22)をご覧ください。Entry PointsPro インジケーターの助けを借りたほとんどのトレーダーの最初の1週間の結果が改善しています。 Telegramグループ に登録してください。Entry Points Proインジケーターのメリットは次の通りです。 再描画のないエントリーシグナル 再描画されるインジケーターでは一度表示されたシグナルが削除されて大きな金銭的損失につながることがありますが、これと異なり、表示されて確認されたシグナルは消えることがありません。 エラーなしの取引開始 インジケーターアルゴリズムによって取引を開始する(資産を売買する)理想的な瞬間を見つけることができます。それを使用するすべてのトレーダーの成功率が向上します。
mql5と Telegramの モーニング・ブリーフィングで、詳細とスクリーンショットを含む毎日のマーケット・アップデートをご覧 ください! FX Power MT5 NGは 、長年の人気を誇る通貨強度計FX Powerの次世代モデルです。 この次世代ストレングスメーターは何を提供するのでしょうか?初代FXパワーの魅力すべて プラス GOLD/XAUの強さ分析 より正確な計算結果 個別に設定可能な分析期間 カスタマイズ可能な計算上限値により、さらに優れたパフォーマンスを実現 もっと見たい人のための特別なマルチインスタンス設定 すべてのチャートでお好みの色を無限に設定可能 数え切れないほどの通知オプションにより、重要なことを見逃すことはありません。 Windows 11とmacOSのスタイルで角を丸くした新しいデザイン 魔法のように動くインジケーターパネル FXパワーの主な機能 すべての主要通貨の強さの完全な履歴 すべての時間枠における通貨の強さの履歴 すべてのブローカーとチャートで同一の計算結果 100%信頼できるリアルタイム計算 -> リペイントなし ドロップダウン・リストから
今、147ドル(いくつかの更新後に499ドルに増加します) - 無制限のアカウント(PCSまたはMac) RelicusRoad ユーザー マニュアル + トレーニング ビデオ + プライベート Discord グループへのアクセス + VIP ステータス 市場の新しい見方 RelicusRoad は、外国為替、先物、暗号通貨、株式、および指数の世界で最も強力な取引インジケーターであり、トレーダーに収益を維持するために必要なすべての情報とツールを提供します。初心者から上級者まで、すべてのトレーダーが成功するためのテクニカル分析と取引計画を提供します。これは、将来の市場を予測するのに十分な情報を提供する重要な取引指標です。意味をなさないチャート上のいくつかの異なる指標ではなく、完全な解決策を信じています.これは、信号、矢印 + 価格アクション情報を表示するオールインワンのインジケーターで、他に類を見ない非常に正確です。 強力な AI に基づいて、RelicusRoad は不足している情報とツールを提供して、あなたを教育し、トレーディングのプロ、成功したトレーダーにします。
Auto Order Block with break of structure based on ICT and Smart Money Concepts Futures Break of Structure ( BoS )             Order block ( OB )            Higher time frame Order block / Point of Interest ( POI )    shown on current chart           Fair value Gap ( FVG ) / Imbalance   ,  MTF      ( Multi Time Frame )    Volume Imbalance     ,  MTF          vIMB Gap’s Equal High / Low’s     ,  MTF             EQH / EQL Liquidity               Current Day High / Low           HOD /
Step into the realm of Forex trading with confidence and precision using XQ, a cutting-edge Forex indicator designed to elevate your trading game to unprecedented heights. Whether you're a seasoned trader or just stepping into the world of currency exchange, XQ Forex Indicator empowers you with the insights and signals needed to make informed trading decisions. The signal conditions are a combination of three indicators, and XQ Forex Indicator only display  medium and long-term trends . The ind
Was: $299  Now: $99   Supply Demand uses previous price action to identify potential imbalances between buyers and sellers. The key is to identify the better odds zones, not just the untouched ones. Blahtech Supply Demand indicator delivers functionality previously unavailable on any trading platform. This 4-in-1 indicator not only highlights the higher probability zones using a multi-criteria strength engine, but also combines it with multi-timeframe trend analysis, previously confirmed swings
現在33%オフ 初心者にもエキスパートトレーダーにも最適なソリューション このインジケーターは独自の機能と新しい公式を多数内蔵しており、ユニークで高品質かつ手頃な取引ツールです。このアップデートでは、2つの時間枠ゾーンを表示できるようになります。より長いTFだけでなく、チャートTFとより長いTF(ネストゾーンを表示)の両方を表示できます。すべてのSupply Demandトレーダーの皆さんのお気に召すはずです。:) 重要情報の公開 Advanced Supply Demandの可能性を最大化するには、 https://www.mql5.com/ja/blogs/post/720245 にアクセスしてください。   エントリーまたはターゲットの正確なトリガーポイントを正確に特定できれば取引がどのように改善されるか想像してみてください。新しい基盤となるアルゴリズムに基づいて構築されているため、買い手と売り手の間の潜在的な不均衡をさらに簡単に特定できます。これは、最も強い需要と供給のゾーンと、過去のパフォーマンス(古いゾーンを表示)がグラフィカルに表現されるためです。これらの機能は、最適
ICT, SMC, SMART MONEY CONCEPTS, SMART MONEY, Smart Money Concept, Support and Resistance, Trend Analysis, Price Action, Market Structure, Order Blocks, BOS/CHoCH,   Breaker Blocks ,  Momentum Shift,   Supply&Demand Zone/Order Blocks , Strong Imbalance,   HH/LL/HL/LH,    Fair Value Gap, FVG,  Premium  &   Discount   Zones, Fibonacci Retracement, OTE, Buy Side Liquidity, Sell Side Liquidity, BSL/SSL Taken, Equal Highs & Lows, MTF Dashboard, Multiple Time Frame, BigBar, HTF OB, HTF Market Structure
Gannスクエアインジケーターは、W.D. Gannによって執筆された「市場予測のための数学的な式」の記事に基づく強力な市場分析ツールです。このツールは、解析に数学的な概念を応用し、Gann理論に基づいています。それは、144、90、52のスクエアや9のスクエアなど、Gannの関連テクニックの要素を取り入れています。さらに、の方法を組み込んでおり、9のスクエアとその関連性についてのチャネルやスターパターンに焦点を当てています。 ユーザーマニュアルと使用方法: このインジケーターを使用する前に、ユーザーマニュアルを読んで疑問点を解決するためにお問い合わせいただくことをお勧めします。ユーザーマニュアルの完全版は、当社のウェブサイトで入手できます。 MT5の完全版は購入できますし、MT4の無料版も試すことができます。両方のバージョンへのリンクを提供していますので、ご利用ください。 主な機能と機能: Gannスクエアインジケーターは、市場分析のための完全なツールセットを提供し、幾何学的な概念とGann理論に基づいて的確な判断を行う手助けをします。以下に主な機能を示します。 9のスクエアの分析:
AW Trend Predictor MT5
AW Trading Software Limited
4.76 (54)
1 つのシステムでのトレンド レベルとブレイクダウン レベルの組み合わせ。高度なインジケーター アルゴリズムは、市場のノイズをフィルター処理し、トレンド、エントリー ポイント、および可能なエグジット レベルを決定します。インジケーターシグナルは統計モジュールに記録されるため、最適なツールを選択してシグナル履歴の有効性を示すことができます。この指標は、テイクプロフィットとストップロスのマークを計算します。 マニュアルと説明書 ->   ここ / MT4 バージョン ->   ここ インジケーターで取引する方法: Trend Predictor での取引は、たった 3 つの簡単なステップです。 ステップ 1 - ポジションを開く 70% 以上の成功率で買いシグナルが受信されました ステップ 2 - ストップロスの決定 逆信号でトランクを選択 ステップ 3 - テイクプロフィット戦略の定義 戦略 1: TP1 に到達したらポジション全体をクローズする 戦略 2: TP1 に達した時点でポジションの 50% をクローズし、TP2 に達した時点で残りの 50% をクローズします。 戦略 3:
ブレーカートレーダーになり、価格が反転すると市場構造からの利益が変化します。 注文ブロックブレーカーインジケーターは、トレンドまたは価格の動きが枯渇に近づいており、逆転の準備ができていることを識別します。通常、反転または大規模なプルバックが発生しようとしているときに発生する市場構造の変化について警告します。 この指標は、ブレイクアウトと価格の勢いを識別する独自の計算を使用します。使い果たされる可能性のあるポイントの近くで新しい高値が形成されるたびに、インディケーターはその高値の作成を担当する最後の注文ブロックを描きます。次に、移動する価格とともに注文ブロックを追跡します。その後、価格が反対方向にシフトし、その注文ブロックを突破すると、新しい市場構造を作成し、トレンドまたは大きな後退の可能性のある反転の開始を警告します。 注文ブロックは、高値/安値が作成される前の最後の反対色のろうそくであり、価格がこれらの重要な領域を下抜けすると、トレンドの短期的ま​​たは長期的な反転の兆候です。 特徴 重要な枯渇点での市場構造の変化を警告します 価格が使い果たされるレベルに近づくと、
The Volume by Price Indicator for MetaTrader 5 features Volume Profile and Market Profile TPO (Time Price Opportunity). Get valuable insights out of currencies, equities and commodities data. Gain an edge trading financial markets. Volume and TPO histogram bar and line charts. Volume Footprint charts. TPO letter and block marker charts including split structures. Versatile segmentation and compositing methods. Static, dynamic and flexible ranges with relative and/or absolute visualizations. Lay
ご紹介     Quantum Breakout PRO は 、ブレイクアウト ゾーンの取引方法を変革する画期的な MQL5 インジケーターです。 13年以上の取引経験を持つ経験豊富なトレーダーのチームによって開発されました。     クォンタム ブレイクアウト プロ   は、革新的でダイナミックなブレイクアウト ゾーン戦略により、あなたのトレーディングの旅を新たな高みに押し上げるように設計されています。 クォンタム ブレイクアウト インジケーターは、5 つの利益ターゲット ゾーンを備えたブレイクアウト ゾーン上のシグナル矢印と、ブレイクアウト ボックスに基づいたストップロスの提案を提供します。 初心者トレーダーにもプロのトレーダーにも適しています。 量子EAチャネル:       ここをクリック 重要!購入後、インストールマニュアルを受け取るためにプライベートメッセージを送ってください。 推奨事項: 時間枠: M15 通貨ペア: GBPJPY、EURJPY、USDJPY、NZDUSD、XAUUSD アカウントの種類: ECN、Raw、またはス
TrendLine PRO MT5
Evgenii Aksenov
4.78 (49)
The Trend Line PRO indicator is an independent trading strategy. It shows the trend change, the entry point to the transaction, as well as automatically calculates three levels of Take Profit and Stop Loss protection Trend Line PRO is perfect for all Meta Trader symbols: currencies, metals, cryptocurrencies, stocks and indices Advantages of Trend Line PRO Never redraws its signals The possibility of using it as an independent strategy It has three automatic levels Take Profit and Stop Loss lev
MT4版  |  FAQ Owl Smart Levels Indicator は、 Bill Williams の高度なフラクタル、市場の正しい波構造を構築する Valable ZigZag、エントリの正確なレベルをマークする Fibonacci レベルなどの一般的な市場分析ツールを含む 1 つのインジケーター内の完全な取引システムです。 利益を得るために市場と場所に。 戦略の詳細な説明 インジケータを操作するための指示 顧問-取引助手 プライベートユーザーチャット ->購入後に私に書いて、私はプライベートチャットにあなたを追加し、あなたはそこにすべてのボーナスをダウンロードすることができます 力はシンプルさにあります! Owl Smart Levels 取引システムは非常に使いやすいので、専門家にも、市場を勉強し始めて自分で取引戦略を選択し始めたばかりの人にも適しています。 戦略と指標に秘密の数式や計算方法が隠されているわけではなく、すべての戦略指標は公開されています。 Owl Smart Levels を使用すると、取引を開始するためのシグナルをすばやく確認し、注文を出すため
Gartley Hunter Multi - An indicator for searching for harmonic patterns simultaneously on dozens of trading instruments and on all classic timeframes: (m1, m5, m15, m30, H1, H4, D1, Wk, Mn). Manual (Be sure to read before purchasing) | Version for MT4 Advantages 1. Patterns: Gartley, Butterfly, Shark, Crab. Bat, Alternate Bat, Deep Crab, Cypher 2. Simultaneous search for patterns on dozens of trading instruments and on all classic timeframes 3. Search for patterns of all possible sizes. Fr
トレンドラインマップインジケーターは、トレンドスクリーナーインジケーターのアドオンです。トレンドスクリーナー(トレンドラインシグナル)によって生成されたすべてのシグナルのスキャナーとして機能します。 これは、トレンドスクリーナーインジケーターに基づくトレンドラインスキャナーです。 Trend Screener Pro インジケーターがない場合、Trend Line Map Proは機能しません。 It's a Trend Line Scanner based on Trend Screener Indicator. If you don't have Trend Screener Pro Indicator,     the Trend Line Map Pro will not work . ブログにアクセスすると、トレンドラインマップインジケーターの無料バージョンをダウンロードできます。 Metatrader Testerの制限なしで、購入する前に試してみてください。 :  ここをクリック 1.簡単になる利点 通貨と時間枠に基づいて売買シグナルを表示し
TrendDecoder Premium MT5
Christophe, Pa Trouillas
5 (1)
レンジと次の動きを特定     |    トレンドの最も早いシグナルと強さを得る     |    反転の前に明確な出口を得る     |    価格がテストするフィボ・レベルを見つける。   |  非リペイント、非遅延インディケータ - マニュアルおよび自動売買に最適 - すべての資産、すべての時間単位に対応 - 発売記念50%割引   - その後 149 ドルに戻る 購入後、 推奨セッティングについては、このチャンネルで私に連絡してください。 MT4 バージョン: ここをクリック BladeSCALPER と PowerZONES を使った完全な方法を入手する どのようなものですか? TrendDECODERは、トレンド監視をシンプルかつ簡単にするための複数のイノベーションを集約したものです。 Projective TrendLine (投影トレンドライン) - 今後のトレンドのスピードリファレンス RealTime TrendLine vs. Projective TrendLine (リアルタイムトレンドライン vs. Projective Tren
MetaBands M5
Vahidreza Heidar Gholami
4.67 (3)
MetaBandsは、強力でユニークなアルゴリズムを使用してチャンネルを描画し、トレンドを検出して、トレーダーに取引の入出ポイントを提供することができます。チャンネル指標に加えて、強力なトレンド指標でもあります。入力パラメータを使用して新しいチャンネルを作成するために、異なるタイプのチャンネルを統合することができます。MetaBandsは、市場のイベントについてユーザーに通知するために、すべてのタイプのアラートを使用します。 特徴 ほとんどのチャンネルアルゴリズムをサポート 強力なトレンド検出アルゴリズム 異なるタイプのチャンネルを統合する能力 マルチタイムフレームおよびマルチカレンシー(シグナルマトリックス) すべてのタイプのアラート機能(サウンド、画面フラッシャー、プッシュ通知、メール、ポップアップ、矢印) 再描画しない トレンド検出 MetaBandsは、チャネル内を振動する青いラインを使用してトレンドを検出します。ラインがチャネルの上部バンドに達すると、下降トレンドの開始を示し、下部バンドに達すると上昇トレンドの開始を示します。青いラインが中心ラインに近づくと、市場はコンソ
TPSpro TRENDPRO  - is a trend indicator that automatically analyzes the market and provides information about the trend and each of its changes, as well as giving signals for entering trades without redrawing! The indicator uses each candle, analyzing them separately. referring to different impulses - up or down impulse. Exact entry points into transactions for currencies, crypto, metals, stocks, indices!  -  Version MT4                  DETAILED DESCRIPTION        /       TRADING SETUPS       
Was: $249  Now: $99   Market Profile defines a number of day types that can help the trader to determine market behaviour. A key feature is the Value Area, representing the range of price action where 70% of trading took place. Understanding the Value Area can give traders valuable insight into market direction and establish the higher odds trade. It is an excellent addition to any system you may be using. Inspired by Jim Dalton’s book “Mind Over Markets”, this indicator is designed to suit the
支持線と抵抗線、そしてローソク足のギャップをチャート上に自動的に表示するため、価格が次に向かう可能性のある場所や反転する可能性のある場所を確認することができます。 このインジケーターは、私のウェブサイト(The Market Structure Trader)で教えているポジショントレード手法の一部として使用するように設計されており、ターゲットとエントリーの可能性のための重要な情報を表示します。 MT4 Version:  https://www.mql5.com/en/market/product/97246/ このインジケーターには、2つのコア機能と4つの追加機能があります: コア機能1 - 日足、週足、月足のサポートラインとレジスタンスラインの自動表示 このインジケーターは、直近2日間、最大6週間前、数ヶ月前のサポートレベルとレジスタンスレベルを自動的に引き込みます。これらのレベルの見た目は完全にカスタマイズすることができ、いくつ表示されるかを表示することもできます。これらの重要な水準は、しばしば主要な支持線と抵抗線として機能し、価格が転換して引き戻されたり反転したりする場
Golden Spikes Detector This indicator is based on an advanced strategy primarily for trading spikes on Boom and Crash Indices. Complex algorithms were implemented to detect high probability entries only. It alerts on potential Buy and Sell entries. To trade spikes on the Deriv or Binary broker, only take Buy Boom and Sell Cash alerts. It was optimised to be loaded on 5-minute timeframe although multiple timeframe analysis is done in the background. Features ·             Desktop pop up and sound
作者のその他のプロダクト
Weiss Wave with lots of functionality and lightweight. The same can be used both in markets that have access to volume (REAL=Contracts, Tick=Business) or points! You will be able to:     - Analyze the volume of the market by swings made!     - Define the source of the data presented in the graphic, its size and color! Or simply hide this information!     - Define whether or not to show the swings in the graph and how many swings! In addition to setting the trend line color, thi
Prior Cote
Ricardo Rodrigues Lucca
In this indicator you choice a data to be used from yesterday (high, low, open, close, etc) to automatically draw an line to be the zero. And, from that a percentage deviation ("Percentage to be used") is calculated and used to draw others line to both side until a limit be reached. Both sides can have diferrent colours as show in screenshots. Also, more than one indicator can be used at same time.
FREE
Moving Ratio
Ricardo Rodrigues Lucca
"Moving Ratio Candle" is used to check the distance of a candle to a theoretical pressure point. Furthermore, we have two points of interest, the first for the mean and the second for the median. This indicator uses the shape of bars and the line that crosses the bar from left to right is based on the calculation of the closing price for both sides. The rest follows a more standard calculation. The same could be done as a line, but I want to know the behavior of this indicator in relation to the
FREE
Stormer RSI 2
Ricardo Rodrigues Lucca
This strategy was learned from Stormer to be used on B3. Basically, 15 minutes before closing the market, it will check RSI and decided if it will open an position. This strategy do not define a stop loss. If the take profit reach the entry price it will close at market the position. The same happens if the maximal number of days is reached. It is created to brazilian people, so all configuration are in portuguese. Sorry Activations allowed have been set to 50.
フィルタ:
Mustafa Nail Sertoglu
1046
Mustafa Nail Sertoglu 2023.12.02 17:25 
 

Trying to get the logic and coordination with my trading style, thx for sharing

Ricardo Rodrigues Lucca
3949
開発者からの返信 Ricardo Rodrigues Lucca 2023.12.03 05:05
Thank you for review it.
EduAp Consist Trader
121
EduAp Consist Trader 2022.03.23 14:37 
 

Repinta?

Ricardo Rodrigues Lucca
3949
開発者からの返信 Ricardo Rodrigues Lucca 2022.03.23 17:10
Sim.
jleiton
94
jleiton 2022.02.17 02:40 
 

Really easy to set up and accurate. Thank you

Aleksandr Tamonin
4109
Aleksandr Tamonin 2021.01.24 12:07 
 

Отличный инструмент можно использовать совместно с другими индикаторами, спасибо.

Ricardo Rodrigues Lucca
3949
開発者からの返信 Ricardo Rodrigues Lucca 2021.01.24 13:47
Thank you.
レビューに返信
バージョン 1.1 2021.04.06
In this version, It was included alert to call your attention. It can be with pop-up alert (calling alert function) or without it when the boolean flag is kept false. Also, a sound can be played together with the alert message.