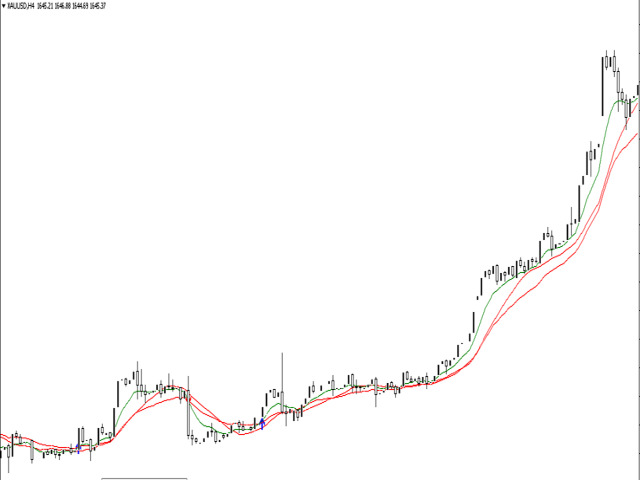
MACrosss

SETTINGS OF SLOW MA
MA period is the averaging Period for calculation 
MA shift is Shift of the indicator concerning the schedule.
Averaging method - Averaging method.
Price type - The used price.
SETTINGS OF FAST MA
MA period is the averaging Period for calculation 
MA shift is Shift of the indicator concerning the schedule.
Averaging method - Averaging method.
Price type - The used price.
OTHER SETTINGS
Arrow indent, points - An arrow space from MA.
Turn on the Alert? - to include/switch off notifications about MA crossing.
Number of notifications - Number of notifications of one crossing.
Interval between notifications, sec. - Interval between notifications, sec.
おすすめのプロダクト
This Indicator is use the ZigZag to calculate the Upper and  Lower Bound and the uptrend and the downtrned. Red for downtrend, Green for uptrend and Yellow is for the horizontal trend this horizontal trend also bookmarked the upper limited and the lower limited the the price swings.  Or in simple the Support and the Resistance level. However, You may use the Heikin Ashi to confirm the trend of the buy sell signal above. I cannot guarantee the win rate, Nevertheless, you must study well the timef
Limitless MT4は、すべての初心者と経験豊富なトレーダーに適したユニバーサルインジケーターです。 すべての通貨ペア、暗号通貨、生の株式で動作します 無制限のMT4-構成済みで、追加の構成は不要 そして今、主なもの なぜ無制限のMT4なのか? 1再描画の完全な欠如 2トレーディングの最高のスペシャリストによる2年間のテスト 3正しい信号の精度が80%を超える 4ニュースリリース中の取引で好調 取引ルール 1買いシグナル-青い上向き矢印の出現 下向きの赤い矢印の外観を販売するシグナル シグナル後の次のローソク足で取引を開始するには2 3テイクプロフィット チャート上 М1-40ピップ М5-50ピップ М15-55-60ピップ 4ストップロスは利益をとる 5誤った信号をフィルタリングするために、 パラボリックSAR-トレンドとのトレードへの参入を除外する移動平均または同様のトレンドインジケーター。 
Septermber OFFER 85% OFF next price for unlimited version will be 2500$. This is the only time you can get this institutional and professional indicator at this price for unlimited version. Don't dare to miss this. The tool I am about to introduce to you you can't compare it with other tools due to its strategy and accuracy level in predicting the next price directional movement. This tool is designed for serious traders who have decided to make a difference through trading. Be the next person t
The real market buy/Sell signals, you can trust.  This indicator tracks the trend strength, the market strength, the real current volume, and the price direction to give traders and investors the optimum point for entry in the form of signals. The time frames range from 5 minutes to one (1) hour chart. Trading on higher time frames produce the best outcomes, but also do produce less frequent trades, compared to trading on lower time frames.
Trend Indicator This Indicator detects the essential momentum in the market and lets you know when the market has a potential trend Green means we are going higher and Red Means we are going Lower,  You can customise the Line to Any Color.  The alerts come in immediately there is a potential signal Defaults Length : 55 This is the Depth of your averaging calculation. The bigger it is the more noise is filtered.  55 Is the Best Optimum Setting For This Indicator
BinaryScalping is a professional indicator for trading binary options and scalping. The algorithm of the indicator is based on the calculation of pivot points for each time period separately, the location of the price of the trading instrument relative to the pivot points is analyzed and the probability of a trading operation is calculated. The indicator has a built-in filter of trading signals based on the global trend. The indicator is installed in the usual way and works with any trading inst
1.Indicator gives key trade levels with red and green arrows. 2. You need to manually mark these trade levels on higher time frame with horizontal line or area and take the trades based on price action on  lower timeframe at these trade levels. For example, see rejection or violation of these trade levels to go along or reverse the trade. (See attached screenshot) 3. You need to manually turn off signals for lower timeframes you comfortable working with. 4. Please note that you need to manually
EARLY REMINDER: The Starting price is 65 price will rise soon up to 365$ and then 750$ after first 10 copies of sales. Grab this offer now! Introduction Hello, traders! Welcome to the demonstration of the Forex Beast Indicator , a comprehensive tool designed to assist aspiring traders in navigating the complexities of the forex market. This indicator incorporates seven essential components to provide a well-rounded trading experience: Moving Averages Colored Zones Support and Resistance Levels
Scalping Worm is an essential tool for every trader aiming to improve the accuracy of their market entries and exits. With its advanced weighted moving average formula and adaptive smoothing logic, this indicator not only captures the current trend direction but also helps determine its strength and stability. The blue line signals an uptrend, while the red line indicates a downtrend, making analysis highly intuitive and visually straightforward. The main advantage of this indicator is its abili
Insight Investor: Advanced Multi-Currency Forex Trading Bot Introduction In the fast-paced world of Forex trading, having the right tools can significantly enhance your trading experience. Insight Investor is an advanced multi-currency trading bot designed to automate and optimize your trading operations. This expert advisor employs modern algorithms to analyze market conditions and execute trades, aiming to deliver consistent results while maintaining controlled risk levels. Key Features of Ins
This advisor enters the market at the opening of   London Market . It has a automatic function that give buy (arrow up green) and sell (arrow down red) signal when the indicator met high probabilities requirements.Once the signal is generated it is the trader discretions to start the order button and do trade manually. Stop loss are base on ATR. Recommended Take profit is 20pips.  The trading system is suitable for both experienced traders and beginners.  Timeframe is  M5 . Minimum account bal
BinaryUniversal is a signal indicator for binary options and Forex. In its work, the indicator uses a complex algorithm for generating signals. Before forming a signal, the indicator analyzes volatility, candlestick patterns, important support and resistance levels. The indicator has the ability to adjust the accuracy of the signals, which makes it possible to apply this indicator for both aggressive and conservative trading. The indicator is set in the usual way, it works on any time period and
Weddell Pro is a good trading tool that is suitable for both a beginner and an experienced trader. It can be used both separately and combined with other strategies and indicators Configured for currency pairs was tested several times on cryptocurrency but did not show a high result Currency pairs USD/EUR AUD/CAD GBP/USD Showed itself very well here The percentage of correct transactions is above 68%, which does not make it perfect and bad Doesn't draw or disappear The red arrow shows a t
PairMaster Buy Sell Arrow Indicator for MT4 Trade Reversals Like a Pro — Catch Every Swing Point with Precision The PairMaster Buy Sell Arrow Indicator is a powerful MetaTrader 4 tool built to identify high-probability swing trading opportunities . Designed for traders who value accuracy, clarity, and simplicity, PairMaster detects key market turning points and plots intuitive buy and sell arrows directly on your chart. Key Features Accurate Swing Point Detection – Automatically identifies ma
SMC Venom Model BPR インジケーターは、スマート マネー (SMC) コンセプトで取引するトレーダー向けのプロフェッショナル ツールです。価格チャート上の 2 つの主要なパターンを自動的に識別します。 FVG   (フェアバリューギャップ) は、3 本のローソク足の組み合わせで、最初のローソク足と 3 番目のローソク足の間にギャップがあります。ボリュームサポートのないレベル間のゾーンを形成し、価格修正につながることがよくあります。 BPR   (バランス価格範囲) は、2 つの FVG パターンの組み合わせで、「ブリッジ」を形成します。これは、価格がボリュームアクティビティの少ない動きで動くときに、ブレイクアウトしてレベルに戻るゾーンで、ローソク足の間にギャップを作成します。 これらのパターンは、大規模な市場プレーヤーと一般参加者の相互作用が発生するチャート上のボリュームと価格動向の分析に基づいて、トレーダーが主要なサポート/レジスタンス レベル、ブレイクアウト ゾーン、エントリ ポイントを識別するのに役立ちます。 インジケーターは、長方形と矢印の形でパターンを視
ミリ秒級通貨強弱ECG指標 は実際の取引で検証済みです。この指標シグナルに従って取引を行うことで、 週間利益率50%から100% を達成できます。本指標は 限定10ライセンス のみの販売となり、完売次第販売を終了します。 以下の 1週間デモ口座 で指標の信頼性をご確認いただけます: 口座番号 :1100132996 サーバー名 :ICMarketsSC-Live11 閲覧用パスワード :Huangtao102078 核心原理: 本指標は市場の全主要通貨ペアの相対的な強弱を ミリ秒単位で定量分析・計算 し、視覚的なグラフィカルインターフェースでデータを表示します。これによりトレーダーは細部まで観察し、最適な通貨ペアを選択して取引できます。 主な利点: ヘッジングに最適な 最大強弱差を持つ通貨ペア を選定することで、リスクを効果的に軽減し収益性を向上 ミリ秒単位の市場変動と経済イベントの影響を 完全な透明性 で可視化 従来指標の技術的限界を打破: 既存市場指標の最小周期:1分 当ソリューション: 1分未満の周期を実現 従来の1分足制約を超えた 高精度トレーディング を可能に
Market Maestro: Your Ideal Partner for Automated Forex Trading If you're looking for a reliable assistant for trading in the currency market, Market Maestro is exactly what you need. This modern Forex bot is built using the latest technologies and algorithms, allowing it to effectively analyze market data and make informed trading decisions in real-time. Key Features of Market Maestro 1. Multicurrency Capability for Broad Opportunities Market Maestro can work with a wide range of currency pairs,
Accuwiser Expert Advisor We have developed a strategy for GOLD which is now available for everyone through Accuwiser Expert advisor. Tight money management and risk management have been applied to this expert. The way we handle losing trades is unique and 3 different methods are applied if any trade goes in loss. Furthermore Entering a trade is time-based and differs in various modes we recommend. Different risk levels which have been provided have no interaction with higher lot size. Only dif
Smart Gread Ultimate Edition (SGUL) indicator - based on smart order grid strategy. Maximum customization and flexibility of strategies are the main features of this indicator. In the right corner there is a table with the number and volume of orders. List of adjustable parameters: K: 2.0 - Factor of the next order increase (if the price moves in the other direction). TP: 50 - The number of points at which the order is closed with a profit (minimum profit per 1 lot). Step: 80 - The numb
Dear Traders this is my another tool called " Swing Master Indicator ". As the name above the indicator is designed to help you in swing trading by capturing the low and highs of the price. You may us this tool with any trading strategy and style from scalping to position trading. It is made for level of traders including newbies and advanced traders even prop-firms, hedge funds and banks to help them make sold market analysis. I create tools for serious traders who want to make a difference in
The Time_Price_SQ9_Degree indicator is based on the 9 Gann square. Using this indicator, you can identify strong time and price zones. The indicator displays the levels as a degree value. The degrees can be set in the settings. After launching, the MENU button appears. If it is highlighted, it can be moved to any point on the graph, and after double-clicking on it, it stops being highlighted and menu buttons appear. To hide the menu, just double-click on the button, it will become highlighted a
The FFx Dashboard MTF alerter will show you on a single chart all the timeframes (M1 to Monthly) with their own status. 2 Alert Options: Single timeframe: each selected timeframe alert separately when a signal occurs Multi timeframes: all selected timeframes must agree for an alert to be triggered Both options have an input to select the timeframes to be used for the alert(s). How to understand the status: Green/Red square: bullish/bearish candle Options available in the FFx Dashboard Alerter
Belladonna is an advanced custom technical indicator for MetaTrader 4 based on Hull Moving Average (HMA). It visualizes the trend direction using colored lines and arrows on the chart. The indicator is optimized to minimize lag and eliminate market noise, making it especially useful for short-term and medium-term trading.  Functions and Features: Moving Average Type: Hull Moving Average (based on two EMA/SMA lines). Calculation Methods: Support for different types of moving average (SMA, EMA,
Bomb Bank Signal
Igor Pereira Calil
5 (1)
Bomb Bank シグナル: MetaTrader 4 の信頼度インジケーター Bomb Bank Signal は、金融市場で最も関連性の高いトレンドを特定するように設計された MetaTrader 4 の強力なインジケーターです。動きを正確に予測するツールをお探しなら、Bomb Bank が最適です。 仕組み: このインジケーターは、出来高分析、ローソク足終値、対称トレンドという 3 つの異なる方法を組み合わせて、売買の機会を検出してシグナルを送ります。 Bomb Bank は、買いの機会を特定するときは「爆弾」のようなものであり、売りシグナルを検出するときは「ドクロ」のようなものです。 ボムバンクはなぜ違うのですか? 完全な信頼性: Bomb Bank Signal は信号を削除しません。一度シグナルが発せられると、シグナルは残り続けるので、チャンスを逃すことはありません。 極めて高い精度: Bomb Bank は誤った信号を送信しません。リアルタイムで最新情報を更新し、市場の進化に合わせて調整しながら、以前のシグナルの透明性を維持します。 ライブアップデート: シ
The Book of Changes is a product of ancient civilization and a philosophical work that highly integrates natural and social sciences in China. The Book of Changes believes that all things in heaven and earth are constantly developing, and it explains the laws of nature. This law reveals the characteristics of the entire universe, covering the attributes of all things in heaven and earth. The Book of Changes is the crystallization of the wisdom of the Chinese nation. It is the crystallization of
Next level of trend trading here. Possibility 75%, the indicator analyzes the current market to determine short (small dot), middle (circle with a dot inside) and long (cross with a circle and a dot inside) trends.  Wingdings characters of  Aqua color represents the beginning of the UP trend. Wingdings characters of  Orange color represents the beginning of the DOWN trend. Possibility 75% Indicator will improve your trading in the world of forex, commodities, cryptocurrencies and indices.
MT4インジケーター「イーグルアイ」でバイナリーオプション取引の可能性を引き出す MetaTrader 4(MT4)用の「イーグルアイインジケーター」を使って、バイナリーオプション取引の世界に革命を起こしましょう。この革新的なツールは、レーザーのような精度と比類のない収益性をもたらし、あなたのトレーディング体験を変える準備ができています。 ポテンシャルの境界が崩れ、利益が最大化される世界に飛び込んでください。イーグルアイインジケーターの比類のない精度と揺るぎない信頼性によって、市場の隠された秘密が明らかにされます。細部への緻密な注意を払って設計されたこの先進的なインジケーターは、先進的なアルゴリズム、入念なテクニカル分析、リアルタイムの市場データを組み合わせ、並外れたトレーディングの優位性を提供します。 イーグルアイインジケーターは市場のポイントを的確に把握し、迅速な意思決定をサポートします。直感的なインターフェースと使いやすいデザインにより、初心者のトレーダーでもバイナリーオプションの複雑な世界をスムーズにナビゲートし、その強力な力を最大限に活用することができます。 過去の推測や感情
ReboltP
David Theodore Caro-greene
リバランスオーバーレイテクノロジー(Rebolt)を使用すると、トレーダーは、あるチャートから別のチャートへのお金の流れを視覚化できます。 Rebolt Probabilityは、ユーザーが指定した間隔で、指定された期間、あるチャートから別のチャートにお金が流れた確率を示します。 ReboltがCyanまたはBlueを読み取る場合、これらはユーザーが指定した時間の間、または競合する信号が発生するまでの間、適切なサインを購入しています。 ReboltがVioletまたはRedを読み取ると、ユーザーが指定した時間の間、または競合する信号が発生するまでの間、売りの兆候が見られます。 Reboltは、価格変化の推定値(Rebolt Delta)、予想価格変化あたりの推定ドル値(Rebolt Delta $)、および予想される変化がチャートに追加または減算されて、将来の予想価格を表すオーバーレイとしても公開されます( Rebolt Overlay)。
Hi Trader, We are strategy development for Binary and Forex tools, our product have success for binary trading 1 min - 2 min experation. At the moment I build indicator for trading all day, not like Bonosu series with specific time. We launch A-Boss Stats Indicator for trading 1 minute to 5 minutes experation is mean can trade from 1 minutes - 5 minutes. Specification of A Boss Stats trading binary option: Work with all MT4 broker. Chart Time Frame M1 only, can use M5 Experation time for contact
このプロダクトを購入した人は以下も購入しています
Miraculous Indicator – ガン・スクエア・オブ・ナインに基づく100%非リペイントのFXおよびバイナリーツール この動画では、FXおよびバイナリーオプションのトレーダー向けに特別に開発された、非常に正確で強力な取引ツールである Miraculous Indicator を紹介しています。このインジケーターがユニークなのは、伝説的な ガン・スクエア・オブ・ナイン と ガンの振動の法則 に基づいている点で、現代の取引で利用できる最も正確な予測ツールの一つとなっています。 Miraculous Indicatorは 完全に非リペイント であり、ローソク足が確定した後にシグナルが変化したり消えたりすることはありません。つまり、見たものがそのまま利用できます。これにより、トレーダーは自信を持ってエントリーおよびエグジットを行うための信頼性と一貫性のある根拠を得ることができます。 主な特徴: ガン・スクエア・オブ・ナインとガン理論に基づいて構築 100%非リペイントのシグナルシステム すべての時間枠(M1、M5、H1、H4、日足、週足)で機能 FXおよびバイナリーオプション取引
Precautions for subscribing to indicator This indicator only supports the computer version of MT4 Does not support MT5, mobile phones, tablets The indicator only shows the day's entry arrow The previous history arrow will not be displayed (Live broadcast is for demonstration) The indicator is a trading aid Is not a EA automatic trading No copy trading function The indicator only indicates the entry position No exit (target profit)  The entry stop loss point is set at 30-50 PIPS Or the front hi
Pulse Scalping Line - an indicator for identifying potential pivot points. Based on this indicator, you can build an effective Martingale system. According to our statistics, the indicator gives a maximum of 4 erroneous pivot points in a series. On average, these are 2 pivot points. That is, the indicator shows a reversal, it is erroneous. This means that the second signal of the indicator will be highly accurate. Based on this information, you can build a trading system based on the Martingale
El indicador "MR BEAST ALERTAS DE LIQUIDEZ" es una herramienta avanzada diseñada para proporcionar señales y alertas sobre la liquidez del mercado basándose en una serie de indicadores técnicos y análisis de tendencias. Ideal para traders que buscan oportunidades de trading en función de la dinámica de precios y los niveles de volatilidad, este indicador ofrece una visualización clara y detallada en la ventana del gráfico de MetaTrader. Características Principales: Canal ATR Adaptativo: Calcula
BinaryIndicator is a highly accurate indicator for trading binary options. It shows excellent results in scalping. This indicator is based in multifactor analysis of trend indicators, as well as confirmation oscillators, which in the end gives an increased accuracy of signals. Advantages of the indicator Increased accuracy of signals. Excellent results when trading binary options with a short expiration time from M30 to M1 . It works on any timeframes. Works with any trade symbols. Parameters
Rtc ML Ai | Predictor CORE MACHINE LEARNING ENGINE Adaptive ML Market Predictor – Multi-Bar Trend & Candle Forecast What This Indicator Does This indicator is a  real-time market prediction engine  designed to analyze price behavior and estimate  future market tendencies . Unlike conventional indicators, this system  does not rely on static parameters or historical curve-fitting , but adapts its internal state dynamically during live market operation. Instead of using static rules, the indic
FFx Engulfing Setup Alerter gives trade suggestions with Entry, Target 1, Target 2 and StopLoss. Below are the different options available: Entry suggestion - pips to be added over the break for the entry 3 different options to calculate the SL - by pips, by ATR multiplier or at the pattern High/Low 3 different options to calculate the 2 TPs - by pips, by ATR multiplier or at Risk/Reward Offset the dashboard - any place on the chart Remove the suggestion once the price reached the SL line Lines
FFx InsideBar Setup Alerter gives trade suggestions with Entry, Target 1, Target 2 and StopLoss. Below are the different options available: Entry suggestion - pips to be added over the break for the entry Minimum candle size - to avoid too close buy/sell entry suggestions 3 different options to calculate the SL - by pips, by ATR multiplier or at the pattern High/Low 3 different options to calculate the 2 TPs - by pips, by ATR multiplier or at Risk/Reward Offset the dashboard - any place on the c
FFx OutsideBar Setup Alerter gives trade suggestions with Entry, Target 1, Target 2 and StopLoss. Below are the different options available: Entry suggestion - pips to be added over the break for the entry. 3 different options to calculate the SL - by pips, by ATR multiplier or at the pattern High/Low. 3 different options to calculate the 2 TPs - by pips, by ATR multiplier or at Risk/Reward. Offset the dashboard - any place on the chart. Remove the suggestion once the price reached the SL line.
FFx PinBar Setup Alerter gives trade suggestions with Entry, Target 1, Target 2 and StopLoss. Below are the different options available: Entry suggestion - pips to be added over the break for the entry Minimum candle size - to avoid too small candles 3 different options to calculate the SL - by pips, by ATR multiplier or at the pattern High/Low 3 different options to calculate the 2 TPs - by pips, by ATR multiplier or at Risk/Reward Offset the dashboard - any place on the chart Remove the sugges
The purpose of this new version of the MT4 standard indicator provided in your platform is to display in a sub-window multiple timeframes of the same indicator with its divergences. See the example shown in the picture below. But the display isn't like a simple MTF indicator. This is the real display of the indicator on its timeframe. Here's the options available in the FFx divergences indicator: Select the timeframes to be displayed (M1 to Monthly) Define the width (number of bars) for each tim
The purpose of this new version of the MT4 standard indicator provided in your platform is to display in a sub-window multiple timeframes of the same indicator with its divergences. See the example shown in the picture below. But the display isn't like a simple MTF indicator. This is the real display of the indicator on its timeframe. Here's the options available in the FFx divergences indicator: Select the timeframes to be displayed (M1 to Monthly). Define the width (number of bars) for each ti
The FFx Dashboard MTF alerter will show you on a single chart all the timeframes (M1 to Monthly) with their own status for the indicator. 2 Alert Options: Single timeframe: each selected timeframe alert separately when a signal occurs Multi timeframes: all selected timeframes must agree for an alert to be triggered Both options have an input to select the timeframes to be used for the alert(s). How to Understand the Status: Green/Red square: histogram above/below 0 line Green square + Red bord
The FFx Dashboard MTF alerter will show you on a single chart all the timeframes (M1 to Monthly) with their own status for the indicator. 2 Alert Options: Single timeframe: each selected timeframe alert separately when a signal occurs Multi timeframes: all selected timeframes must agree for an alert to be triggered Both options have an input to select the timeframes to be used for the alert(s). How to understand the status: Green/Red square: RSI above/below 50 line Green square + Red border: R
The FFx Dashboard MTF alerter will show you on a single chart all the timeframes (M1 to Monthly) with their own status for the indicator. 2 Alert Options: Single timeframe: each selected timeframe alert separately when a signal occurs Multi timeframes: all selected timeframes must agree for an alert to be triggered Both options have an input to select the timeframes to be used for the alert(s). How to understand the status: Green/Red square: Stoch above/below 50 line Green square + Red border:
The FFx Dashboard MTF alerter will show you on a single chart all the timeframes (M1 to Monthly) with their own status for the indicator. 2 Alert Options: Single timeframe: each selected timeframe alert separately when a signal occurs Multi timeframes: all selected timeframes must agree for an alert to be triggered Both options have an input to select the timeframes to be used for the alert(s). How to understand the status: Green/Red square: Price above/below Cloud (Kumo) Green square + Red bo
The FFx Dashboard MTF alerter will show you on a single chart all the timeframes (M1 to Monthly) with their own status for the indicator. 2 Alert Options: Single timeframe: each selected timeframe alert separately when a signal occurs Multi timeframes: all selected timeframes must agree for an alert to be triggered Both options have an input to select the timeframes to be used for the alert(s). How to understand the status: Green/Red square: MA pointing Up/Down Green square + Red border: MA po
The FFx Dashboard MTF alerter will show you on a single chart all the timeframes (M1 to Monthly) with their own status for the indicator. 2 Alert Options: Single timeframe: each selected timeframe alert separately when a signal occurs. Multi timeframes: all selected timeframes must agree for an alert to be triggered. Both options have an input to select the timeframes to be used for the alert(s). How to understand the status: Green square: Price above PSAR Red square: Price below PSAR Options
The FFx Dashboard MTF alerter will show you on a single chart all the timeframes (M1 to Monthly) with their own status for the indicator. 2 Alert Options: Single timeframe: each selected timeframe alert separately when a signal occurs Multi timeframes: all selected timeframes must agree for an alert to be triggered Both options have an input to select the timeframes to be used for the alert(s). How to understand the status: Green/Red square: CCI above/below levels (ie. 100/-100) Grey square: C
The FFx Dashboard MTF alerter will show you on a single chart all the timeframes (M1 to Monthly) with their own status for the indicator. 2 Alert Options: Single timeframe: each selected timeframe alert separately when a signal occurs Multi timeframes: all selected timeframes must agree for an alert to be triggered Both options have an input to select the timeframes to be used for the alert(s). How to understand the status: Green/Red square: ADX above level Grey square: ADX below level Red bor
The [GRAFF] III manual trading system is based on multiple MetaTrader (MT4) indicators. Together, the entire PACK of GRAFF III indicators makes an advanced trading tool. The system consists of over 20 different custom-built indicators which have been carefully selected and tested in the long term to produce strong and efficient trading signals. The particular indicators are based on different mathematical formulas, so the entire system is calibrated to remove false signals from its own indicator
FFx Universal Strength Meter PRO is more than a basic strength meter. Instead of limiting the calculation to price, it can be based on any of the 19 integrated strength modes + 9 timeframes. With the FFx USM, you are able to define any period for any combination of timeframes. For example, you can set the dashboard for the last 10 candles for M15-H1-H4… Full flexibility! Very easy to interpret... It gives a great idea about which currency is weak and which is strong, so you can find the best pai
Pan PrizMA CD Phase is an analogue of the МetaТrader 5 indicator , and is an option based on the Pan PrizMA indicator. Details . Averaging by a quadric-quartic polynomial increases the smoothness of lines, adds momentum and rhythm. Extrapolation by the sinusoid function near a constant allows adjusting the delay or lead of signals. The value of the phase - wave status parameter (which is close in meaning to the trigonometric phase or the angle of the radius-vector rotation in the trigonometric p
The Name Green Wall : Arrows hits a lot of TP, by changing the idea of non using SL as something bad, but instead use Small TP and a lot of free Margin and Patience. Use micro TP and a lot of Free Margin with this indicator on Forex. It also can be used with Binary Options. This strategy is intended to be traded Manually. This Indicator runs on Open Bar, arrows will delete when price are against it. The only Indicator Parameter is Alerts true/false, all the rest is included inside the code. Arro
Golden Monowave is monowave indicator, the monowave theory is one of Elliott wave approach and one of most complicate and accurate method. Golden Monowave can shortcut many major steps to identify and describe the monowave. It works on any timeframe and with any trading instrument, including currencies, indices, futures, etc. Input Parameters initial_Bars - set the initial number of bars to calculate. wave_color - select the color of the wave. label_color - select the color of labels. temp_labe
This indicator displays in a separate window the difference between the number of points which increased the price, and the number of points that decreased the price during the time interval specified in the settings. The time interval for calculation is expressed as the number of bars of the chart the indicator is attached to. This approach allows you to evaluate the movement direction (growth or fall) of the instrument's price, the strength of the movement and the size of the movement in point
MetaTrader 5 version available here : https://www.mql5.com/en/market/product/24882 FFx Basket Scanner is a global tool scanning all pairs and all timeframes over up to five indicators among the 16 available. You will clearly see which currencies to avoid trading and which ones to focus on. Once a currency goes into an extreme zone (e.g. 20/80%), you can trade the whole basket with great confidence. Another way to use it is to look at two currencies (weak vs strong) to find the best single pairs
フィルタ:
レビューなし
レビューに返信