Time IV Full
- インディケータ
- Dmitriy Parfenovich
- バージョン: 1.27
- アップデート済み: 27 11月 2021
- アクティベーション: 5
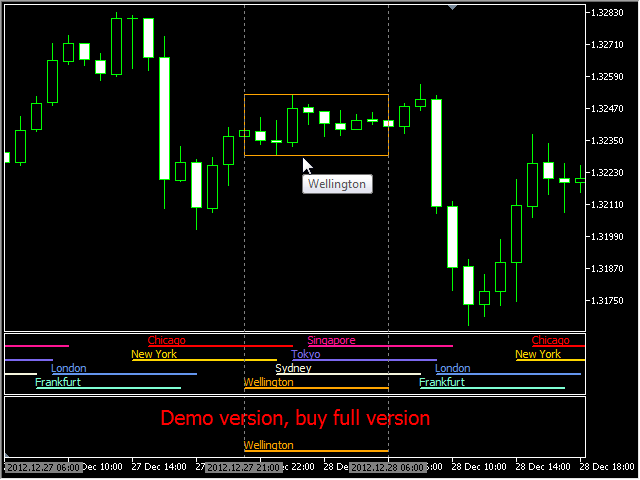
The new product Time IV (2013) is an updated version of Time III introduced earlier in the Market.
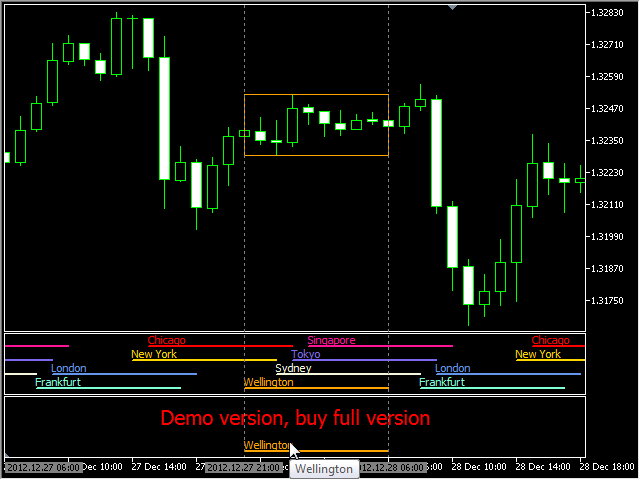
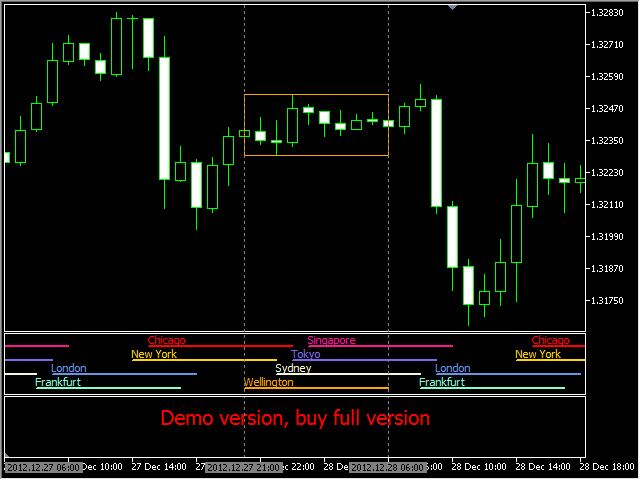
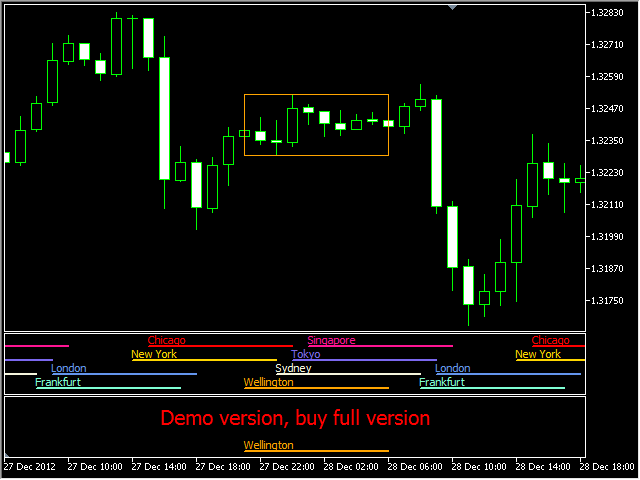
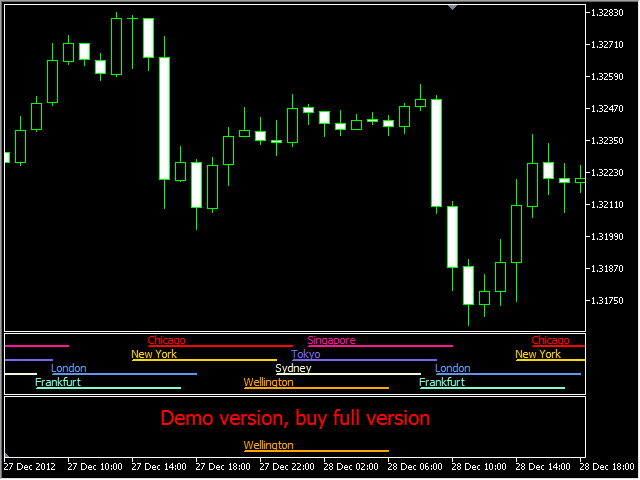
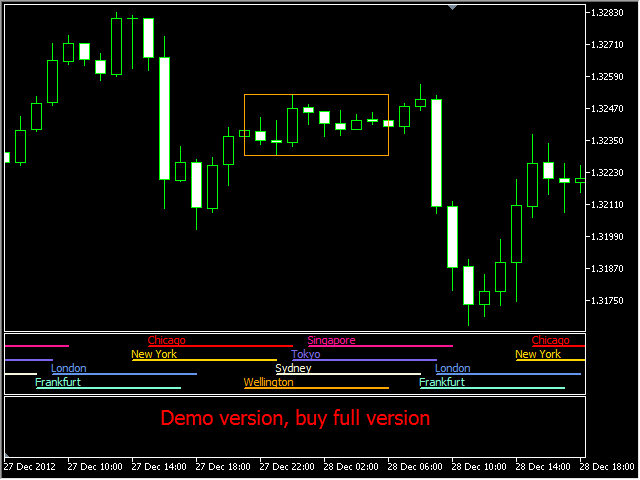
The indicator displays the work time of world marketplaces in a separate window in a convenient way.
The indicator is based on the TIME II (VBO) indicator rewritten in MQL5 from a scratch. The new version Time IV is a higher quality level product. Comparing to Time III it consumes less resources and has optimized code.
The indicator works on Н1 and lower timeframes.
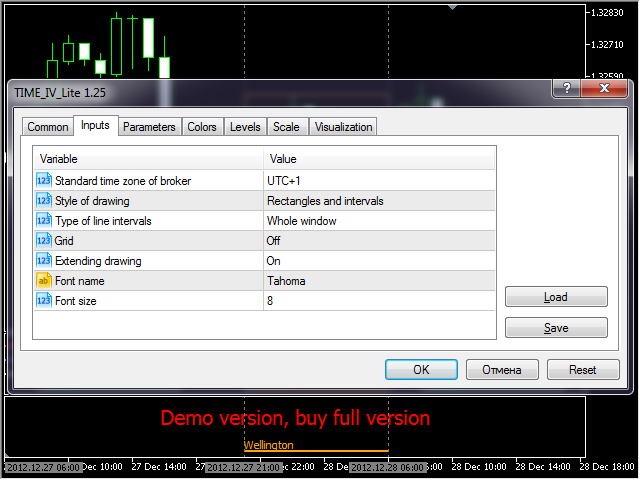
- Standard time zone of broker - broker time in the UTC+ format.
- Style of drawing - drawing style:
- Rectangles and intervals - rectangles and intervals.
- Rectangles only - rectangles only.
- Intervals only - intervals only.
- Don't draw - no drawing.
- Type of line intervals - type of the lines that display the beginning and the end of sessions:
- Whole window - throughout the whole window.
- Indicator only - on the indicator only.
- Don't draw - no drawing.
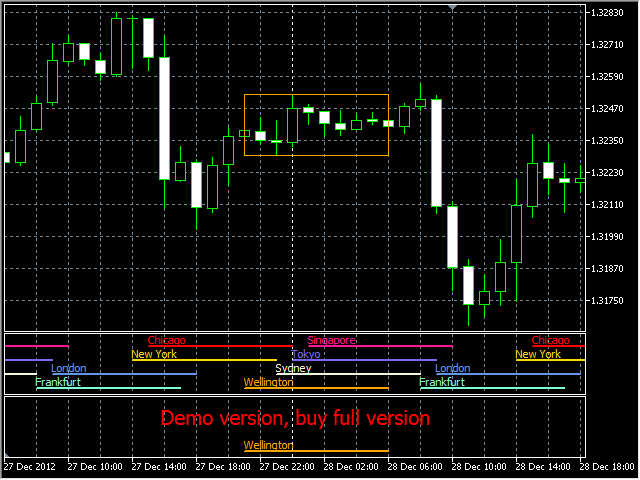
- Grid - gird:
- On - display.
- Off - hide.
- Extending drawing - extended graphics:
- On - enabled. Drawing in advance, can decrease the performance on slow computers but the graphics becomes smoother.
- Off - disabled. Drawing in the visible part of a chart, maximum performance but displaying lags when scrolling (for a split second).
- Font name - font for displaying the session names.
- Font size - font size. This size affects the height of the indicators.
I bought this thinking it would give value. Big mistake
There are no instructions and it is as far from intuitive as you can get
A complete waste of cash.
Don't waste yours