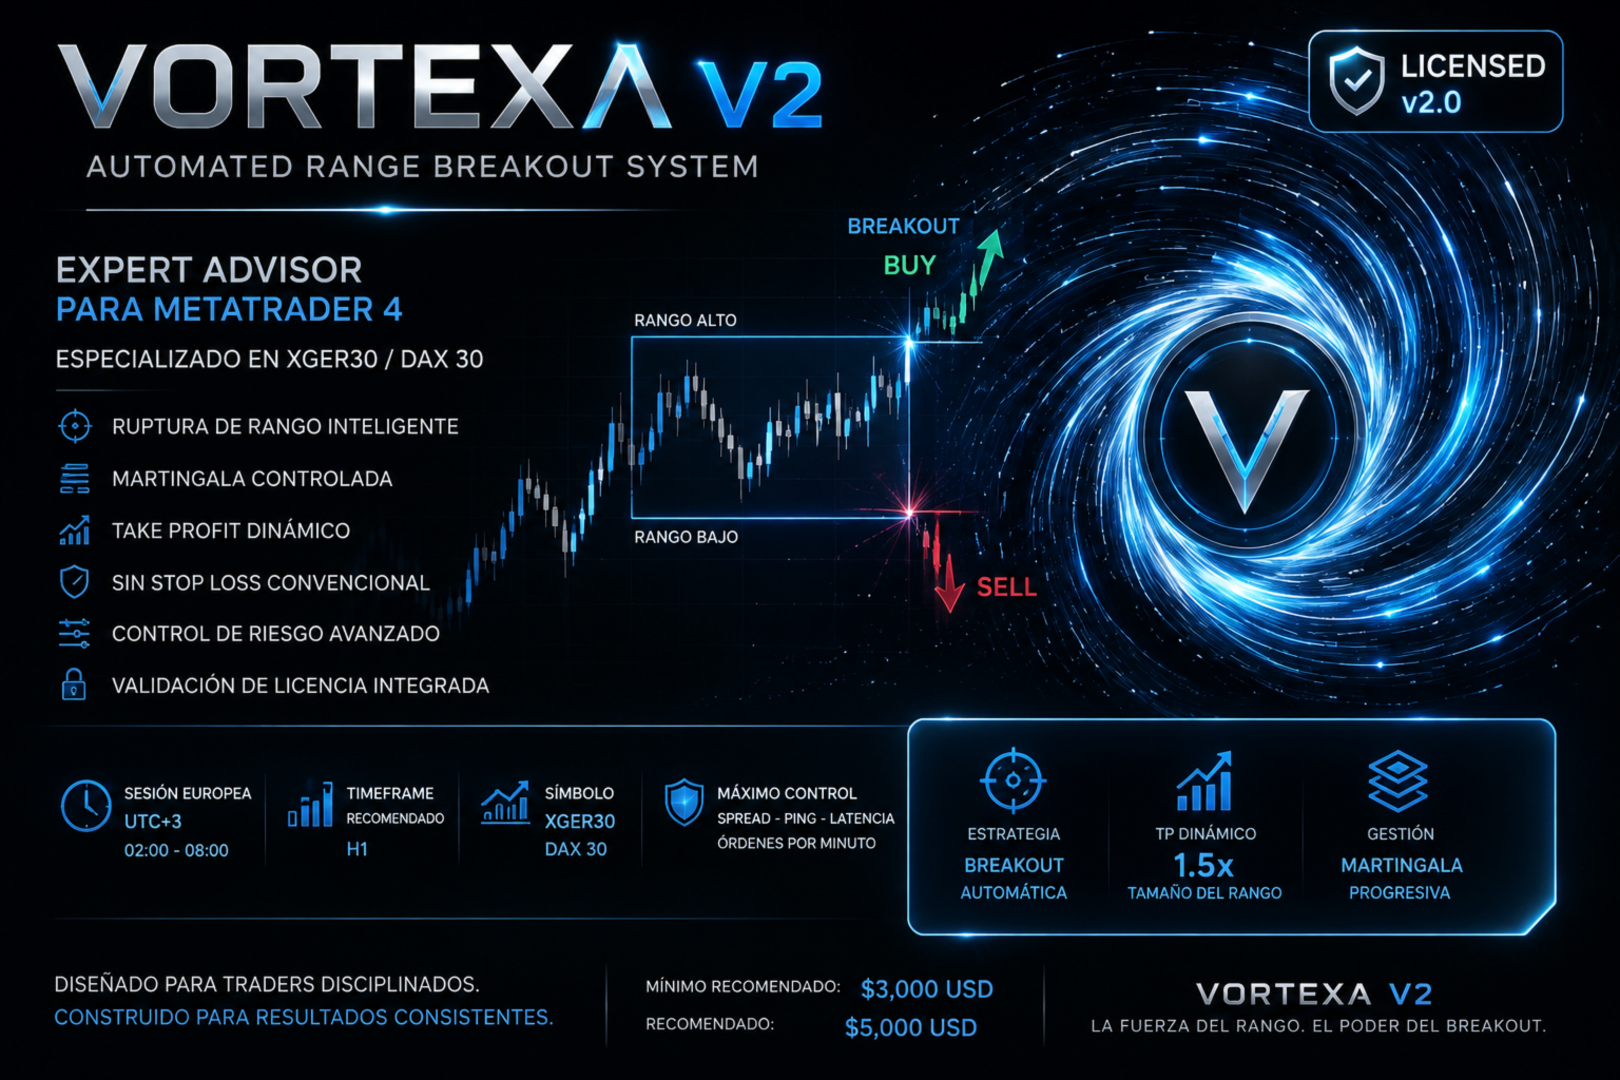
Vortexa V2
- エキスパート
- バージョン: 2.1
- アクティベーション: 5

AUTOMATED RANGE BREAKOUT SYSTEM
Expert Advisor for MetaTrader 4
Reference Market: XGER30 / DAX 30
Licensed v2.0 · September 2026
European Session · UTC+3
EA + VORTEXA Dashboard included with the license
VORTEXA V2 is an automated trading system for MetaTrader 4 built around a structured Range Breakout methodology.
Its operating logic follows a clear sequence:
Range → Breakout → Entry → Management → Target → Close
The system has been specifically developed with the following market as its primary reference:
XGER30 / DAX 30
with a range formation window of:
02:00 → 08:00 UTC+3
VORTEXA V2 automates market analysis, trade execution and position management, reducing the need for constant manual intervention.
In addition to the Expert Advisor, the license includes VORTEXA Dashboard, an independent visual tool designed to monitor the system's information from another MetaTrader 4 chart.
The system operates through a structured trading cycle.
01 — RANGE
Builds the reference range during the configured time window.
02 — BREAKOUT
Waits for a breakout that meets the system's internal conditions.
03 — ENTRY
Automatically executes the corresponding trade according to the breakout direction.
04 — MANAGEMENT
Manages the position according to the system's internal methodology.
05 — TARGET
Uses dynamic target management related to the range structure and configured parameters.
06 — COMPLETION
Once the operating cycle is completed, the system is prepared for the next session.
VORTEXA V2 can technically be used on other instruments compatible with MetaTrader 4.
However, XGER30 / DAX 30 is the system's reference market.
The architecture of VORTEXA V2 has been developed with specific characteristics of intraday index trading in mind, including:
-
European session volatility
-
Liquidity
-
Fast price movements
-
Range breakouts
-
Consolidation periods
-
Intraday market behavior
Results obtained on other instruments should not be assumed to be equivalent to the results presented for XGER30 / DAX 30.
VORTEXA V2 incorporates a trend filter based on the EMA 13.
The EMA 13 is:
Enabled by default · Configurable · Can be disabled
EMA 13 ENABLED
Adds an additional selection condition, making the trading activity more selective.
This is the configuration used in the main historical backtest presented in this document.
EMA 13 DISABLED
Allows broader trading activity and may generate:
-
More opportunities
-
Higher trading frequency
-
Greater exposure
-
Greater entry flexibility
-
Higher sensitivity to certain market conditions
Disabling the EMA 13 does not guarantee higher returns.
Each configuration should be analyzed independently.
VORTEXA V2 combines three core elements:
Range Breakout
Dynamic Management
Progressive Management
Progressive management allows exposure to be adapted when the market moves against the initial scenario.
This feature is part of the system's architecture, but it also represents one of its main risk factors.
An adverse sequence may increase:
-
Exposure
-
Margin usage
-
Drawdown
-
Sensitivity to prolonged market movements
For this reason, results should always be evaluated together with the level of risk assumed.
VORTEXA V2 incorporates several controls designed to improve execution stability:
-
Spread control
-
Latency control
-
Execution control
-
Frequency control
-
License protection
-
System status monitoring
The internal parameters and mechanisms form part of the proprietary architecture of VORTEXA V2.
As part of VORTEXA V2, the license includes VORTEXA Dashboard at no additional cost.
The Dashboard has been designed as an independent monitoring tool that can be attached to another MetaTrader 4 chart, allowing users to view relevant EA information without having the Expert Advisor directly attached to the same chart.
SYSTEM INFORMATION
The Dashboard provides a clear and centralized view of:
-
EA status
-
Session status
-
Current range
-
Breakout direction
-
Open positions
-
Exposure
-
Trading results
-
Statistics
-
Management status
-
Operating cycle
-
Relevant account information
-
Relevant system information
INDEPENDENT MONITORING
The Dashboard can be used on another MetaTrader 4 chart, making it easier to monitor VORTEXA V2 while the EA continues executing its strategy on its designated chart.
This provides a more convenient and organized overview of the system.
INCLUDED WITH THE LICENSE
VORTEXA V2 + VORTEXA Dashboard
The Dashboard is included free of charge with the VORTEXA V2 license and requires no additional payment.
A complete solution to execute and monitor VORTEXA V2 from MetaTrader 4.
| Parameter | Reference |
|---|---|
| Platform | MetaTrader 4 |
| Main Market | XGER30 / DAX 30 |
| Timeframe | H1 |
| Session | European |
| Time Reference | UTC+3 |
| Range Window | 02:00–08:00 UTC+3 |
| Dashboard | Included |
OPERATING CAPITAL
Minimum reference: ~ $2,500 USD
Recommended reference: ~ $5,000 USD
The $5,000 reference provides a greater operating buffer against periods of volatility, adverse market movements and potential increases in exposure.
These amounts are guidelines only and do not constitute a guarantee of safety or performance.
EMA 13 — ENABLED · TP RATIO 1.5
Market: XGER30 / DAX 30
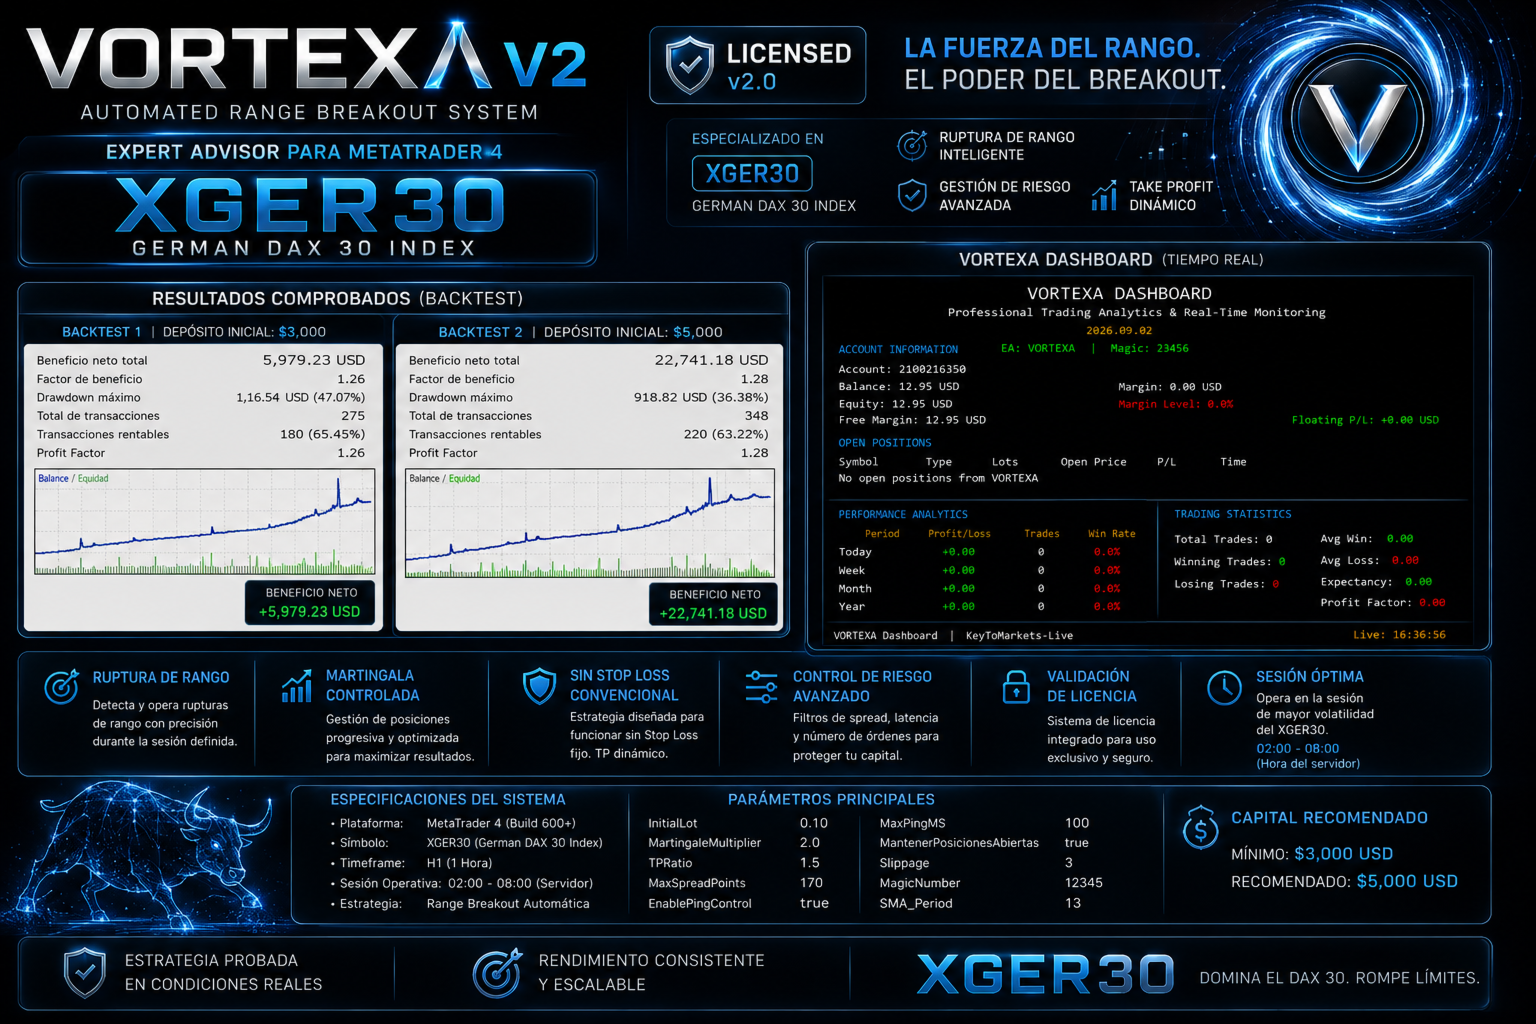
| Parameter | Result |
| Initial Capital | $3,000 |
| Theoretical Final Balance | $8,979.23 |
| Net Profit | +$5,979.23 |
| Return | +199.3% |
| Total Trades | 275 |
| Winning Trades | 180 · 65.45% |
| Losing Trades | 95 · 34.55% |
| Profit Factor | 1.26 |
| Maximum Drawdown | 47.07% |
| Largest Winning Trade | +$6,379.87 |
| Largest Losing Trade | −$5,351.21 |
BACKTEST PARAMETERS
Period: 14/02/2025 → 25/08/2026
Timeframe: H1
Model: Every Tick
Initial Lot: 0.10
EMA 13: Enabled
Progressive Management: Enabled
TP Ratio: 1.5
REFERENCE RESULT
$3,000 → $8,979.23
+$5,979.23 Net Profit
+199.3% Return
The backtest recorded 275 trades, with 65.45% winning trades and a Profit Factor of 1.26.
KEY RISK FIGURE
Maximum Drawdown: 47.07%
This figure is particularly important and should be considered together with the return achieved.
Historical performance does not represent a guarantee of future results.
EMA 13 — DISABLED · TP RATIO 2.0
In addition to the historical backtest, VORTEXA V2 has a reference of live trading activity on XGER30 / DAX 30 using a different configuration.
| Parameter | Live Account |
| Market | XGER30 / DAX 30 |
| Reference Capital | ~$5,000 |
| EMA 13 | Disabled |
| TP Ratio | 2.0 |
| Data Type | Live Trades |
| Period | January 2026 – August 2026 |
| Withdrawals | Excluded |
DIFFERENT CONFIGURATION
The live account presented in this document does not use exactly the same configuration as the historical backtest.
Historical Backtest: EMA 13 enabled + TP Ratio 1.5
Live Account: EMA 13 disabled + TP Ratio 2.0
The TP Ratio 1.5 corresponds to the default VORTEXA V2 configuration.
The live trading reference presented in this document was executed using a TP Ratio of 2.0.
Therefore, both references should be analyzed independently.
The live trading history corresponds to trades executed on:
XGER30 / DAX 30
with an approximate reference capital of:
$5,000
RESULTS
Gross Trading Profit:
+$5,712.62
Accumulated Swap:
−$467.67
CLOSED P/L:
+$5,245.05
WITHDRAWALS EXCLUDED
Withdrawals made from the account have been completely excluded from the calculation presented.
Withdrawals represent capital movements and are not trading losses. Therefore, they should not be mixed with the operating performance of closed trades.
The live account provides an additional reference because it represents trades executed in the real market.
The trading history demonstrates profit generation, but it also clearly reflects the exposure associated with progressive management.
During certain sequences, position sizes may progress as follows:
0.20 → 0.40 → 0.80 → 1.60 → 3.20 → 6.40
and, under certain circumstances, higher sizes may occur.
Therefore:
PROFIT AND RISK MUST BE ANALYZED TOGETHER.
VORTEXA V2 should not be interpreted as a low-risk system simply because it has produced positive results.
Progressive management can significantly increase exposure and, consequently, risk during certain adverse sequences.
| Historical Backtest | Live Account | |
| Market | XGER30 / DAX 30 | XGER30 / DAX 30 |
| EMA 13 | Enabled | Disabled |
| TP Ratio | 1.5 | 2.0 |
| Reference Capital | $3,000 | ~$5,000 |
| Data Type | Historical | Live |
| Trades | 275 | 167 |
| Profit Factor | 1.26 | 1.13 |
| Drawdown | 47.07% | 37% |
| Progressive Management | Enabled | Enabled |
FUNDAMENTAL DIFFERENCE
BACKTEST
EMA 13 ON · TP Ratio 1.5
LIVE ACCOUNT
EMA 13 OFF · TP Ratio 2.0
These references correspond to different VORTEXA V2 configurations and should not be presented as if they were the same test.
The backtest represents a historical evaluation of a specific configuration.
The live account represents an independent reference of the system's behavior in the real market using a different configuration.
VORTEXA V2 involves significant financial risk.
The main risk factors include:
-
High drawdown
-
Increased exposure
-
Higher margin utilization
-
Extreme volatility
-
Slippage
-
Spread expansion
-
Liquidity issues
-
Gaps
-
Extraordinary news events
-
Broker differences
-
Execution issues
The historical backtest presented recorded:
47.07% MAXIMUM DRAWDOWNThis figure should be considered a fundamental reference when evaluating the system's risk profile.
Historical and live results do not guarantee future results.
Market conditions can change, and backtest results may differ significantly from those achieved in live trading.
VORTEXA V2
RANGE BREAKOUT
Structured range identification and automated breakout detection.
DAX SPECIALIZATION
Specifically developed around XGER30 / DAX 30.
AUTOMATION
Automated analysis, execution and trade management.
DYNAMIC MANAGEMENT
Targets adapted to the range structure and configured parameters.
PROGRESSIVE MANAGEMENT
Exposure adaptation throughout the trading cycle.
EMA 13
Enabled by default, configurable and can be disabled.
TP RATIO
1.5 by default.
The live account configuration presented in this document used:
TP Ratio 2.0
DASHBOARD
Included at no additional cost with the license.
The Dashboard can be attached to another MetaTrader 4 chart to provide a centralized overview of the EA's information and current status.