
FSB Volume OrderBlocks
- インディケータ
-
Farzin Sadeghi Bonjar
 you can find more info about me on my linkedin profile : https://www.linkedin.com/in/farzinsb/
 - バージョン: 608.251
- アップデート済み: 25 8月 2026
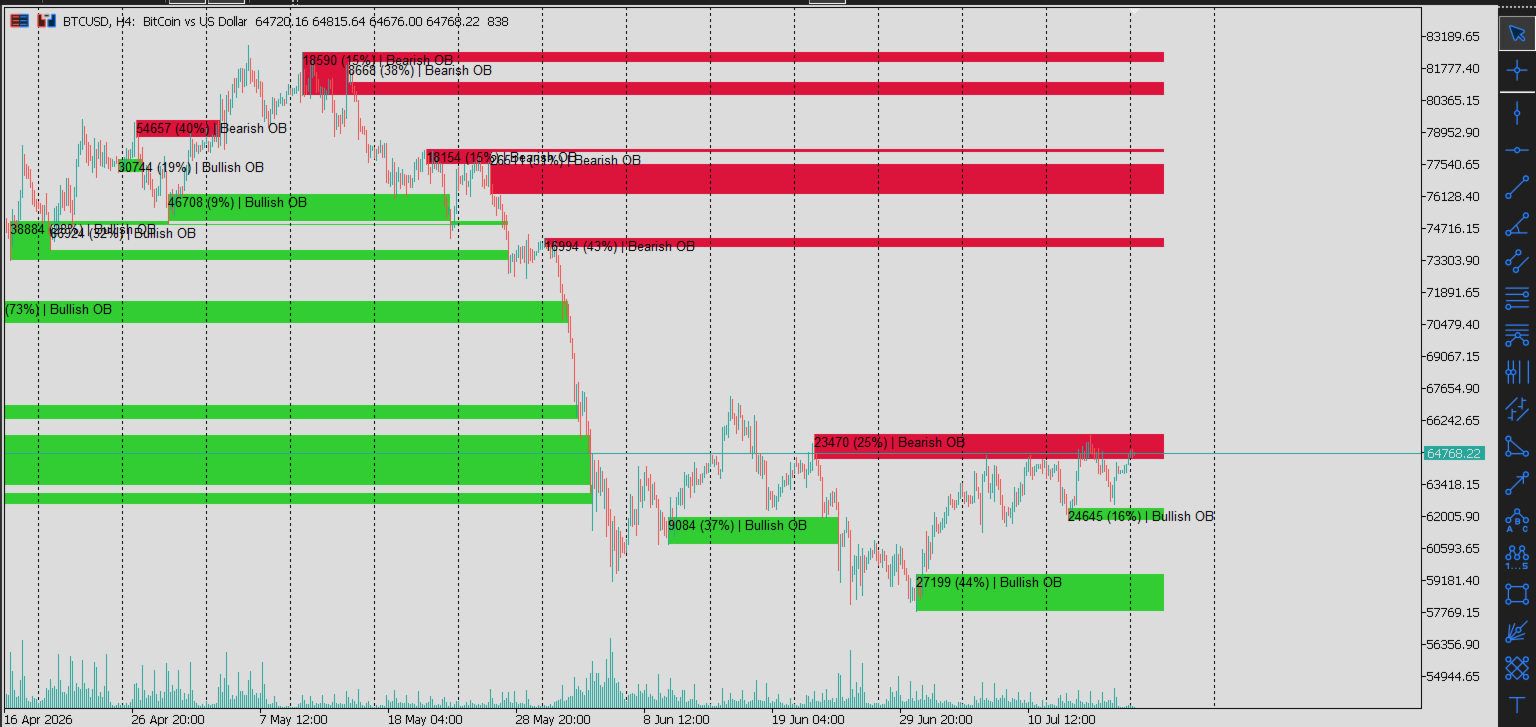
This indicator is an advanced Smart Money Concepts (SMC) tool designed to identify Order Blocks (Supply and Demand zones) and filter them using Trading Volume and Market Volatility (ATR).
The Original code was a tradingview pinescript indicator that Mr.Mehdi Pirhayati shared for free. so I share this Metatrader5 Version of it for free too.
How It Works:
-
Swing Detection: The indicator identifies valid market swing highs and lows based on your chosen SwingLength .
-
Order Block Creation: When the price breaks a valid swing, the indicator marks the origin of that move as an Order Block (Bullish or Bearish).
-
Volume Filtration: Each drawn box displays the total volume of the candles that formed the block, along with a percentage. This percentage highlights volume imbalances within the zone.
-
Zone Invalidation: If the price breaks through an Order Block in the opposite direction (either by a wick or a candle close), the zone is considered "Mitigated" and stops extending into the future.
Key Input Parameters:
-
Show Invalidated: If true, historical (broken) zones will remain on the chart. If false, only fresh, untested Order Blocks are displayed, keeping your chart clean.
-
Ob End Method: Determines what invalidates a zone. Wick means any touch/penetration invalidates it, while Close requires the candle body to close beyond the zone.
-
Max Atr Mult: Prevents the drawing of absurdly massive zones. If a zone's width is larger than (ATR × this multiplier), it is ignored.
-
Swing Length: Higher values detect major structural Order Blocks. Lower values will detect minor, short-term zones.
-
Max Zones To Draw: The maximum number of Order Blocks kept on the chart. Increase this (e.g., 50 or 100) if you trade on lower timeframes like M5 and want more historical context.
-
Max Bars History: Limits the indicator to process only the last X candles (e.g., 5000). This optimizes CPU usage and prevents MetaTrader from freezing.
How to Trade Using This Indicator:
-
Buy Setup: Look for long entries when the price retraces into a Bullish Order Block (Green box) and shows signs of rejection. Place your Stop Loss just below the bottom of the box.
-
Sell Setup: Look for short entries when the price rallies into a Bearish Order Block (Red box) and shows rejection. Place your Stop Loss just above the top of the box


















































Excelente ferramenta, muito obrigado por ser gratuita, mas gostaria de sugerir um "UP", alterar as cores para cores transparentes, ou colocar uma opção para que as cores fiquem translucidas.