Volume Levels USDJPY
- インディケータ
- Alexander Nikolaev
- バージョン: 1.1
- アップデート済み: 6 12月 2021
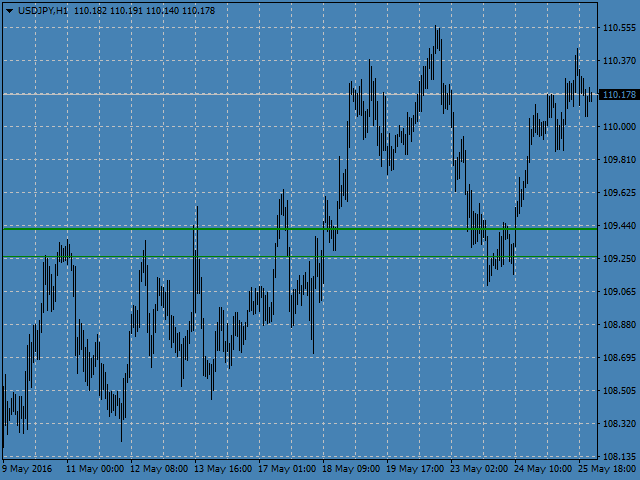
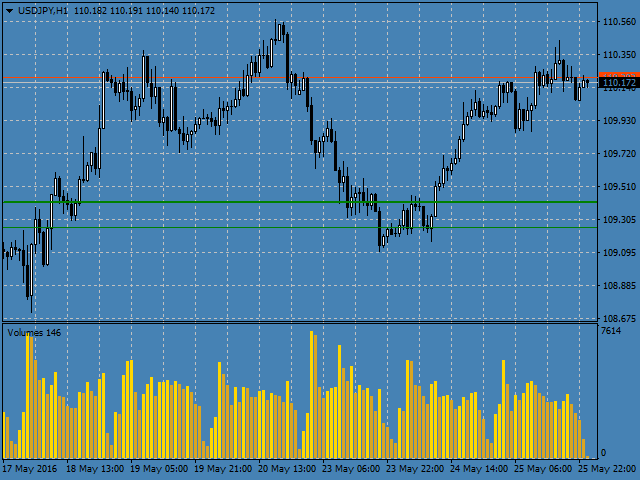
Volume Levels is a very important indicator for exchange trading. Most of the trades were performed on those levels. This indicator displays the price level that had the most trade volumes over a certain period of time. Often, the price bounces from those levels in the future, and it can be successfully used in trading. This is a demo version that works only on the USD/JPY currency pair. To work on all currency pairs, install the full version:
https://www.mql5.com/en/market/product/15888
Parameters
- HistoryBars - the number of bars to determine the near volume levels;
- Range - the maximum distance above and below the current price to determine the levels;
- HistoryBarsLevels2 - the number of bars to determine the distant volume levels;
- MinDistanceLevels2 - the minimum distance from the near level to the distant one;
- RedrawTime - the levels redrawing time;
- Step - the step to determine the levels (the smaller the step, the higher the accuracy, but the calculation of levels may take longer);
- TimeframeFindLevels - timeframe in minutes (1, 5, 15, 30, 60, 240) to calculate the levels. At the value 0, the levels will be plotted based on the timeframe that is currently displayed;
- ColorLow - color of the lower levels;
- ColorHigh - color of the upper levels.
Recommendations
The smaller the timeframe and at the same time the greater the HistoryBars parameter, the stronger are the levels. It is recommended to draw the levels based on the short-term timeframes (set the value of the TimeframeFindLevels parameter to 1 or 5), the levels will be more accurate, but will take longer to calculate. Also, I recommend to try the full version of this indicator.


Not bad.