Advanced Currency Meter
- インディケータ
- Nesimeye Oswald
- バージョン: 2.1
- アップデート済み: 6 10月 2020
- アクティベーション: 20
Good News ! Advanced Currency Meter is more awesome now !
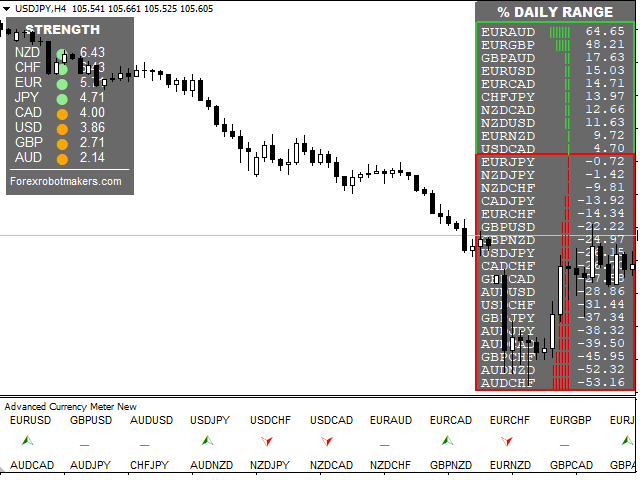
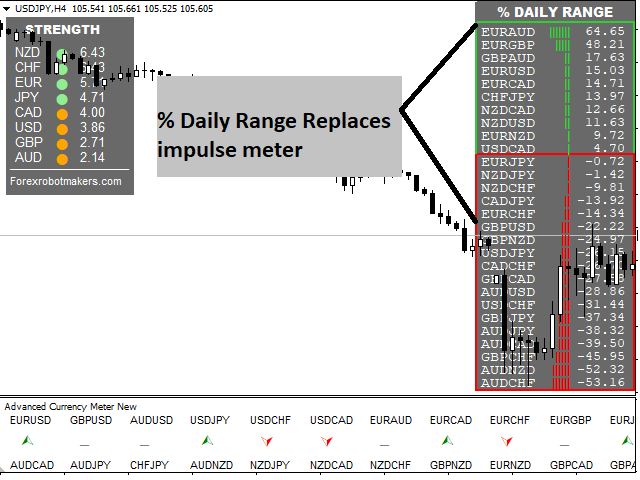
If you have been a fan of the free version of Advanced Currency Meter then I will implore you not to be discourage because you will soon find that the new paid version is worth every dime. Unlike the free version the new paid version of Advanced Currency Meter now has a newly added panel called the “% Daily Range”.
Why A Paid Version Now?
We believe you like good things and many who has used Advanced Currency Meter over the years will testify that it has gone from good to better but now Advanced Currency Meter is awesome!. We have just added a small charge for the new awesomeness, that can’t be greedy of us now, can it ?
What Is the newly added “% Daily Range” about?
Every day the market moves occurs in a daily ranges. The maximum move most of the times before a market reverses daily is the average daily range in pips . The daily range panel measures the percentage move of the current price from the daily range level. At an overbought level of >80% , the market is most likely to reverse for the day.
More About Advanced Currency Meter
Every good forex system has the following basic components:
- Ability to recognize the trend direction.
- Ability to identify the strength of the trend and answer the basic question
- Is the market trending or is it in a range?
- Ability to identify safe entry points that will give a perfect risk to reward (RR) ratio on every position.
How Advanced Currency Meter Helps you Achieve These Components
Advanced Currency Meter is a tool that measures the strength between individual currencies in a pair. Advanced Currency Meter goes further in employing Moving Average and ADX indicators to confirm the strength of a pair, identify the trend and identify the stage of the trend.
INTRODUCING : Multi-TimeFrame Currency Meter. It is an upgraded version of Advanced Currency Meter. It displays currency strength for up to 3 timeframes (D1,W1,MN1) thus showing the currency that has the most sustainable strength over a long period of time. Advanced currency Meter only displays currency strength for Daily(D1) timeframe. Multi-TimeFrame Currency Meter also displays Trend direction for up to 3 timeframes thus showing currency pairs with the strongest trend. Also has notification alert for trend change! . Click Here to download Multi-TimeFrame Currency Meter.
What is the direction of the trend
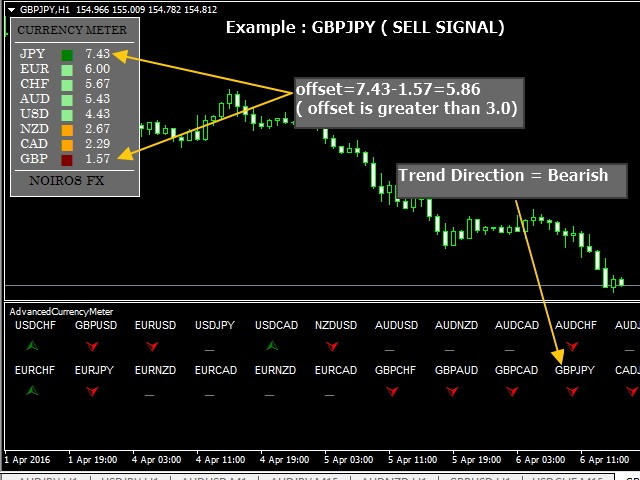
With Advanced Currency Meter, you can easily view the direction of the trend for all currency pairs in one window. It has two basic panels: one of the panels contains the strength of different currencies and the other shows the trend and strength of the currency pairs. When ever the arrow is UP, this is an indication of buy trend and when ever the arrow is DOWN, this is an indication of a down trend.
What is the strength of the trend
With Advanced Currency Meter, you can easily ascertain the strength of a trend even if you are a novice. When ever a currency pair is trending, an arrow is displayed to indicate the trend direction. When ever a currency is in a range, the arrow is deleted to indicate that there is no direction.
Where do i enter the trend to have a good Risk Reward Ratio
With Advanced Currency Meter, you can easily ascertain the best entry points in a trend. Whenever the difference in strength (off-set) between two currencies in a pair is greater than 4.0, this is strong indication to enter the trend. At this stage the market is likely to move in only one direction for a while thus this a strong indicator for entry points
Simplicity
One good attribute of the Advanced Currency Meter is its simple view. No complicated trend lines, channels, arrows etc... Just numbers that even a 10 year old can read.
Inputs
- Impulse TimeFrame : Time frame for impulse meter calculations.
- symbol_prefix: symbol prefix
- symbol_suffix: symbol suffix
- Currency Strength Dashboard color : currency strength panel color
- Currency Stregth Text Color : currency strength panel texts
- Trend Strength Text Color : Trend strength panel texts


ユーザーは評価に対して何もコメントを残しませんでした