• 概要
  • レビュー
  • コメント (4)
  • 最新情報

IceFX VelocityMeter Mini for MT5

IceFX VelocityMeter Mini is a very unique indicator on MetaTrader 4 platform which measures the speed of the Forex market. It is not a normal volume or other measurement indicator because IceFX VelocityMeter Mini is capable to understand market speed movements which are hidden in ticks and those valuable information cannot be read in an ordinary way from the candles.

The software monitors the received ticks (frequency, magnitude of change) within a specified time range, analyzes these info and defines, displays and records a reference value which is typical of the actual market velocity rate. Market speed value is changing with every tick, so this professional tool has the ability to respond quickly to any changes.

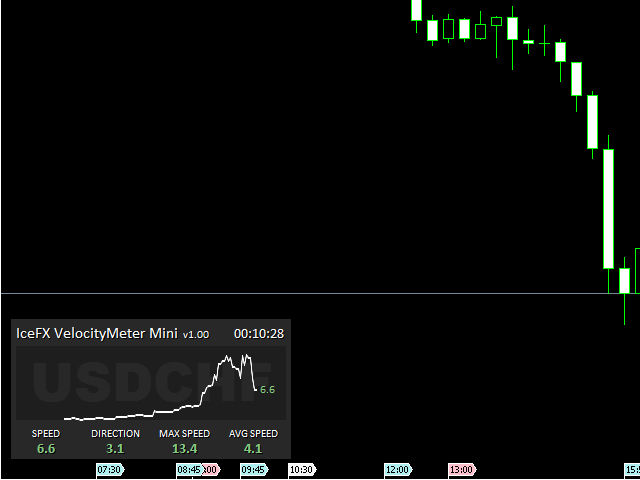
This IceFX VelocityMeter Mini indicator is a "minimized" version of the original IceFX VelocityMeter indicator. It draws the last 50 speed values on a mini tick chart, too. It shows the current speed, current speed direction, average speed and maximum speed.


Parameters

  • SpeedMediumLevel - level of medium speed
  • SpeedHighLevel - level of high speed
  • Correction - correction of calculation (recommended value is 20)
  • Corner - chart corner of panel
  • CornerOffsetX - horizontal offset from the corner
  • CornerOffsetY - vertical offset from the corner

The indicator sets global variables with the current speed, current speed direction and average speed values, so you can use these values in your Expert Advisors.


Global variables

  • SPEED_<SYMBOL>_<PERIOD>_CURR - current value of speed (e.g: SPEED_EURUSD_15_CURR)
  • SPEED_<SYMBOL>_<PERIOD>_DIR - current value of speed direction (e.g: SPEED_EURUSD_15_DIR)
  • SPEED_<SYMBOL>_<PERIOD>_AVG - average value of speed (e.g: SPEED_EURUSD_15_AVG)
おすすめのプロダクト
This indicator allows you to enjoy the two most popular products for analyzing request volumes and market deals at a favorable price: Actual Depth of Market Chart Actual Tick Footprint Volume Chart This product combines the power of both indicators and is provided as a single file. The functionality of Actual COMBO Depth of Market AND Tick Volume Chart is fully identical to the original indicators. You will enjoy the power of these two products combined into the single super-indicator! Below is
インディケータは現在のクオートを作成し、これを過去のものと比較して、これに基づいて価格変動予測を行います。インジケータには、目的の日付にすばやく移動するためのテキスト フィールドがあります。 オプション: シンボル - インジケーターが表示するシンボルの選択; SymbolPeriod - 指標がデータを取る期間の選択; IndicatorColor - インジケータの色; HorisontalShift - 指定されたバー数だけインディケータによって描画されたクオートのシフト; Inverse - true は引用符を逆にします。false - 元のビュー。 ChartVerticalShiftStep - チャートを垂直方向にシフトします (キーボードの上下矢印)。 次は日付を入力できるテキストフィールドの設定で、「Enter」を押すとすぐにジャンプできます。
Was: $249  Now: $99   Market Profile defines a number of day types that can help the trader to determine market behaviour. A key feature is the Value Area, representing the range of price action where 70% of trading took place. Understanding the Value Area can give traders valuable insight into market direction and establish the higher odds trade. It is an excellent addition to any system you may be using. Inspired by Jim Dalton’s book “Mind Over Markets”, this indicator is designed to suit the
You can change the time period of the chart at the touch of a button. You can also change multiple charts at the touch of a button. You can also change multiple charts at the touch of a button,   saving you the trouble of changing time periods. We are live-streaming the actual operation of the system. Please check for yourself if it is usable. Please check it out for yourself. https://www.youtube.com/@ganesha_forex We do not guarantee your investment results. Investments should be made at y
An indicator of patterns #24, #25, #26 and #27 ("Head and Shoulders", "Complex Head and Shoulders") from Encyclopedia of Chart Patterns by Thomas N. Bulkowski. Parameters: Alerts - show alert when an arrow appears   Push - send a push notification when an arrow appears (requires configuration in the terminal) PeriodBars - indicator period K - an additional parameter that influences the accuracy of pattern shape recognition. The smaller the value is, the smoother the row of peaks/valleys shoul
The Volume by Price Indicator for MetaTrader 5 features Volume Profile and Market Profile TPO (Time Price Opportunity). Get valuable insights out of currencies, equities and commodities data. Gain an edge trading financial markets. Volume and TPO histogram bar and line charts. Volume Footprint charts. TPO letter and block marker charts including split structures. Versatile segmentation and compositing methods. Static, dynamic and flexible ranges with relative and/or absolute visualizations. Lay
Magic Channel Scalper は、MetaTrader 5 ターミナルのチャネル インジケーターです。 このインジケーターを使用すると、最も可能性の高いトレンド反転ポイントを見つけることができます。 ほとんどのチャネル インジケーターとは異なり、Magic Channel Scalper は再描画しません。 アラート システム (アラート、電子メール、プッシュ通知) は、複数の取引商品を同時に監視するのに役立ちます。 インジケーターをチャートに添付すると、シグナルが出現するとアラートがトリガーされます。 当社のアラート システムを使用すると、単一のポジション開始シグナルを見逃すことはありません。 利点 スキャルピングに最適です。 トレンドの反転を特定するのに最適です。 初心者にも経験豊富なトレーダーにも適しています。 すべての時間枠で機能します。 インジケーターは再描画されません。 柔軟な警報システム。 グラフのカスタマイズ (線のサイズと色)。 推奨されるシンボル USDCAD、EURUSD、USDCHF、AUDNZD、AUDCAD、ゴ
This indicator provides the analysis of tick volume deltas. It monitors up and down ticks and sums them up as separate volumes for buys and sells, as well as their delta volumes. In addition, it displays volumes by price clusters (cells) within a specified period of bars. This indicator is similar to VolumeDeltaMT5 , which uses almost the same algorithms but does not process ticks and therefore cannot work on M1. This is the reason for VolumeDeltaM1 to exist. On the other hand, VolumeDeltaMT5 ca
このインジケーターは、フィルタリングされた価格情報を表示します 3 つの色付きのヒストグラムと 1 つの共通の色付きの線の形式で。 これは非常にカラフルで美しいインジケーターです。 価格変動の強さと方向を判断するのに最適です。 このインジケーターの設定は非常に簡単です。 1) 指標を計算するための 3 つのオプションの選択: - オリジナル、 - デマーカー、 - バランスボリューム。 2) 5 つの異なる期間の選択。 3) 表示色の選択。 4) 精度の選択。 ///////////////////////////////////////////////////////////// この指標が取引の成功に非常に役立つことを願っています。 幸運を。
This is a multi-symbol and multi-timeframe table-based indicator designed for a candlestick patterns detection with 46 patterns for META TRADER 5. Each formation has own image for easier recognition. Here you find most popular formations such as "Engulfing", "Hammer", "Three Line Strike", "Piercing" or Doji - like candles. Check my full list of patterns on my screenshots below. Also you can not only switch all bearish or bullish patterns from input, but also select formation for a specified symb
Description: The Volume Profile displays detailed informations of historical trading activities at certain price levels (Market Profile). Locate the areas with the best prices in the market and get an advantage over other market participants. Support: The indicator is constantly being developed and improved. Please do not hesitate to contact me via the MQL5 Platform. I am very grateful about any Bug report, so that i can constantly improve the indicator. I appreciate any public review for this
この指標の独自性は、ボリュームアカウンティングアルゴリズムにあります。累積は、1日の始まりを参照せずに、選択した期間に直接発生します。最後のバーは計算から除外できます。そうすると、現在のデータが以前に形成された重要なレベル(ボリューム)に与える影響が少なくなります。 より正確な計算のために、M1グラフのデータがデフォルトで使用されます。価格ボリュームの分配のステップは規制されています。デフォルトでは、ディスプレイの右の境界線は、分析に使用されるデータの先頭に対応するバーに設定されていますが、必要に応じて、必要なバーに設定できます。表示されているボリュームバンドの長さ(右の境界線)は係数によって調整され、0(現在の)バーに左または右にシフトしたり、現在のバーを参照してミラーリングしたりすることもできます。 パラメーター: Accumulation period - ボリューム累積の計算期間 Number of excluded last bars - 計算から除外された最後のバーの数 Accumulation price step - 価格パラメータによるボリューム合計のステップ Gra
Laguerre SuperTrend Clouds   adds an Adaptive Laguerre averaging algorithm and alerts to the widely popular SuperTrend indicator. As the name suggests,   Laguerre SuperTrend Clouds (LSC)   is a trending indicator which works best in trendy (not choppy) markets. The SuperTrend is an extremely popular indicator for intraday and daily trading, and can be used on any timeframe. Incorporating Laguerre's equation to this can facilitate more robust trend detection and smoother filters. The LSC uses the
More stable MetaTrader 4 version is available here:  Lot Calculator Tool . This tool helps you to automatically calculate and manage risk, conveniently place orders visually, schedule orders, trail stops, move them to break-even and more. Features Place market or pending orders using draggable lines Schedule orders Calculate and limit risk using various methods See current spread See time till next candle Set custom order comments Trail stops Move stops to break-even See order profit/loss in
Was: $299  Now: $99   Supply Demand uses previous price action to identify potential imbalances between buyers and sellers. The key is to identify the better odds zones, not just the untouched ones. Blahtech Supply Demand indicator delivers functionality previously unavailable on any trading platform. This 4-in-1 indicator not only highlights the higher probability zones using a multi-criteria strength engine, but also combines it with multi-timeframe trend analysis, previously confirmed swings
FFx Universal Strength Meter PRO is more than a basic strength meter. Instead of limiting the calculation to price, it can be based on any of the 19 integrated strength modes + 9 timeframes. With the FFx USM, you are able to define any period for any combination of timeframes. For example, you can set the dashboard for the last 10 candles for M15-H1-H4… Full flexibility! Very easy to interpret... It gives a great idea about which currency is weak and which is strong, so you can find the best pai
Trading Utility for Forex Currency Pairs Only not for Gold  Functions Auto Lot Calculation based on Risk Auto stoploss  Auto TakeProfit Breakeven Auto Close Half % Close in percentage with respect to the PIPs Pending Orders BuyLimit Sell Limit with distances BuyStop Sell Stop    with distances Trading Informations Risk in percentage For Multiple trades Combine Takeprofit and Combine Stoplosses
Wapv Price and volume
Eduardo Da Costa Custodio Santos
MT5のWAPV価格と出来高インジケーターは、(Wyckoff Academy Wave Market)および(Wyckoff Academy Price and Volume)ツールセットの一部です。 MT5のWAPV価格および出来高インジケーターは、チャート上の出来高の動きを直感的な方法で簡単に視覚化できるように作成されました。 それを使用すると、ピークボリュームの瞬間と市場が専門家の関心を持たない瞬間を観察することができます 「スマートマネー」の動きではなく、慣性によって市場が動いている瞬間を特定します。 ユーザーが変更できる4色で構成されています。 赤=オファーの増加 緑=需要の増加 灰色のキャンドル=需要と供給の減少 青=スマートマネー演技 上方向への動きは強さを示します。 下向きの動き弱さを示します。 価格の方向に関係なく、最強のボリュームが上がる必要があります。 R.Wyckoffの理論に基づいて作成されたインジケーター
Tick Chart — full-featured chart for MetaTrader 5. A utility for creating and working with a tick chart in the MetaTrader 5 terminal. You can create a tick chart that works exactly the same as a regular chart. You can apply indicators, Expert Advisors and scripts to the tick chart. You get a fully functional tick chart on which you can work just as well as on a regular chart. You can enable the output of the Ask price data. The data are generated in the form of the upper shadow of a tick bar. Fr
Trader Evolution
Siarhei Vashchylka
5 (3)
" Trader Evolution " - A utility designed for traders who use wave and technical analysis in their work. One tab of the utility is capable of money management and opening orders, and the other can help in making Elliott wave and technical analysis. Manual (Be sure to read before purchasing) | Version for MT4 Advantages 1. Trading in a few clicks. Immediate and pending orders are available in the panel 2. Money management. The program automatically selects the appropriate lot size 3. Simpli
The market is unfair if only because 10% of participants manage 90% of funds. An ordinary trader has slim changes to stand against these "vultures". This problem can be solved. You just need to be among these 10%, learn to predict their intentions and move with them. Volume is the only preemptive factor that faultlessly works on any timeframe and symbol. First, the volume appears and is accumulated, and only then the price moves. The price moves from one volume to another. Areas of volume accumu
TradeMirrorは、MT4/MT5プラットフォーム用のトレードコピーEAです。 TradeMirrorを選ぶ理由 金融ソフトウェアにはセキュリティ、安定性、プライバシーが重要であることを理解しているため、この3つの要素を細部にわたって固めるために、さらなる努力を重ねています: 操作が簡単なユーザーフレンドリーなグラフィカルインターフェースを提供 プライバシーとセキュリティを重視し、注文の分配にプライバシーが要求される様々な金融シナリオに適していること 注文の正確な複製、ミリ秒単位での配信 フルプラットフォーム、MT4またはMT5をサポート  システム状況のインテリジェントな認識、メール通知で取引の安全性をガード コア機能一覧 フォローアップソフトは、機能が多ければ良いというものではないので、厳密な需要分析の後、プログラムを合理化し、最終的に以下のコア機能を保持しました。 マルチコネクション メール通知機能 ロットスケーリング 信号のフィルタリング 逆指値注文 テイクプロフィット/ストップロスのリセット 無料デモ Trademirrorを購入する前に、いつでも無料のデモを試すこと
Alpha Trend Pro
Eslam Mohamed Abdelrady Shehata
Alpha Trend Pro: Your Ultimate Trading Companion Embark on a new era of trading with Alpha Trend Pro Indicator. Crafted with precision and innovation, Alpha Trend is designed to elevate your trading experience by seamlessly blending powerful elements to navigate various market conditions. **Key Features:** **1. Dynamic Adaptability:**    - In sideways market conditions, Alpha Trend acts as a dead indicator. Say goodbye to many false signals and welcome a tool that adapts seamlessly to mar
この指標は、1 日のうちで最大の取引活動の時間を決定するように設計されています。 この計算の後、インジケーターは最も重要な取引レベルを構築します。 これらのレベルを実際の値動きと比較することで、市場トレンドの強さと方向性に関する情報を得ることができます。 指標の特徴 時間枠は D1 未満である必要があります。 推奨される時間枠: M15、M30、および H1。 H1 を超える時間枠は、非常に大まかな状況を示す可能性があります。 また、M15 未満の時間枠を使用すると、取引が短期間で急増する可能性があります。 指標は過去のデータに敏感です。 したがって、チャート ウィンドウに少なくとも 50,000 バーを設定することをお勧めします。 指標パラメータ 基準 - 取引活動を計算するための基準期間を設定します。 day - 取引活動は、時刻を考慮して計算されます。 week – 取引活動は、時刻と曜日を考慮して計算されます。 Width - 線幅。 ClrMean、ClrUp、および ClrDn は、中間、上位、および下位の取引レベルの色です。 Style1 - Style5
The professional tool of stock traders in now available on MetaTrader 5 . The Actual depth of market chart indicator visualizes the depth of market in the form of a histogram displayed on a chart, which refreshes in the real-time mode. Meet new updates according to user requests! Now Actual Depth of Market indicator displays the current ratio of volume of buy and sell requests (B/S ratio). It shows the share of volume of each type of requests in the entire flow of requests as well as the absol
Before installing the HeatMap indicator make sure you are using a broker that gives you access to the Depth of market (DOM) !! This indicator creates a heatmap on your chart allowing you to see the buy or sell limit orders easily and in real time. You have the possibility to change the setting and the colors of the HeatMap in order to adapt to all markets and all charts. Here is an example of a setting you can use with the NASDAQ100 on the AMPGlobal broker :  https://www.youtube.com/watch?v=x0
This new unique indicator Actual tick footprint (volume chart) is developed for using on Futures markets, and it allows seeing the volume of real deals right when they are performed. The indicator Actual tick footprint (volume chart) represents a greatly enhanced tick chart that includes additional information about the volume of deal performed at a specific price. In addition, this unique indicator for MetaTrader 5 allows to clearly detecting a deal type – buy or sell. Alike the standard tick c
A huge number of traders use the VolumeProfile/MarketProfile analysis method. And I think there is no need to explain such concepts as POC and VAH/VAL. However, the standard VolumeProfile representation has a drawback - we only see the current picture of the market. We see the "convexity" of the volume distribution within the period. But we don't see the main thing - the "migration" of the POC level during the price movement. Our indicator is unique. It is dynamic. The first feature is that the
Cumulative delta indicator As most traders believe, the price moves under the pressure of market buying or selling. When someone redeems an offer standing in the cup, the deal is a "buy". If someone pours into the bid standing in the cup - the deal goes with the direction of "sale". The delta is the difference between purchases and sales. A cumulative delta - the difference between the cumulative sum of purchases and sales for a certain period of time. It allows you to see who is currently contr
1. What is this         Rising volatility and falling volatility are not the same, whether it is academic research or actual testing has shown this point.         The original ATR indicator is calculated by putting up and down fluctuations together. This indicator is to calculate separately the upward volatility and the downward volatility, which can better help you study the market. 2. Indicator description          There are two modes for the calculation of this indicator, as shown in the f
このプロダクトを購入した人は以下も購入しています
まず第一に、このトレーディングシステムがノンリペイント、ノンリドロー、ノンラグのインジケーターであることを強調する価値がある。これにより、手動取引とロボット取引の両方に理想的なものになっています。 「スマートトレンドトレーディングシステム MT5」は、新規および経験豊富なトレーダー向けにカスタマイズされた包括的なトレーディングソリューションです。10以上のプレミアムインジケーターを組み合わせ、7つ以上の堅実なトレーディング戦略を備えており、多様な市場状況に対応する多目的な選択肢となっています。 トレンドフォロー戦略:トレンドを効果的に乗り越えるための正確なエントリーとストップロス管理を提供します。 リバーサル戦略:潜在的なトレンドの反転を特定し、トレーダーがレンジ相場を活用できるようにします。 スキャルピング戦略:高速で正確なデイトレードおよび短期取引のために設計されています。 安定性:すべてのインジケーターはノンリペイント、ノンリドロー、ノンラグであり、信頼性の高いシグナルを保証します。 カスタマイズ:個々の取引の嗜好に合わせたカスタム戦略をサポートします。7つ以上の戦略と組み合わせ
まず第一に、この取引インジケーターは再描画されず、再描画されず、遅延しないことを強調する価値があります。これにより、手動取引とロボット取引の両方に理想的なものになります。 アトミックアナリストは、価格の強さとモメンタムを利用して市場でより良いエッジを見つけるためのPA価格アクションインジケーターです。ノイズや誤ったシグナルを除去し、取引ポテンシャルを高めるための高度なフィルターを備えています。複雑なインジケーターの複数のレイヤーを使用して、アトミックアナリストはチャートをスキャンし、複雑な数学的計算をシンプルなシグナルと色に変換します。これにより、どのような初心者トレーダーでも理解して使用し、一貫した取引の決定を行うことができます。 「アトミックアナリスト」は、新規および経験豊富なトレーダー向けにカスタマイズされた包括的な取引ソリューションです。プレミアムインジケーターとトップノッチの機能を1つの取引戦略に組み合わせ、すべてのタイプのトレーダーにとって汎用性のある選択肢にします。 デイリートレーディングとスキャルピング戦略:高速で正確なデイトレーディングおよび短期トレード
ご紹介   クォンタム トレンド スナイパー インジケーターは 、トレンド反転を特定して取引する方法を変革する画期的な MQL5 インジケーターです。 13年以上の取引経験を持つ経験豊富なトレーダーのチームによって開発されました。     クォンタムトレンドスナイパーインジケーター   は、非常に高い精度でトレンドの反転を識別する革新的な方法で、あなたのトレーディングの旅を新たな高みに押し上げるように設計されています。 ***Quantum Trend Sniper Indicatorを購入すると、Quantum Breakout Indicatorを無料で入手できます!*** クォンタム ブレイクアウト インジケーターは、トレンドの反転を特定するとアラートを発し、矢印を示し、3 つのテイクプロフィットレベルを提案します。 初心者トレーダーにもプロのトレーダーにも適しています。 量子EAチャネル:       ここをクリック MT4のバージョン:       ここをクリック 推奨事項: 期間:すべての時間枠。最良の結果を得るには、M
FX Volume MT5
Daniel Stein
4.94 (17)
mql5と Telegramの モーニング・ブリーフィングで、詳細とスクリーンショットを含む毎日のマーケット・アップデートをご覧 ください! FX Volumeは、ブローカーの視点から市場のセンチメントをリアルに洞察する、最初で唯一の出来高インジケーターです。 ブローカーのような機関投資家が外国為替市場でどのようなポジションをとっているか、COTレポートよりもはるかに速く、素晴らしい洞察を提供します。 この情報をチャート上で直接見ることは、あなたの取引にとって真のゲームチェンジャーであり、画期的なソリューションです。 以下のようなユニークなマーケットデータ洞察から利益を得てください。 比率は 、通貨のロングポジションとショートポジションの比率をパーセントで表示します。 比率の変化は 、選択した期間内のロング比率とその変化率を表示します。 Volumes Totalは 、通貨の取引量(ロングとショート)の合計をロット単位で表示します。 Volumes Long :全通貨のロングポジションの取引量を表示します。 Volumes(ショート )は、全通貨のショートポジションの取引量を表示
トレンド スクリーナー インジケーターでトレンド取引の力を解き放ちます。ファジー ロジックと複数通貨システムを活用した究極のトレンド取引ソリューションです。 ファジー ロジックを活用した革新的なトレンド インジケーターである Trend Screener を使用して、トレンド取引を向上させます。 これは、13 を超えるプレミアム ツールと機能、および 3 つの取引戦略を組み合わせた強力なトレンド追跡インジケーターであり、Metatrader をトレンド アナライザーにする多用途の選択肢となります。 期間限定オファー : トレンド スクリーナー インジケーターは、わずか 50 ドルで生涯ご利用いただけます。 (元の価格 125$ ) (オファー延長) Trend Screener の 100% 非再描画精度の揺るぎない精度を体験して、取引の決定が過去の価格変動の影響を受けないようにしてください。 マルチタイムフレームおよびマルチ通貨機能の多用途性を解放し、比類のない自信を持って外国為替、商品、暗号通貨、インデックスの世界を取引できるようにします。 Trend Screener の包括的な
まず第一に、この取引ツールはノンリペイント、ノンリドロー、ノンラグの指標であり、プロの取引に理想的ですことを強調する価値があります。 スマートプライスアクションコンセプトインジケーターは、新米から経験豊富なトレーダーまで、非常 に強力なツールです。Inner Circle Trader AnalysisやSmart Money Concepts Trading Strategiesなど、20以上の有用な指標を1つに組み合わせています。このインジケーターはスマートマネーコンセプトに焦点を当て、大手機関の取引方法を提供し、彼らの動きを予測するのに役立ちます。 特に、流動性分析に優れており、機関がどのように取引しているかを理解しやすくしています。市場のトレンドを予測し、価格の動きを慎重に分析するのに優れています。機関の戦略とトレードを合わせることで、市場の動向についてより正確な予測ができます。このインジケーターは多目的であり、市場構造を分析し、重要な注文ブロックを特定し、さまざまなパターンを認識するのに優れています。 このインジケーターはBOSやCHoCHなどのパターンの識
mql5と Telegramの モーニング・ブリーフィングで、詳細とスクリーンショットを含む毎日のマーケット・アップデートをご覧 ください! FX Power MT5 NGは 、長年の人気を誇る通貨強度計FX Powerの次世代モデルです。 この次世代ストレングスメーターは何を提供するのでしょうか?初代FXパワーの魅力すべて プラス GOLD/XAUの強さ分析 より正確な計算結果 個別に設定可能な分析期間 カスタマイズ可能な計算上限値により、さらに優れたパフォーマンスを実現 もっと見たい人のための特別なマルチインスタンス設定 すべてのチャートでお好みの色を無限に設定可能 数え切れないほどの通知オプションにより、重要なことを見逃すことはありません。 Windows 11とmacOSのスタイルで角を丸くした新しいデザイン 魔法のように動くインジケーターパネル FXパワーの主な機能 すべての主要通貨の強さの完全な履歴 すべての時間枠における通貨の強さの履歴 すべてのブローカーとチャートで同一の計算結果 100%信頼できるリアルタイム計算 -> リペイントなし ドロップダウン・リストから
現在33%オフ 初心者にもエキスパートトレーダーにも最適なソリューション このインジケーターは独自の機能と新しい公式を多数内蔵しており、ユニークで高品質かつ手頃な取引ツールです。このアップデートでは、2つの時間枠ゾーンを表示できるようになります。より長いTFだけでなく、チャートTFとより長いTF(ネストゾーンを表示)の両方を表示できます。すべてのSupply Demandトレーダーの皆さんのお気に召すはずです。:) 重要情報の公開 Advanced Supply Demandの可能性を最大化するには、 https://www.mql5.com/ja/blogs/post/720245 にアクセスしてください。   エントリーまたはターゲットの正確なトリガーポイントを正確に特定できれば取引がどのように改善されるか想像してみてください。新しい基盤となるアルゴリズムに基づいて構築されているため、買い手と売り手の間の潜在的な不均衡をさらに簡単に特定できます。これは、最も強い需要と供給のゾーンと、過去のパフォーマンス(古いゾーンを表示)がグラフィカルに表現されるためです。これらの機能は、最適
今、147ドル(いくつかの更新後に499ドルに増加します) - 無制限のアカウント(PCSまたはMac) RelicusRoad ユーザー マニュアル + トレーニング ビデオ + プライベート Discord グループへのアクセス + VIP ステータス 市場の新しい見方 RelicusRoad は、外国為替、先物、暗号通貨、株式、および指数の世界で最も強力な取引インジケーターであり、トレーダーに収益を維持するために必要なすべての情報とツールを提供します。初心者から上級者まで、すべてのトレーダーが成功するためのテクニカル分析と取引計画を提供します。これは、将来の市場を予測するのに十分な情報を提供する重要な取引指標です。意味をなさないチャート上のいくつかの異なる指標ではなく、完全な解決策を信じています.これは、信号、矢印 + 価格アクション情報を表示するオールインワンのインジケーターで、他に類を見ない非常に正確です。 強力な AI に基づいて、RelicusRoad は不足している情報とツールを提供して、あなたを教育し、トレーディングのプロ、成功したトレーダーにします。
Step into the realm of Forex trading with confidence and precision using XQ, a cutting-edge Forex indicator designed to elevate your trading game to unprecedented heights. Whether you're a seasoned trader or just stepping into the world of currency exchange, XQ Forex Indicator empowers you with the insights and signals needed to make informed trading decisions. The signal conditions are a combination of three indicators, and XQ Forex Indicator only display  medium and long-term trends . The ind
Auto Order Block with break of structure based on ICT and Smart Money Concepts Futures Break of Structure ( BoS )             Order block ( OB )            Higher time frame Order block / Point of Interest ( POI )    shown on current chart           Fair value Gap ( FVG ) / Imbalance   ,  MTF      ( Multi Time Frame )    Volume Imbalance     ,  MTF          vIMB Gap’s Equal High / Low’s     ,  MTF             EQH / EQL Liquidity               Current Day High / Low           HOD /
これはMT5のインジケーターで、再描画なしで取引に参入するための正確なシグナルを提供します。 外国為替、暗号通貨、金属、株式、インデックスなど、あらゆる金融資産に適用できます。かなり正確な見積もりを提供し、取引を開始して終了するのに最適な時期を教えてくれます。1つのシグナルを処理しただけでインジケーターの元が取れた例の 動画 (6:22)をご覧ください。Entry PointsPro インジケーターの助けを借りたほとんどのトレーダーの最初の1週間の結果が改善しています。 Telegramグループ に登録してください。Entry Points Proインジケーターのメリットは次の通りです。 再描画のないエントリーシグナル 再描画されるインジケーターでは一度表示されたシグナルが削除されて大きな金銭的損失につながることがありますが、これと異なり、表示されて確認されたシグナルは消えることがありません。 エラーなしの取引開始 インジケーターアルゴリズムによって取引を開始する(資産を売買する)理想的な瞬間を見つけることができます。それを使用するすべてのトレーダーの成功率が向上します。
ICT, SMC, SMART MONEY CONCEPTS, SMART MONEY, Smart Money Concept, Support and Resistance, Trend Analysis, Price Action, Market Structure, Order Blocks, BOS/CHoCH,   Breaker Blocks ,  Momentum Shift,   Supply&Demand Zone/Order Blocks , Strong Imbalance,   HH/LL/HL/LH,    Fair Value Gap, FVG,  Premium  &   Discount   Zones, Fibonacci Retracement, OTE, Buy Side Liquidity, Sell Side Liquidity, BSL/SSL Taken, Equal Highs & Lows, MTF Dashboard, Multiple Time Frame, BigBar, HTF OB, HTF Market Structure
ブレーカートレーダーになり、価格が反転すると市場構造からの利益が変化します。 注文ブロックブレーカーインジケーターは、トレンドまたは価格の動きが枯渇に近づいており、逆転の準備ができていることを識別します。通常、反転または大規模なプルバックが発生しようとしているときに発生する市場構造の変化について警告します。 この指標は、ブレイクアウトと価格の勢いを識別する独自の計算を使用します。使い果たされる可能性のあるポイントの近くで新しい高値が形成されるたびに、インディケーターはその高値の作成を担当する最後の注文ブロックを描きます。次に、移動する価格とともに注文ブロックを追跡します。その後、価格が反対方向にシフトし、その注文ブロックを突破すると、新しい市場構造を作成し、トレンドまたは大きな後退の可能性のある反転の開始を警告します。 注文ブロックは、高値/安値が作成される前の最後の反対色のろうそくであり、価格がこれらの重要な領域を下抜けすると、トレンドの短期的ま​​たは長期的な反転の兆候です。 特徴 重要な枯渇点での市場構造の変化を警告します 価格が使い果たされるレベルに近づくと、
Gannスクエアインジケーターは、W.D. Gannによって執筆された「市場予測のための数学的な式」の記事に基づく強力な市場分析ツールです。このツールは、解析に数学的な概念を応用し、Gann理論に基づいています。それは、144、90、52のスクエアや9のスクエアなど、Gannの関連テクニックの要素を取り入れています。さらに、の方法を組み込んでおり、9のスクエアとその関連性についてのチャネルやスターパターンに焦点を当てています。 ユーザーマニュアルと使用方法: このインジケーターを使用する前に、ユーザーマニュアルを読んで疑問点を解決するためにお問い合わせいただくことをお勧めします。ユーザーマニュアルの完全版は、当社のウェブサイトで入手できます。 MT5の完全版は購入できますし、MT4の無料版も試すことができます。両方のバージョンへのリンクを提供していますので、ご利用ください。 主な機能と機能: Gannスクエアインジケーターは、市場分析のための完全なツールセットを提供し、幾何学的な概念とGann理論に基づいて的確な判断を行う手助けをします。以下に主な機能を示します。 9のスクエアの分析:
トレンドラインマップインジケーターは、トレンドスクリーナーインジケーターのアドオンです。トレンドスクリーナー(トレンドラインシグナル)によって生成されたすべてのシグナルのスキャナーとして機能します。 これは、トレンドスクリーナーインジケーターに基づくトレンドラインスキャナーです。 Trend Screener Pro インジケーターがない場合、Trend Line Map Proは機能しません。 It's a Trend Line Scanner based on Trend Screener Indicator. If you don't have Trend Screener Pro Indicator,     the Trend Line Map Pro will not work . ブログにアクセスすると、トレンドラインマップインジケーターの無料バージョンをダウンロードできます。 Metatrader Testerの制限なしで、購入する前に試してみてください。 :  ここをクリック 1.簡単になる利点 通貨と時間枠に基づいて売買シグナルを表示し
TrendLine PRO MT5
Evgenii Aksenov
4.78 (49)
The Trend Line PRO indicator is an independent trading strategy. It shows the trend change, the entry point to the transaction, as well as automatically calculates three levels of Take Profit and Stop Loss protection Trend Line PRO is perfect for all Meta Trader symbols: currencies, metals, cryptocurrencies, stocks and indices Advantages of Trend Line PRO Never redraws its signals The possibility of using it as an independent strategy It has three automatic levels Take Profit and Stop Loss lev
ご紹介     Quantum Breakout PRO は 、ブレイクアウト ゾーンの取引方法を変革する画期的な MQL5 インジケーターです。 13年以上の取引経験を持つ経験豊富なトレーダーのチームによって開発されました。     クォンタム ブレイクアウト プロ   は、革新的でダイナミックなブレイクアウト ゾーン戦略により、あなたのトレーディングの旅を新たな高みに押し上げるように設計されています。 クォンタム ブレイクアウト インジケーターは、5 つの利益ターゲット ゾーンを備えたブレイクアウト ゾーン上のシグナル矢印と、ブレイクアウト ボックスに基づいたストップロスの提案を提供します。 初心者トレーダーにもプロのトレーダーにも適しています。 量子EAチャネル:       ここをクリック 重要!購入後、インストールマニュアルを受け取るためにプライベートメッセージを送ってください。 推奨事項: 時間枠: M15 通貨ペア: GBPJPY、EURJPY、USDJPY、NZDUSD、XAUUSD アカウントの種類: ECN、Raw、またはス
MT4版  |  FAQ Owl Smart Levels Indicator は、 Bill Williams の高度なフラクタル、市場の正しい波構造を構築する Valable ZigZag、エントリの正確なレベルをマークする Fibonacci レベルなどの一般的な市場分析ツールを含む 1 つのインジケーター内の完全な取引システムです。 利益を得るために市場と場所に。 戦略の詳細な説明 インジケータを操作するための指示 顧問-取引助手 プライベートユーザーチャット ->購入後に私に書いて、私はプライベートチャットにあなたを追加し、あなたはそこにすべてのボーナスをダウンロードすることができます 力はシンプルさにあります! Owl Smart Levels 取引システムは非常に使いやすいので、専門家にも、市場を勉強し始めて自分で取引戦略を選択し始めたばかりの人にも適しています。 戦略と指標に秘密の数式や計算方法が隠されているわけではなく、すべての戦略指標は公開されています。 Owl Smart Levels を使用すると、取引を開始するためのシグナルをすばやく確認し、注文を出すため
AW Trend Predictor MT5
AW Trading Software Limited
4.76 (54)
1 つのシステムでのトレンド レベルとブレイクダウン レベルの組み合わせ。高度なインジケーター アルゴリズムは、市場のノイズをフィルター処理し、トレンド、エントリー ポイント、および可能なエグジット レベルを決定します。インジケーターシグナルは統計モジュールに記録されるため、最適なツールを選択してシグナル履歴の有効性を示すことができます。この指標は、テイクプロフィットとストップロスのマークを計算します。 マニュアルと説明書 ->   ここ / MT4 バージョン ->   ここ インジケーターで取引する方法: Trend Predictor での取引は、たった 3 つの簡単なステップです。 ステップ 1 - ポジションを開く 70% 以上の成功率で買いシグナルが受信されました ステップ 2 - ストップロスの決定 逆信号でトランクを選択 ステップ 3 - テイクプロフィット戦略の定義 戦略 1: TP1 に到達したらポジション全体をクローズする 戦略 2: TP1 に達した時点でポジションの 50% をクローズし、TP2 に達した時点で残りの 50% をクローズします。 戦略 3:
Gartley Hunter Multi - An indicator for searching for harmonic patterns simultaneously on dozens of trading instruments and on all classic timeframes: (m1, m5, m15, m30, H1, H4, D1, Wk, Mn). Manual (Be sure to read before purchasing) | Version for MT4 Advantages 1. Patterns: Gartley, Butterfly, Shark, Crab. Bat, Alternate Bat, Deep Crab, Cypher 2. Simultaneous search for patterns on dozens of trading instruments and on all classic timeframes 3. Search for patterns of all possible sizes. Fr
TPSpro TRENDPRO  - is a trend indicator that automatically analyzes the market and provides information about the trend and each of its changes, as well as giving signals for entering trades without redrawing! The indicator uses each candle, analyzing them separately. referring to different impulses - up or down impulse. Exact entry points into transactions for currencies, crypto, metals, stocks, indices!  -  Version MT4                  DETAILED DESCRIPTION        /       TRADING SETUPS       
Golden Spikes Detector This indicator is based on an advanced strategy primarily for trading spikes on Boom and Crash Indices. Complex algorithms were implemented to detect high probability entries only. It alerts on potential Buy and Sell entries. To trade spikes on the Deriv or Binary broker, only take Buy Boom and Sell Cash alerts. It was optimised to be loaded on 5-minute timeframe although multiple timeframe analysis is done in the background. Features ·             Desktop pop up and sound
Matrix Arrow Indicator MT5
Juvenille Emperor Limited
5 (14)
マトリックスアローインジケーターMT5は、すべてのシンボル/商品(外国為替、商品、暗号通貨、インデックス、株式)で使用できる100%再描画されていないマルチタイムフレームインジケーターに続くユニークな10in1トレンドです。マトリックスアローインジケーターMT5は、初期段階で現在のトレンドを判断し、最大10の標準インジケーターから情報とデータを収集します。 平均方向移動指数(ADX) 商品チャネルインデックス(CCI) クラシック平研アシキャンドル 移動平均 移動平均収束発散(MACD) 相対活力指数(RVI) 相対力指数(RSI) 放物線SAR ストキャスティクス ウィリアムズのパーセント範囲 すべてのインジケーターが有効な買いまたは売りシグナルを与えると、対応する矢印がチャートに印刷され、次のろうそく/バーの開始時に強い上昇トレンド/下降トレンドを示します。ユーザーは、使用するインジケーターを選択し、各インジケーターのパラメーターを個別に調整できます。マトリックスアローインジケーターMT5は選択されたインディケーターからのみ情報を収集し、それらのデータのみに基づいてアローを印
IX Powerは 、FX Powerの無敵の精度をついにFX以外のシンボルにも提供します。 お気に入りの指数、株式、コモディティ、ETF、さらには暗号通貨の短期、中期、長期のトレンドの強さを正確に判断します。 お使いの端末が提供する すべてを分析する ことができます。ぜひお試しいただき、取引 タイミングが大幅に改善 されることをご体験ください。 IXパワーの主な特徴 100%正確で再描画されない計算結果 - ターミナルで利用可能なすべての取引シンボルに対して 予め設定され、さらに個別に設定可能な強度分析期間のドロップダウン選択 Eメール、メッセージ、モバイル通知による無数の通知オプション EAリクエストのためのアクセス可能なバッファ カスタマイズ可能な計算制限により、さらに優れたパフォーマンスを実現 もっと見たい人のための特別なマルチインスタンス設定 すべてのチャートでお好みの色を無限に設定可能 Windows 11とmacOSのスタイルで角を丸くした新しいパネルデザイン サブ・ウィンドウとメイン・チャートの間をシームレスに移動する、魔法のように動くイン
Account Graph MT5
Kyra Nickaline Watson-gordon
5 (1)
An indicator to draw a graph of account current and historical state such as Balance, Equity, Margin, Free Margin, Margin Level, Drawdown, Account Profit, Deposit and Withdrawals. Indicator Inputs : Draw Balance Graph Draw Equity Graph Draw Margin Graph Draw Free Margin Graph Draw Margin Level Graph Draw Drawdown Graph Draw Account Profit Graph Hide Data on Chart and Buffers Connect Gaps by Lines Sign of DDs on Profit Sign of DDs on Loss Tips : The Indicator will draw historical balance gra
** All Symbols x All Timeframes scan just by pressing scanner button ** ***Contact me after purchase to send you instructions and add you in "123 scanner group" for sharing or seeing experiences with other users. After 15 years of experience in the markets and 3 years of programming, Winner indicator is ready. I would like to share with you! Introduction The 123 Pattern Scanner indicator with a special enhanced algorithm is a very repetitive common pattern finder with a high success rate . Inte
これは上値と下値を判断するための明確な指標であり、変動する市場に適しています。 キャンペーン価格 49$ → 59$ 特徴 上下の判断がうまい 再描画なし、ドリフトなし 高速計算、ラグなし リッチ リマインダー モード 複数のパラメータと色を調整できます パラメータ 「========メイン========= HighLowPeriod1 = 9 HighLowPeriod2 = 60 HighLowPeriod3 = 34 HighLowEMAPeriod = 4 MASignalPeriod = 5 「========通知========= UseAlertNotify = true; UseMetaQuotesIDNotify = true; UseMailNotify = true; NotifySignalMode = 色を変更し、レベルを確認します。 ハイレベル = 80; 低レベル = 20; NofityPreMessage = "スマート ピーク ボトム"; EA コールの場合 0.ハイバッファー 1.低バッファ 2. 方向バッファ 1 アップ、0、
クリスマスセール!40% OFF!1月1日に価格が$250に値上がり! GoldenGate Entriesをご紹介します:最先端のトレーディングソリューション! GoldenGate Entries(GGE)を使用して取引する革新的なアプローチを発見しましょう。GGEは、取引体験を向上させるために設計された先進的なインジケーターで、ユーザーに正確性と自信を持たせるための包括的な機能を提供します。 通貨ペア:Any(FX - 商品 - 株式 - 株式 - クリプト) タイムフレーム:15分からH1 主な特徴: 買いと売りの矢印の指示:常に情報を受け取るために、買いと売りの矢印の指示をポップアップアラートとともに受け取ります。 GoldenGate_Algo:GoldenGate_Algoを使用して市場の状況を把握し、市場が「売り過ぎ」または「買い過ぎ」かどうかを評価する強力なツールです。 現在のトレンド分析:視聴中のタイムフレームで現在のトレンドにアクセスして、取引を市場の主流方向に合わせることができます。 組み込みのピボットポイント:組み込まれた
QM (Quasimodo) Pattern is based on Read The Market(RTM) concepts. The purpose of this model is to face the big players of the market (financial institutions and banks), As you know in financial markets, big traders try to fool small traders, but RTM prevent traders from getting trapped. This style is formed in terms of price candles and presented according to market supply and demand areas and no price oscillator is used in it. RTM concepts are very suitable for all kinds of investments, includi
作者のその他のプロダクト
IceFX’s TradeInfo is an utility indicator which displays the most important information of the current account and position. Displayed information: Information about the current account (Balance, Equity, Free Margin). Current spread, current drawdown (DD), planned profit, expected losses, etc. Number of open position(s), volume (LOT), profit. Today’s and yesterday’s range. Remaining time to the next candle. Last day profit information (with integrated IceFX ProfitInfo indicator). Risk-based LO
FREE
This very new indicator is able to unlock all advanced features of MetaTrader 4 (above build 600). This indicator can graphically represent the main data of the current account (balance, equity, free margin, current Profit/Loss, total Profit/Loss, amount of open position(s) & size, etc.) in an elegant way. On the chart AccountInfo graphically shows the account balance of recent days. Also all data can be filtered with MagicNumber, Order Comment, and symbol for the professional evaluation of a sp
FREE
IceFX DrawProfit indicator can efficiently help those traders who want to see on the chart all closed positions output: profit or loss. If you set DrawProfit on your chart managed by an Expert Advisor (EA), you will clearly see its performance by its profits & losses. Main Features: Draws closed order lines Draws profit/loss of closed orders in currency Sums orders by candles MagicNumber filter for EAs Comment filter Input parameters: ShowProfitLabels : show profit of orders with a label Pro
FREE
The goal of this indicator is to give you a quick & comprehensive view of your current profit. IceFX’s ProfitInfo is a utility indicator which displays the profit which is calculated from the actual trades on the chart(s). The indicator displays on a daily / weekly / monthly and yearly breakdown and shows the profit in pips / currency and percentage. Main features: You can easily adjust IceFX’s ProfitInfo to display profit on the current open chart / current trade or even the profit of the ent
FREE
IceFX VelocityMeter is a very unique indicator on MetaTrader 4 platform which measures the speed of the forex market. It's not a normal volume or other measurement indicator because IceFX VelocityMeter is capable to understand market speed movements which are hidden in ticks and those valuable information cannot be read in an ordinary way from the candles. The software monitors the received ticks (frequency, magnitude of change) within a specified time range, analyzes these info and defines, dis
FREE
IceFX SpreadMonitor is a special spread logging indicator which displays the current, minimum/maximum and average spread values. These values are set to be visible even after a reboot. Also, SpreadMonitor could save all the desired spread values to .csv files for later analysis of the results. Indicator parameters: SpreadLowLevel - low level of spread (show value in green color) SpreadHighLevel - high level of spread (show value in red color) BGColor - background of panel SpreadNormalColor - c
FREE
IceFX Heatmap is a special indicator that shows the places where the price has been staying and ranging over the past few days. These sites will be displayed in a "Heatmap style", with which you can clearly see the main formed bands. The main rates (where the price has "lingered/stayed" much) are indicated in bright colors (in case of black-and-white view) or red color (in case of color view). Settings Days - the number of days the heat(map) is calculated for. Resolution - resolution rate. 10
FREE
This is a unique tick chart indicator for MetaTrader 4 platform. The software is capable to graphically display the last 100 ticks and in addition to that it displays the current spread, bid / ask and time values ​​in an elegant IceFX style dashboard. The indicator is an efficient tool for traders using M5 or even M1 timeframe. Indicator parameters: Corner - corner of panel CornerXOffset - horizontal offset from the corner CornerYOffset - vertical offset from the corner ChartType - type of cha
FREE
IceFX VelocityMeter Mini is a very unique indicator on MetaTrader 4 platform which measures the speed of the Forex market . It is not a normal volume or other measurement indicator because IceFX VelocityMeter Mini is capable to understand market speed movements which are hidden in ticks and those valuable information cannot be read in an ordinary way from the candles. The software monitors the received ticks (frequency, magnitude of change) within a specified time range, analyzes these info and
フィルタ:
レビューなし
レビューに返信
バージョン 1.10 2017.05.31
Added MIN & MAX speed values to global variables