RenkoChart EA
- ユーティリティ
- Paulo Henrique Da Silva
- バージョン: 1.0
This Expert Advisor is an optional tool of the RenkoChart by Paulo Henrique indicator.
It performs the same functions as the indicator, but with an additional input parameter: "Timer to update the chart". This feature is exclusive to Expert Advisors, and allows you to generate a Timer event with a predetermined time interval.
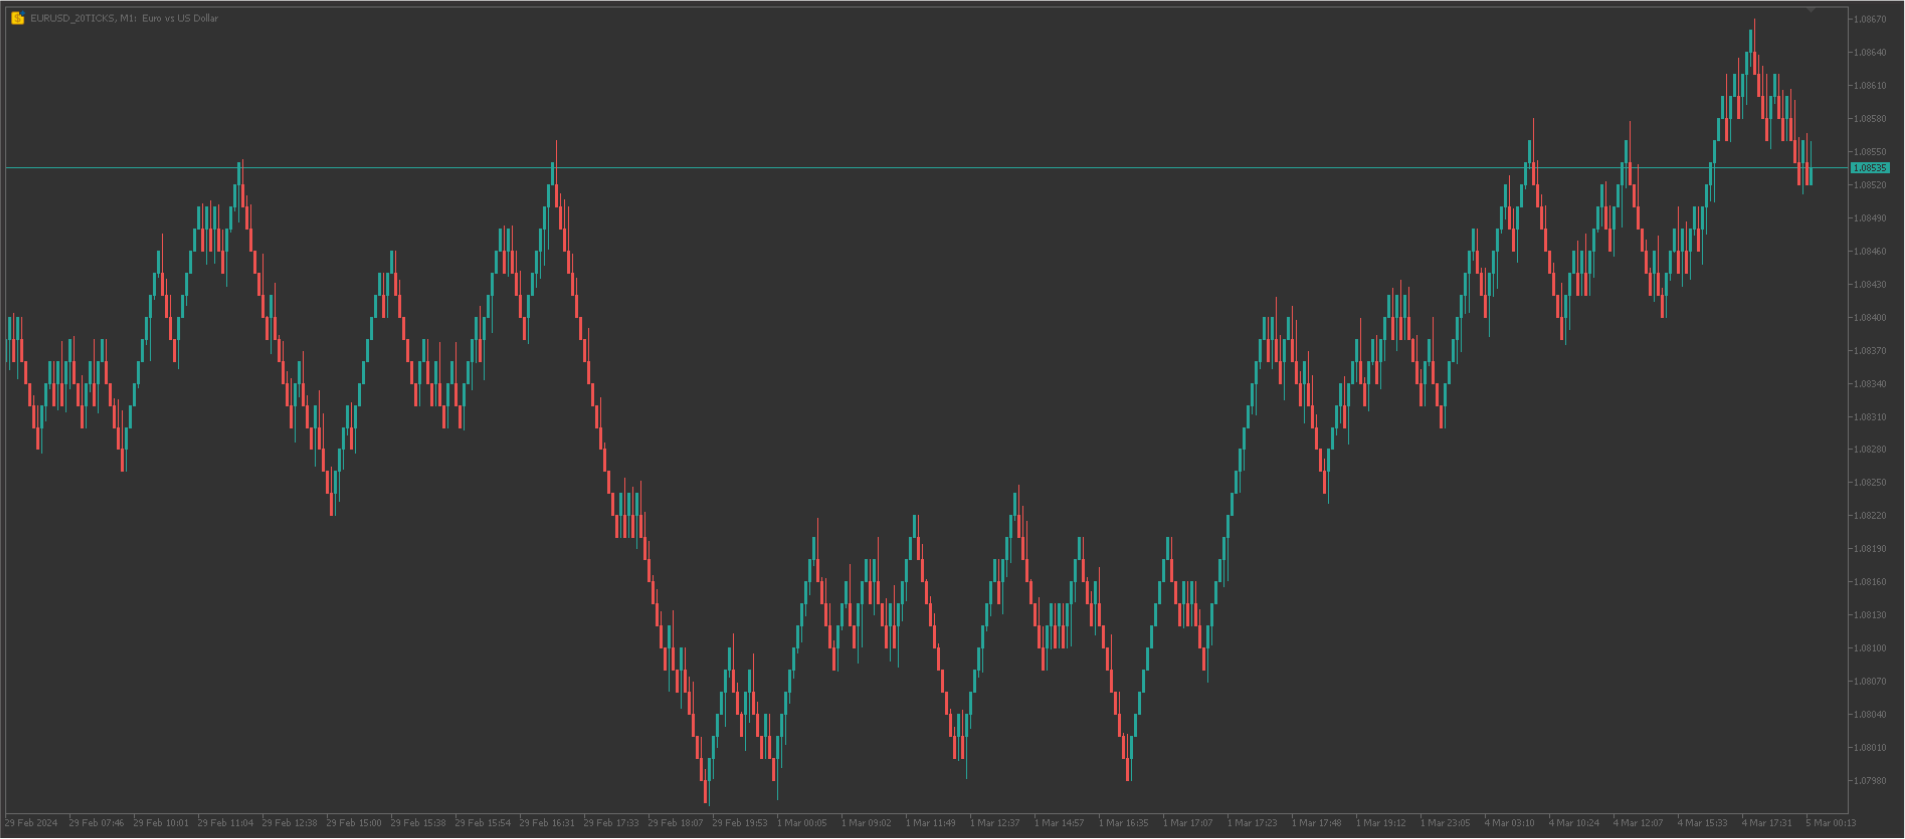
The Renko Chart tool presents an innovative and highly flexible approach to visualizing market data in MetaTrader 5.
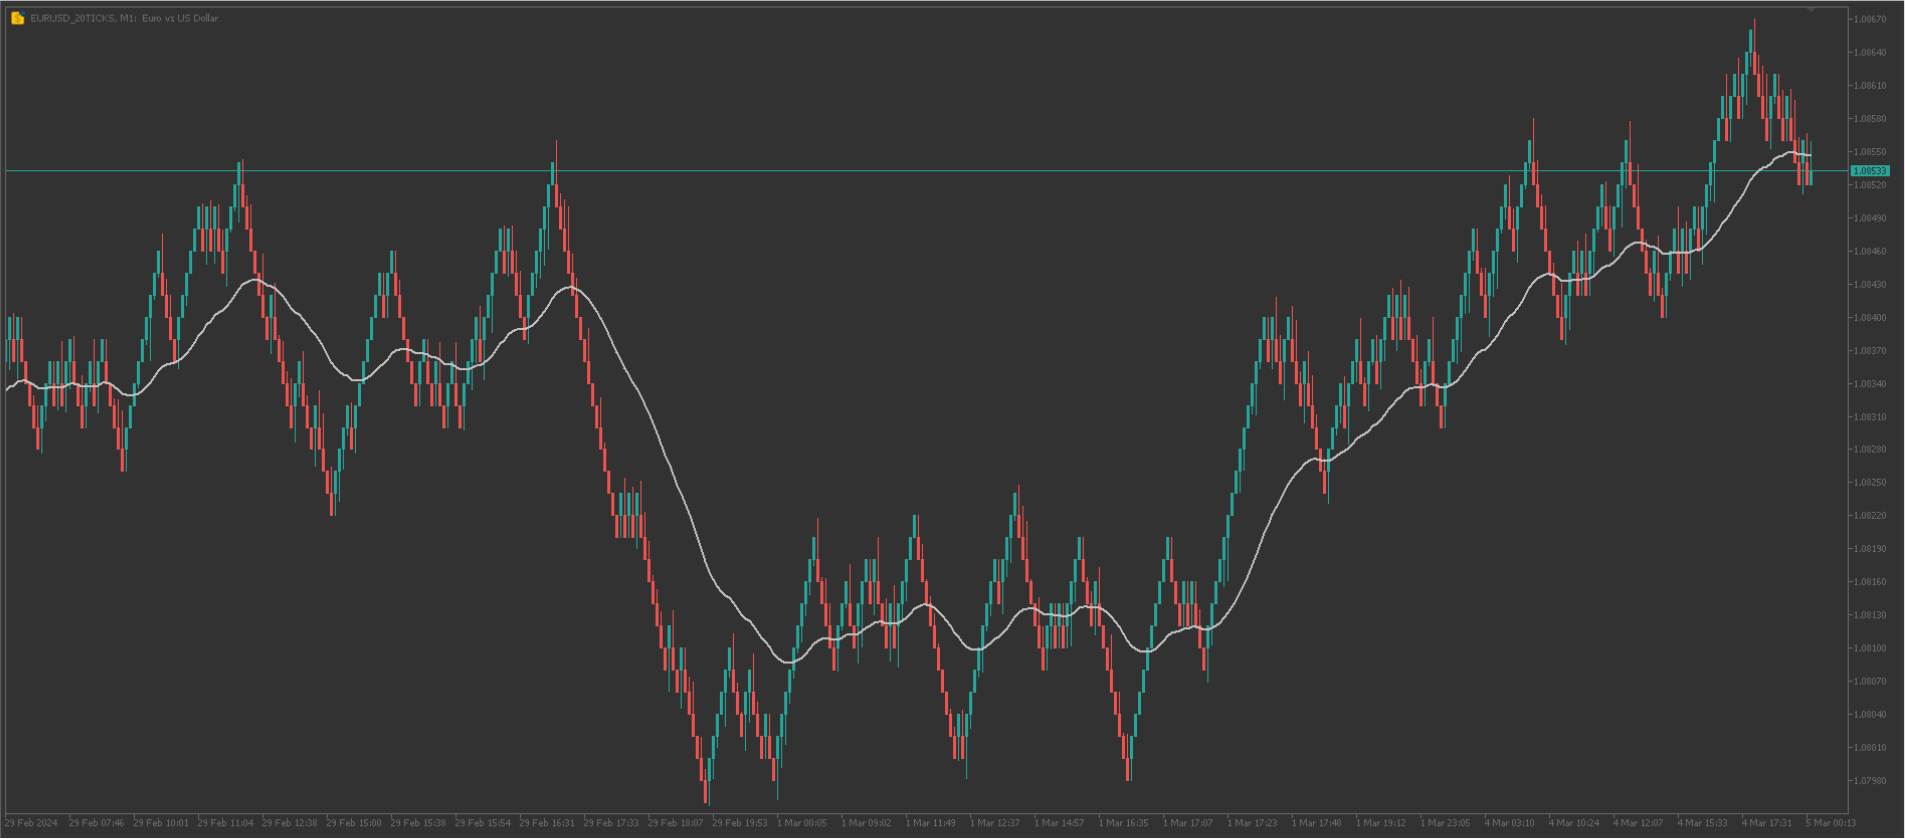
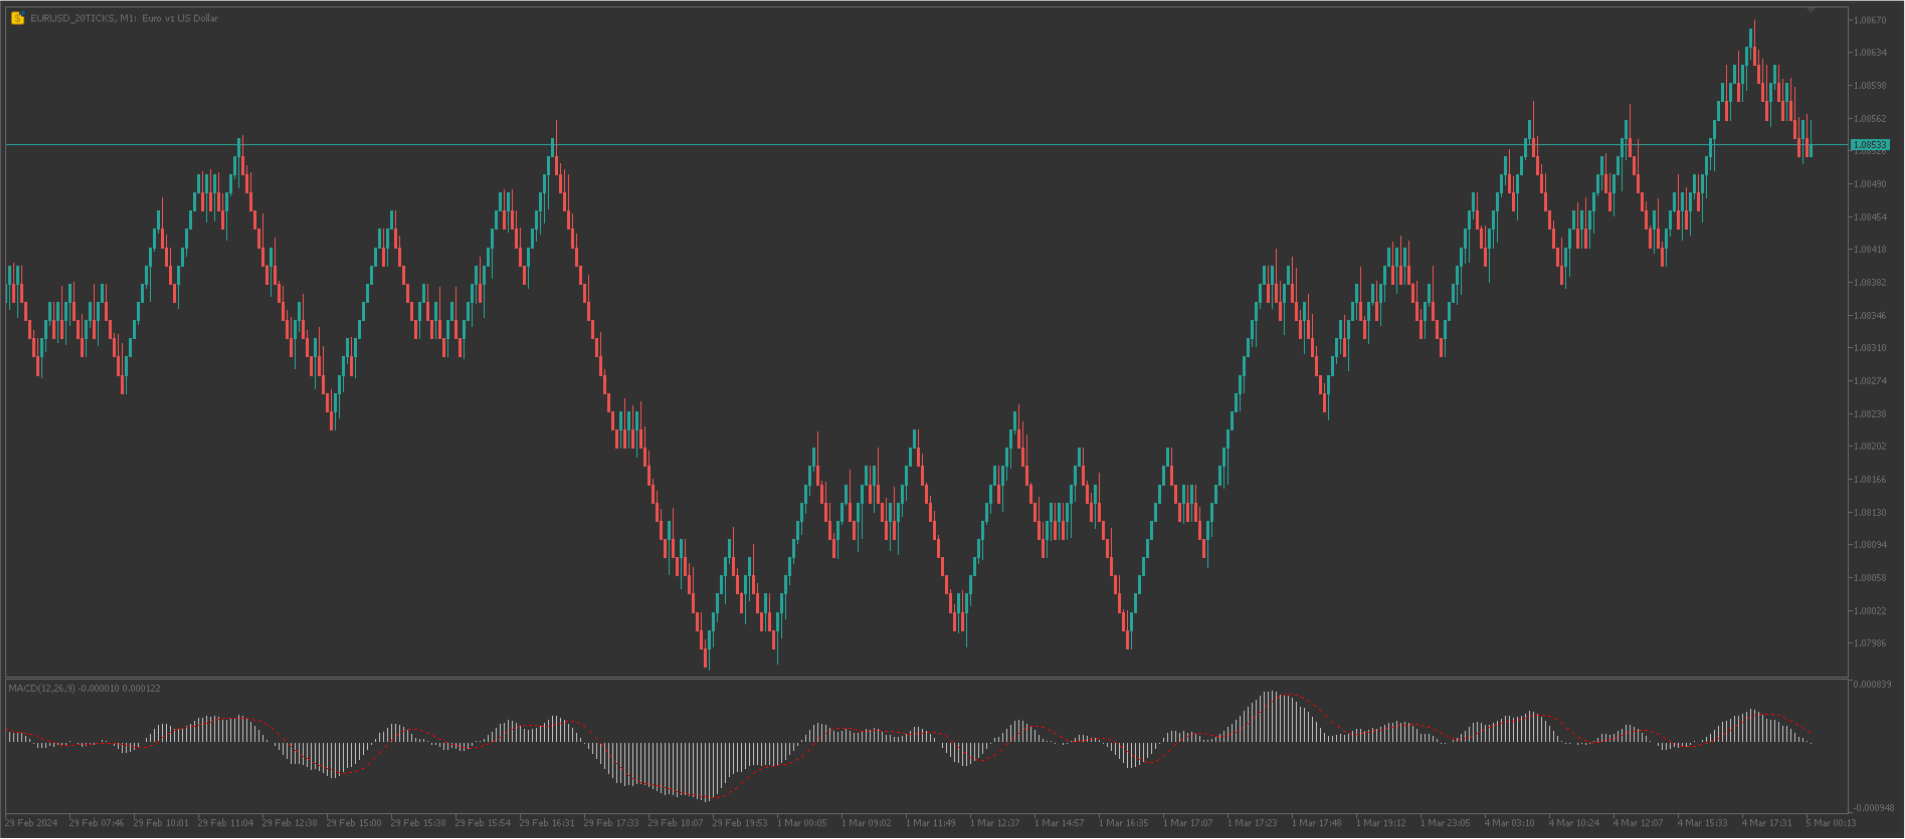
This expert creates a custom symbol with Renko bricks directly on the chart, displaying accurate prices at the respective opening date/time for each brick. This feature makes it possible to apply any indicator to the Renko chart.
Furthermore, this tool also allows access to historical brick data through native methods in the MQL5 programming language, such as iOpen, iHigh, iLow and iClose, for example.
Note:
- The renko generated at expert startup offers up to 95% accuracy for small renkos (5R) and 100% accuracy for larger renkos (from 10R) when compared to other platforms such as TradingVIEW.
- During trading hours, the renko generated has 100% accuracy, as it uses trading ticks received from the platform in real time as a data source.
- The time required to generate the Renko chart when starting the expert varies depending on some factors: number of bars on the 1-minute chart, and the size of the brick. For bricks smaller than 5R, it often takes a few seconds or minutes, while for larger bricks, the graph is generated almost instantly.
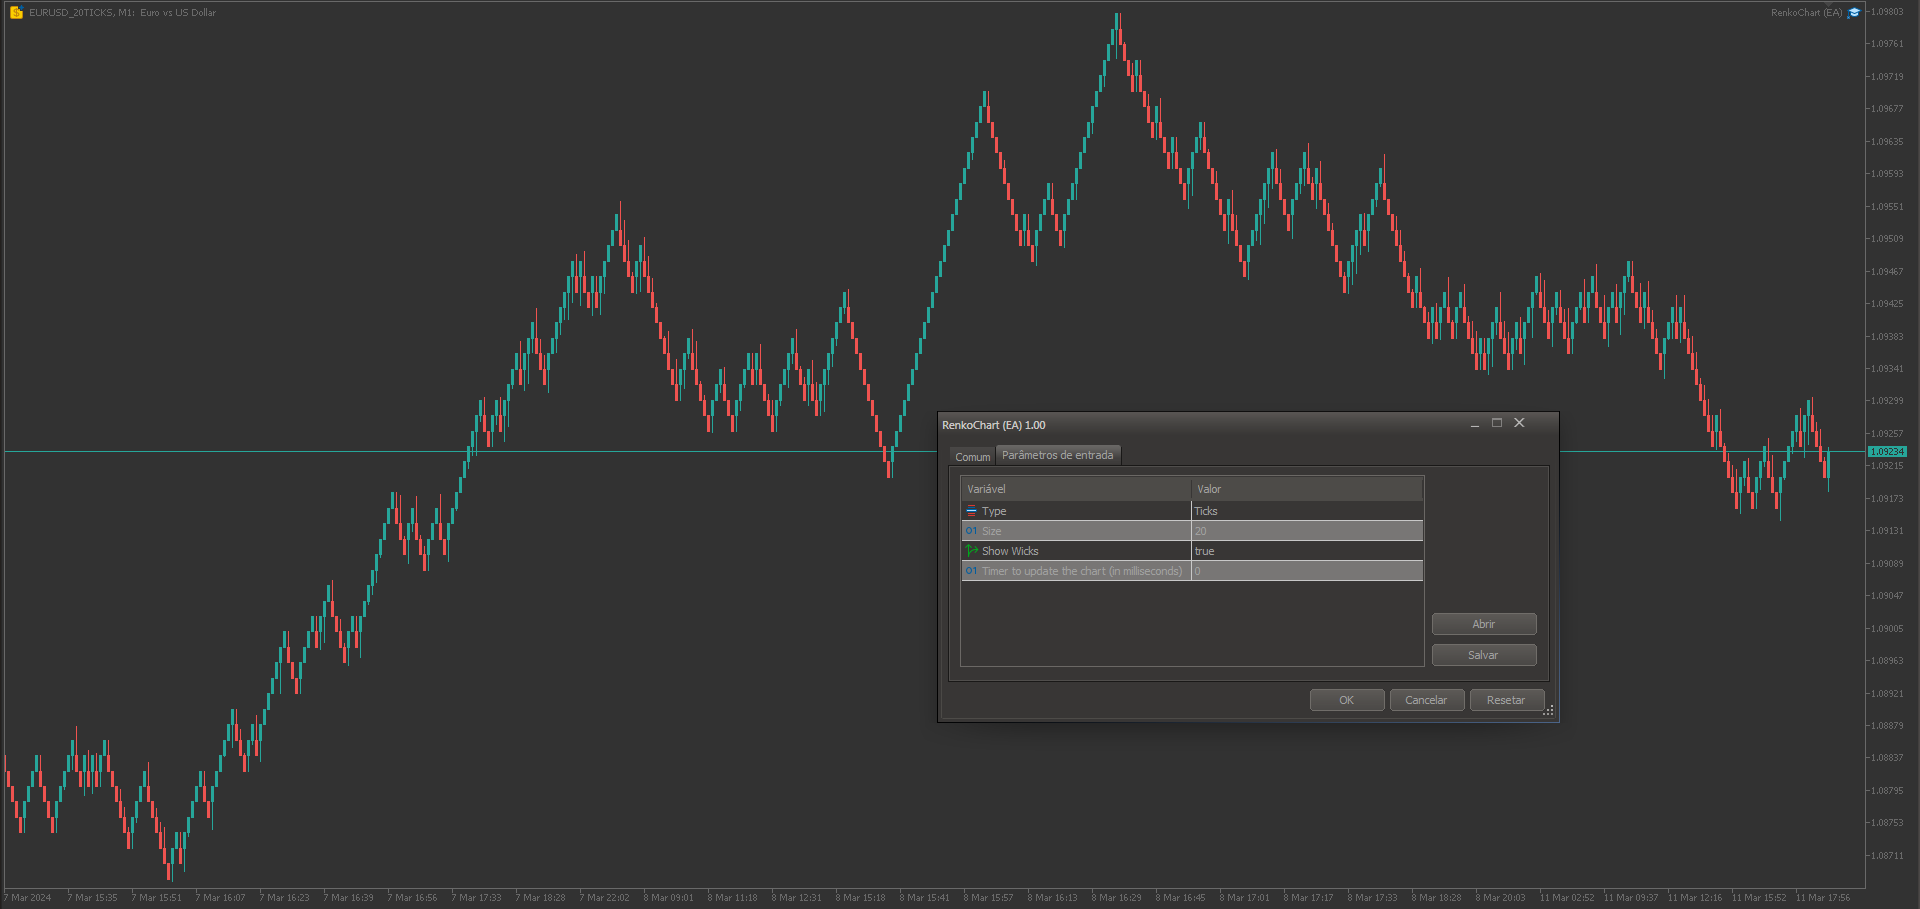
Input Parameters:
- Type (Ticks, Pips, Points or R. Default is Ticks)
- Size (default is 20)
- Show Wicks (default is true)
- Timer to update the chart (in milliseconds)
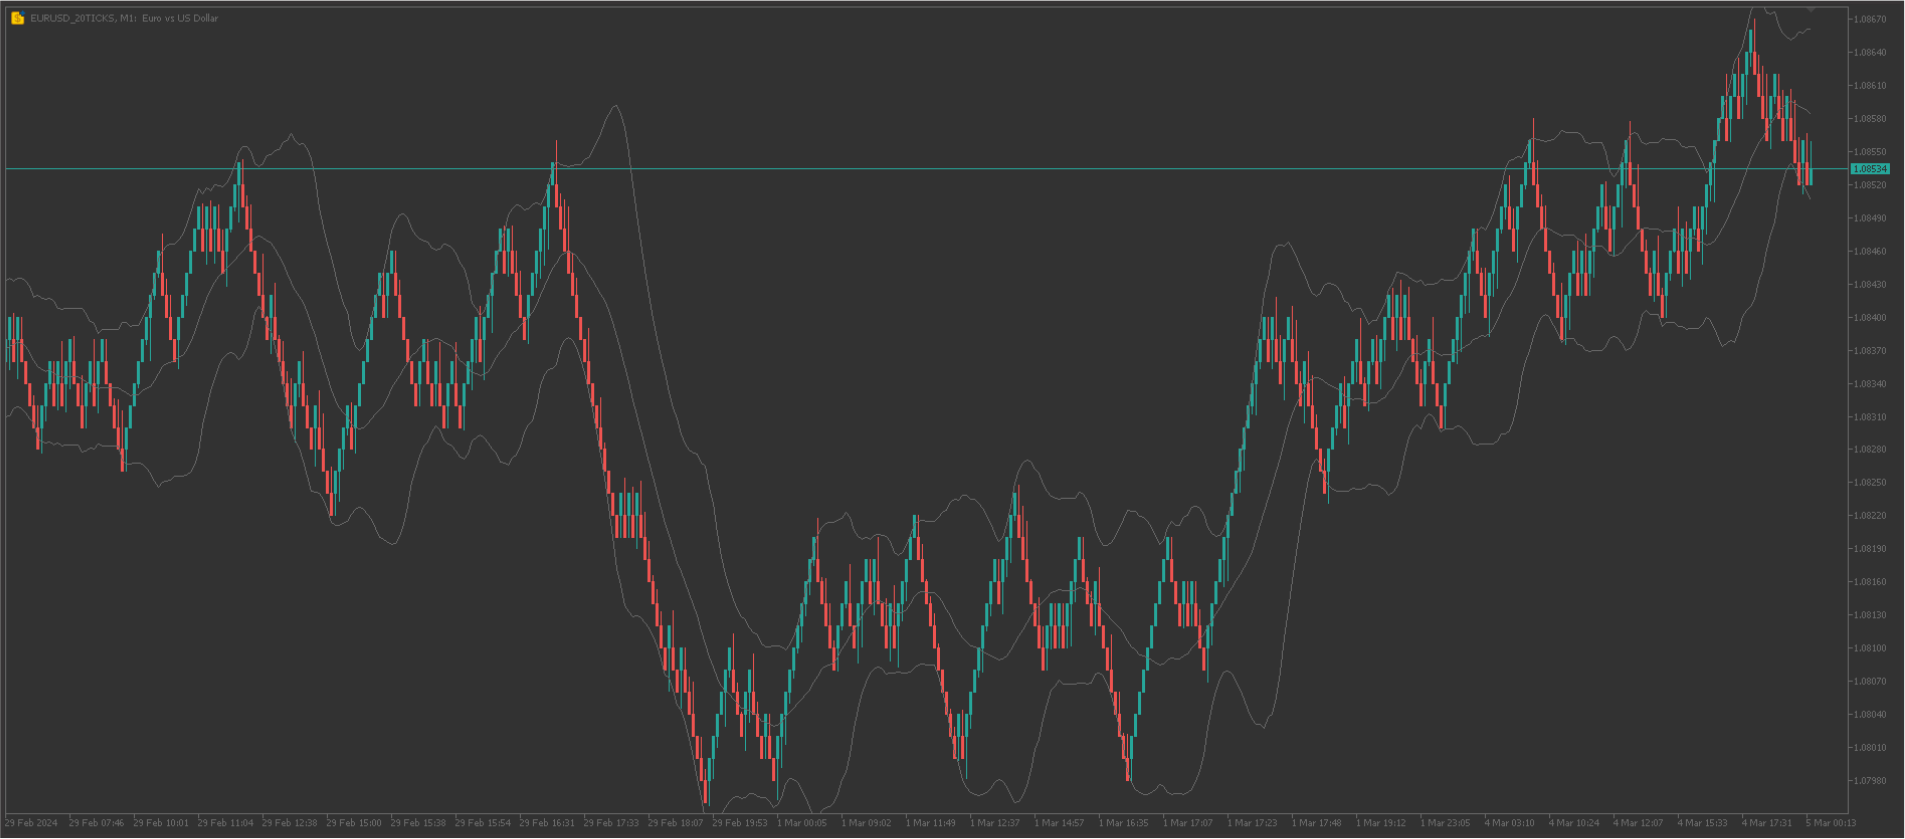


Whether your familiar with Renko charts or not this is a MUST have utility. Renko charts filter out the noise, clearly show support and resistance levels and make price patterns obvious. Unfortunately no developers allow the addition of indicators to Renko charts. This utility solves that issue. I’ve significantly increased my weekly ROI using this utility! Its only weakness is that neither quick trade buttons or trade levels appear on the chart. You need to use a conventional chart for that.