BoS CHoCH FVG Indicator
- インディケータ
- Usiola Oluwadamilol Olagundoye
- バージョン: 1.10
- アップデート済み: 25 4月 2024
FREE EA for GOLD, Rejection Block Trader can be found here: https://www.mql5.com/en/market/product/116472
The Expert Advisor for this Indicator can be found here: https://www.mql5.com/en/market/product/115476
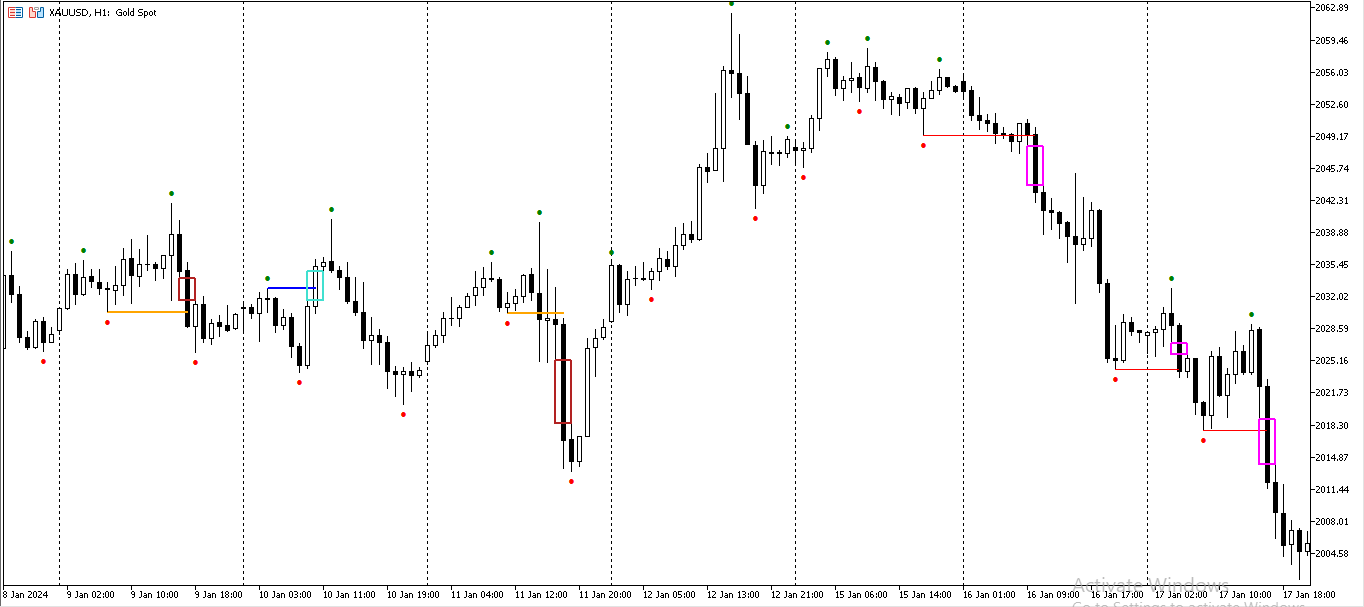
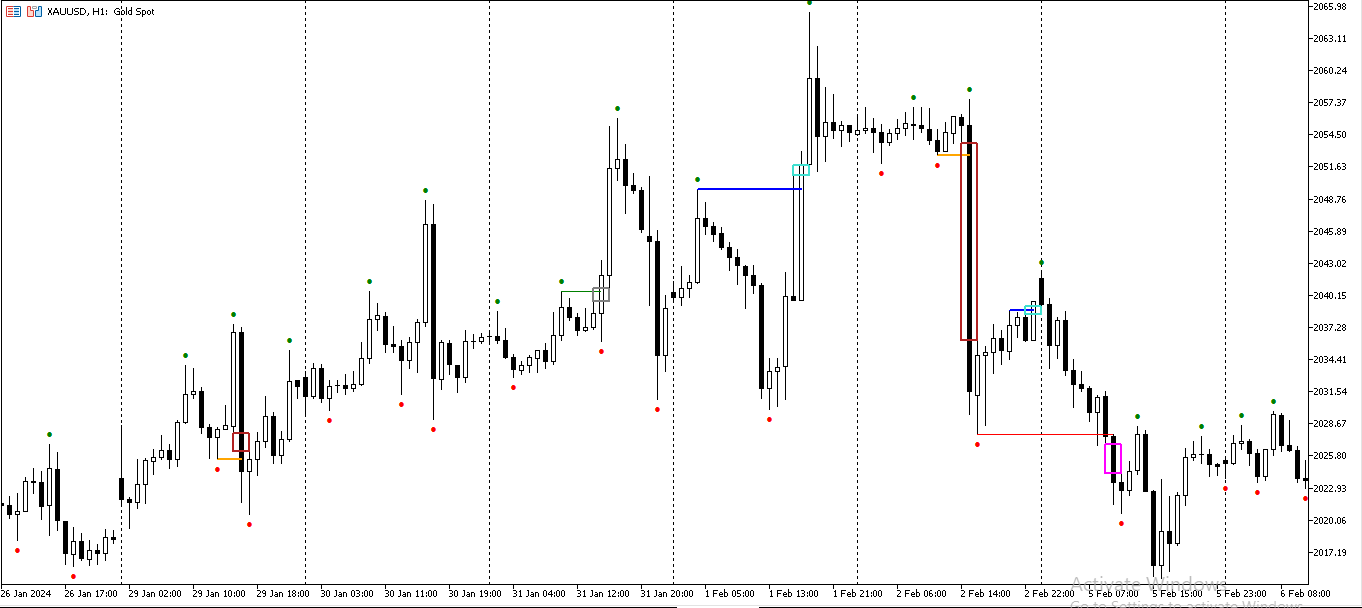
The Break of Structure (BoS) and Change of Character indicator with Fair Value Gap (FVG) filter is a specialized tool designed to enhance trading strategies by pinpointing high-probability trading opportunities on price charts. By integrating the BoS and Change of Character concepts with the FVG formation, this indicator provides traders with a robust filtering mechanism to identify optimal entry and exit points.
The indicator identifies instances where the structure of price movements is disrupted, indicating potential trend reversals or significant shifts in market sentiment. In addition to detecting BoS and Change of Character events, it specifically focuses on candlestick formations that also exhibit a Fair Value Gap (FVG). This combination acts as a powerful filter, selecting only those breakouts that occur within the context of a fair value gap.
By incorporating the FVG filter, the indicator helps traders identify high-probability trading setups with greater confidence. FVGs, characterized by price gaps that align with fair value levels, serve as strong indications of market inefficiencies and potential price corrections. Therefore, when a breakout coincides with the formation of an FVG, it suggests a more reliable signal with a higher likelihood of success.
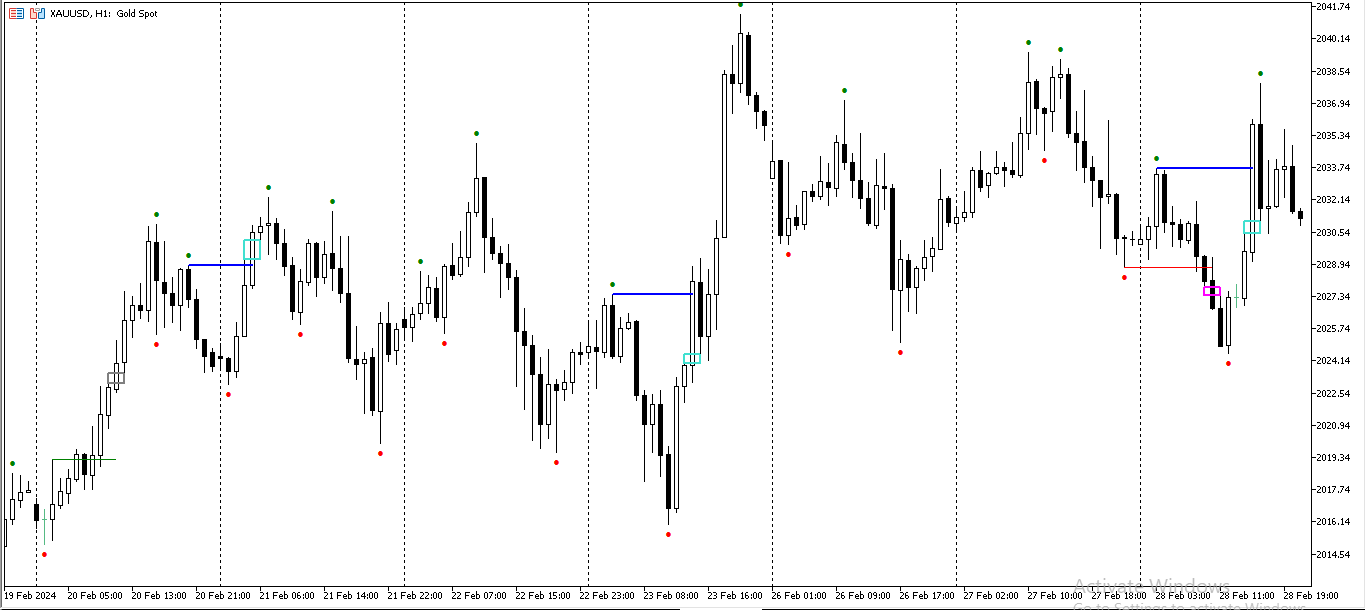
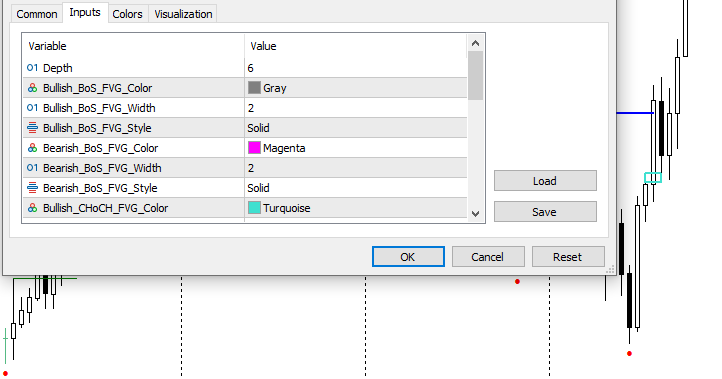
With customizable parameters and clear visual cues, the BoS and Change of Character indicator with FVG filter provides traders with a systematic approach to identifying and capitalizing on optimal trading opportunities. Whether used in isolation or in combination with other technical analysis tools, this indicator offers traders a valuable tool for improving trading decisions and enhancing overall profitability.


muy bueno, muchas gracias