TG Multi Timeframe Moving Average MT5
- インディケータ
- Daciana Elena Chirica
- バージョン: 1.0
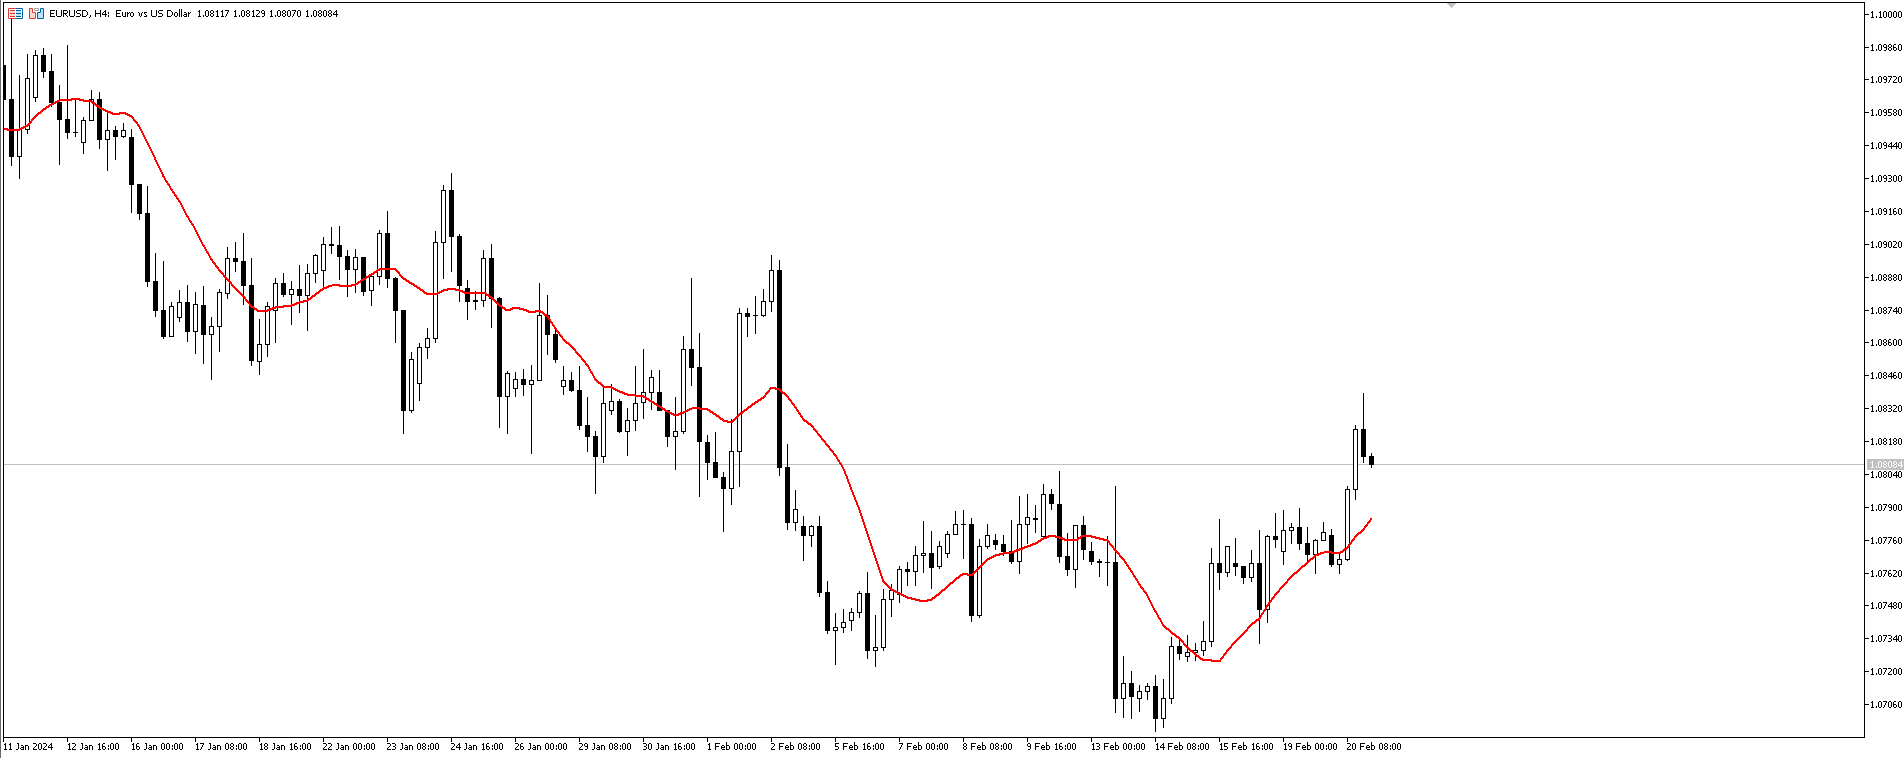
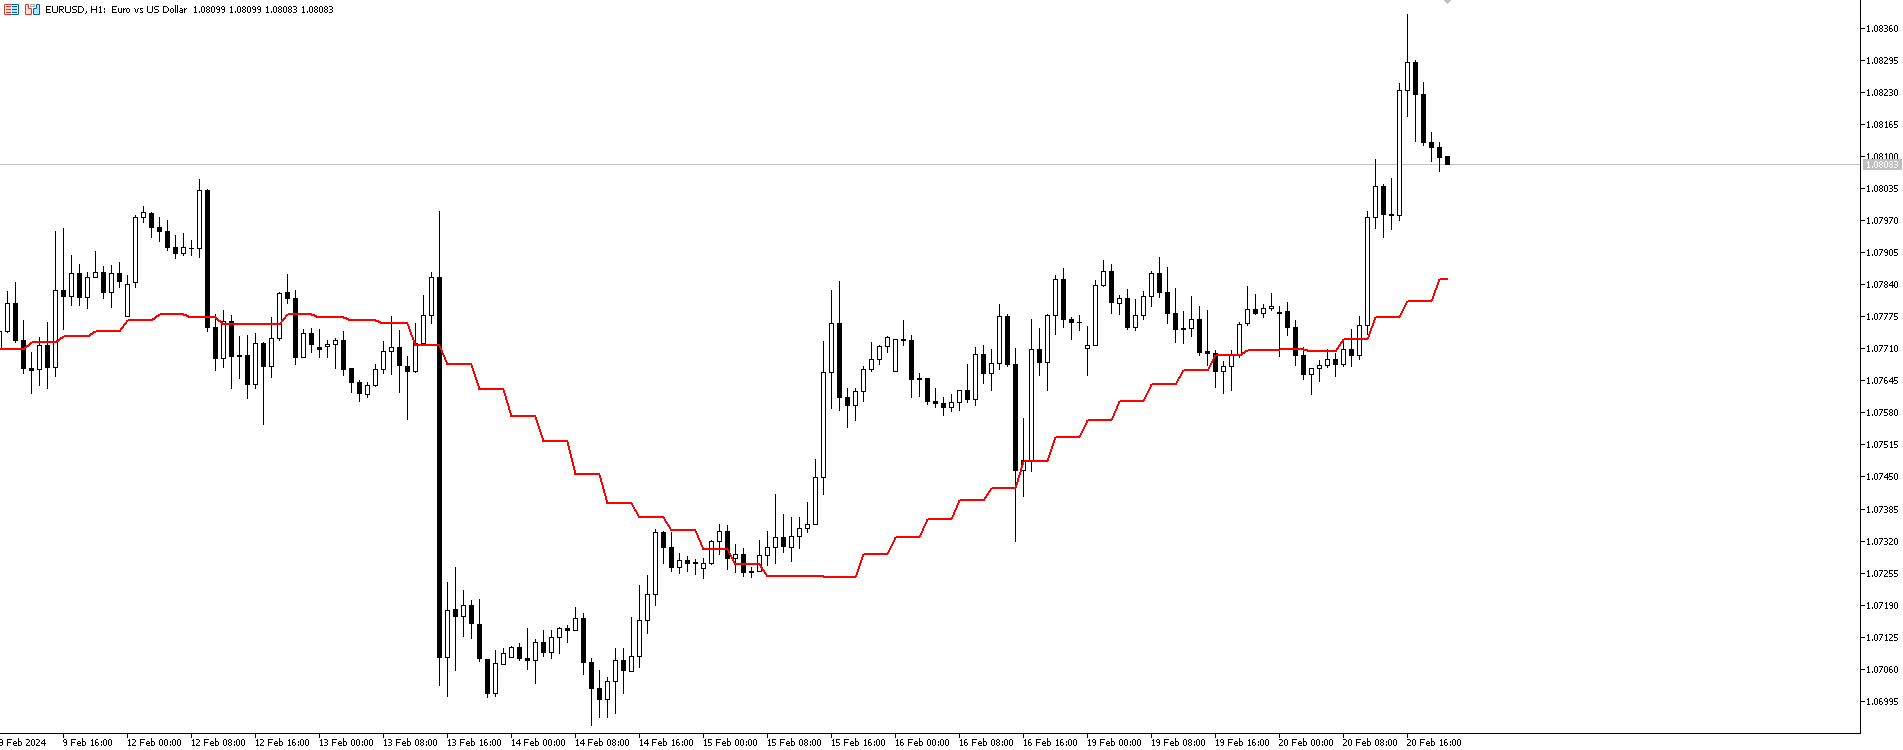
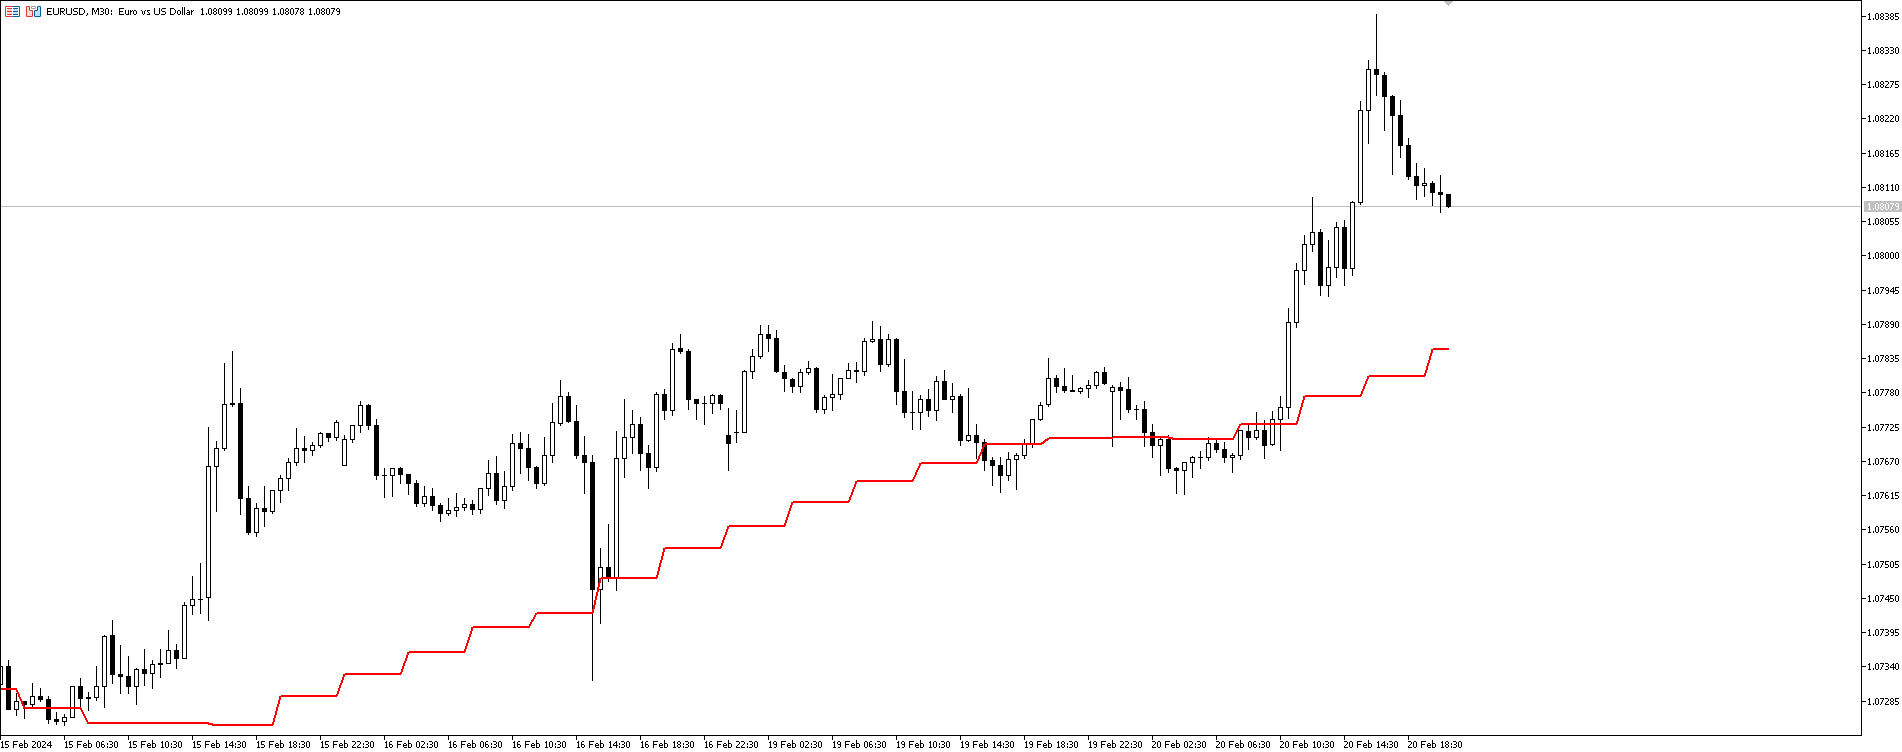
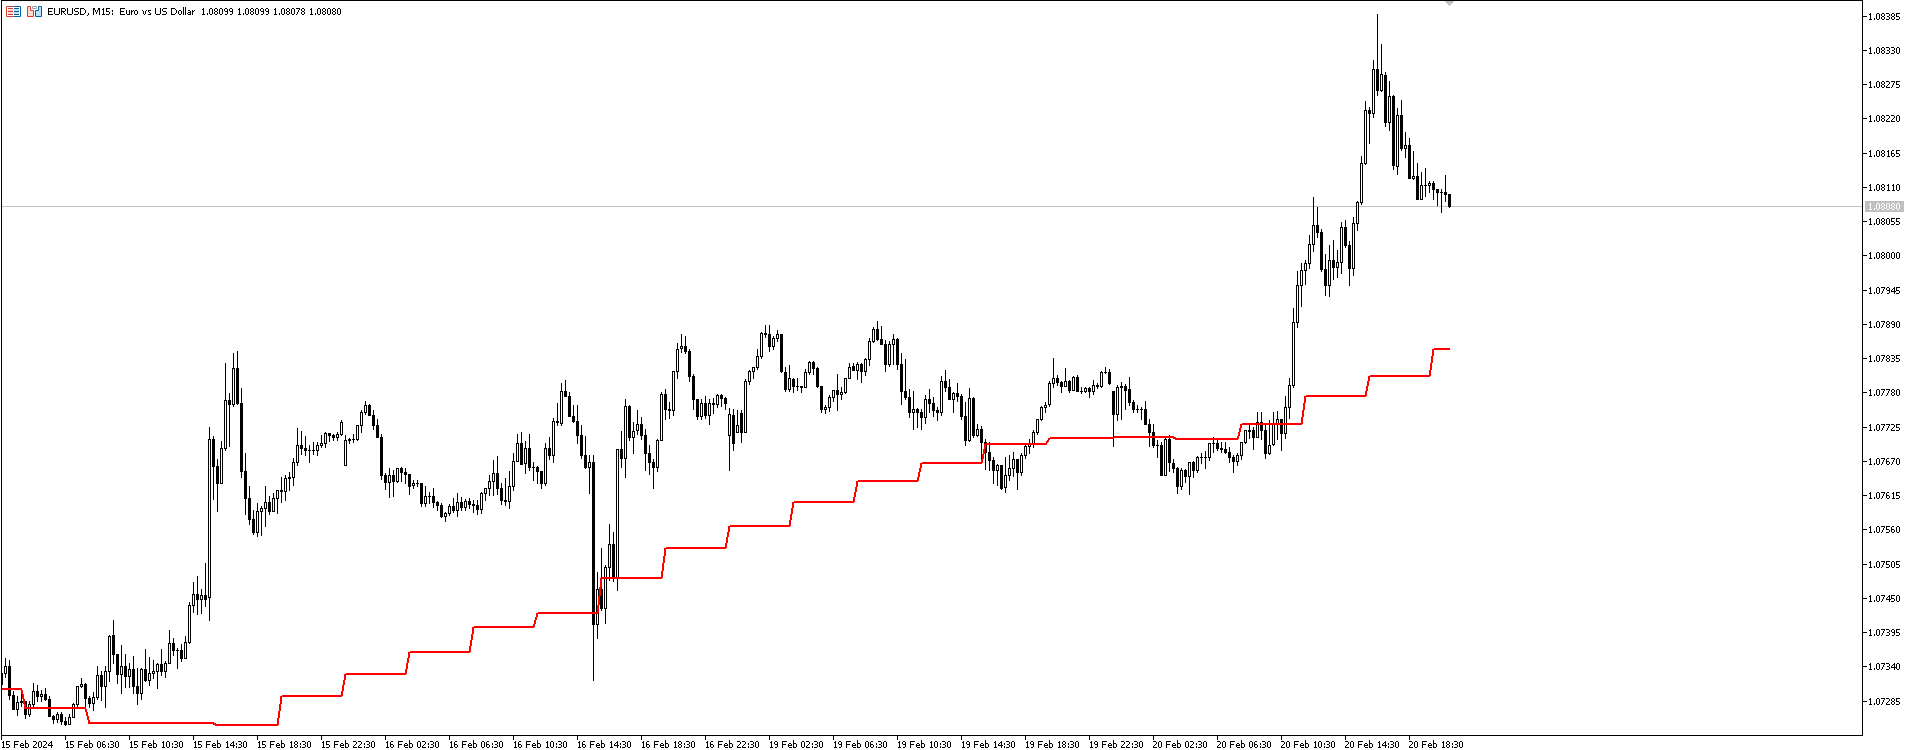
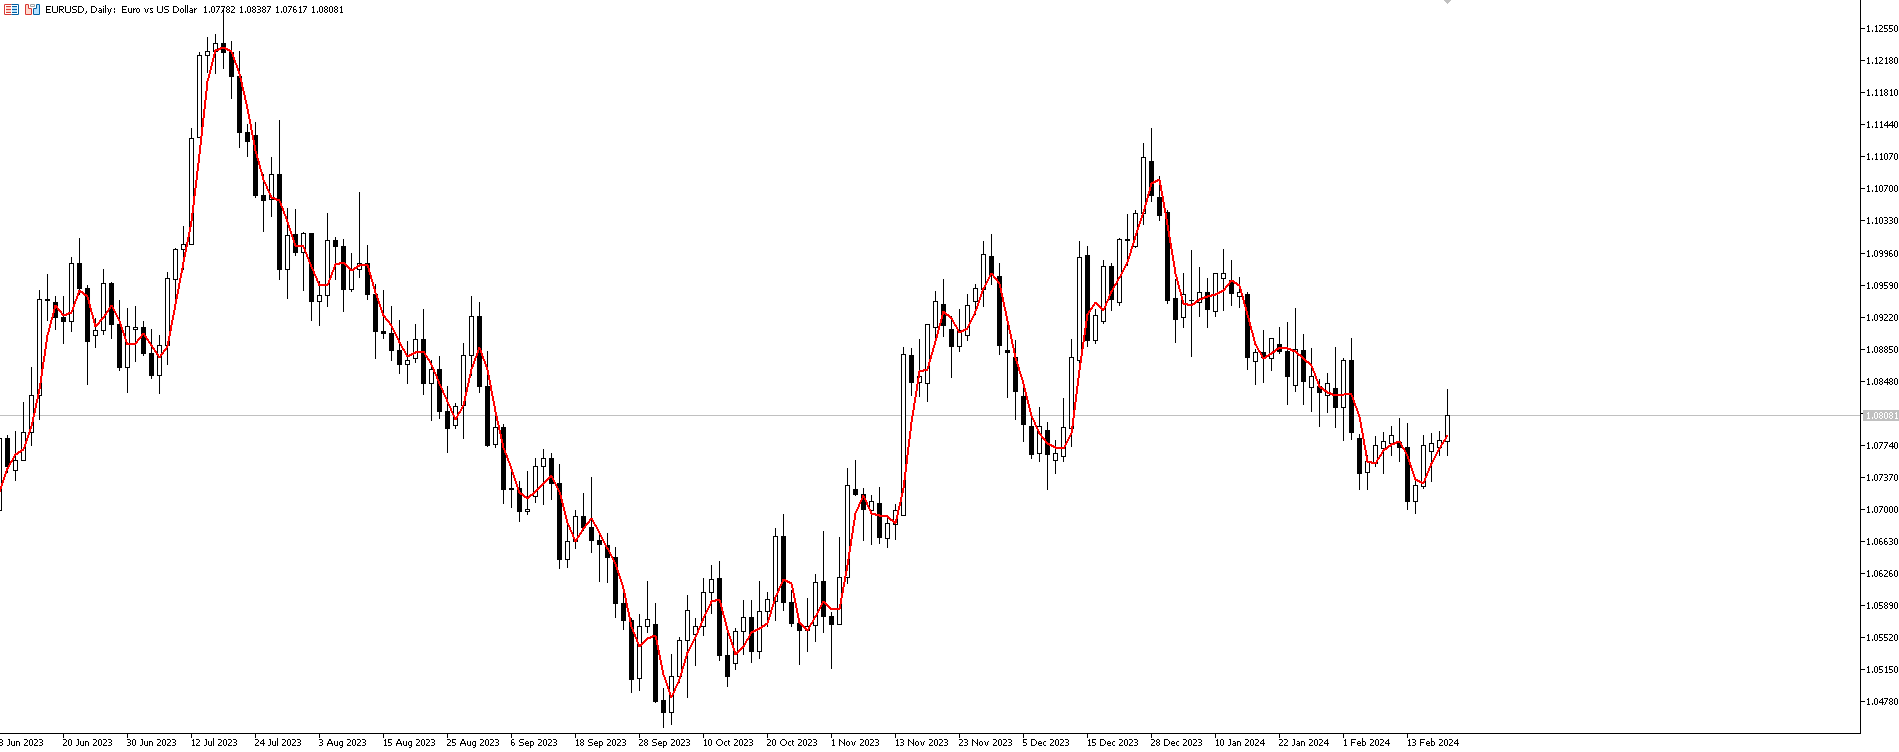
TG MTF MA MT5 is designed to display a multi-timeframe moving average (MA) on any chart timeframe while allowing users to specify and view the MA values from a particular timeframe across all timeframes. This functionality enables users to focus on the moving average of a specific timeframe without switching charts. By isolating the moving average values of a specific timeframe across all timeframes, users can gain insights into the trend dynamics and potential trading opportunities without switching between charts frequently. Features:
Features:
- The indicator calculates and displays a moving average based on user-defined parameters across multiple timeframes simultaneously.
- Multiple display modes INTERPOLATION or STEP
Parameters
- TimeFrame: An enumeration of timeframes that allows users to specify the timeframe for the moving average calculation. Traders can choose from different timeframes such as M1, M5, M15, H1, H4, D1, W1, and MN1.
- Period: An integer value representing the period for the moving average calculation. This parameter determines the number of bars used to calculate the moving average.
- Method: An enumeration of moving average methods that specifies the algorithm used to calculate the moving average. Traders can choose from methods such as Simple Moving Average (MODE_SMA), Exponential Moving Average (MODE_EMA), Smoothed Moving Average (MODE_SMMA), and Linear Weighted Moving Average (MODE_LWMA).
- AppliedPrice: An enumeration of applied prices that defines which price data is used in the moving average calculation. Traders can choose from applied prices such as Close price, Open price, High price, Low price, Median price, Typical price, and Weighted close price.
- DrawMode: An enumeration of drawing styles that determines how the indicator is visually represented on the chart. Traders can choose from different drawing modes such as steps or linear interpolation/slope
Developer Features
Developers can utilize the described indicator in the following manner:
By accessing the buffer with index 0, developers gain access to the main buffer values of the indicator. They can implement the indicator using the iCustom function in MQL5, as shown below:
int handle = iCustom(
                   NULL, //Symbol
                   PERIOD_H4, //Timeframe
                   "Personal/TF_MTF_MA",//FolderPath(Filename)

                   //Indicator input parameters
                   PERIOD_H4,//Timeframe
                   14,//Ma Period
                   MODE_SMA,//Ma Method
                   PRICE_CLOSE,//Ma Applied Price
                   1,//Drawing mode(Step,Interpolation)
                );

   double TG_MTF_MA_Buffer[];

   int copyCounter = CopyBuffer(
                        handle,
                        0, //Buffer Number
                        0,//StartPos (0 = CurrentCandle)
                        1,//Counter
                        TG_MTF_MA_Buffer //Buffer Array
                     );
#tags: ma mtf mtfma mtf_ma multi timeframe multitimeframe ma moving average