FST Super Volume Buy and Sell MT5
- インディケータ
- Benoit Dumont
- バージョン: 1.4
- アクティベーション: 20
Introducing our groundbreaking indicator designed to elevate your trading strategy!
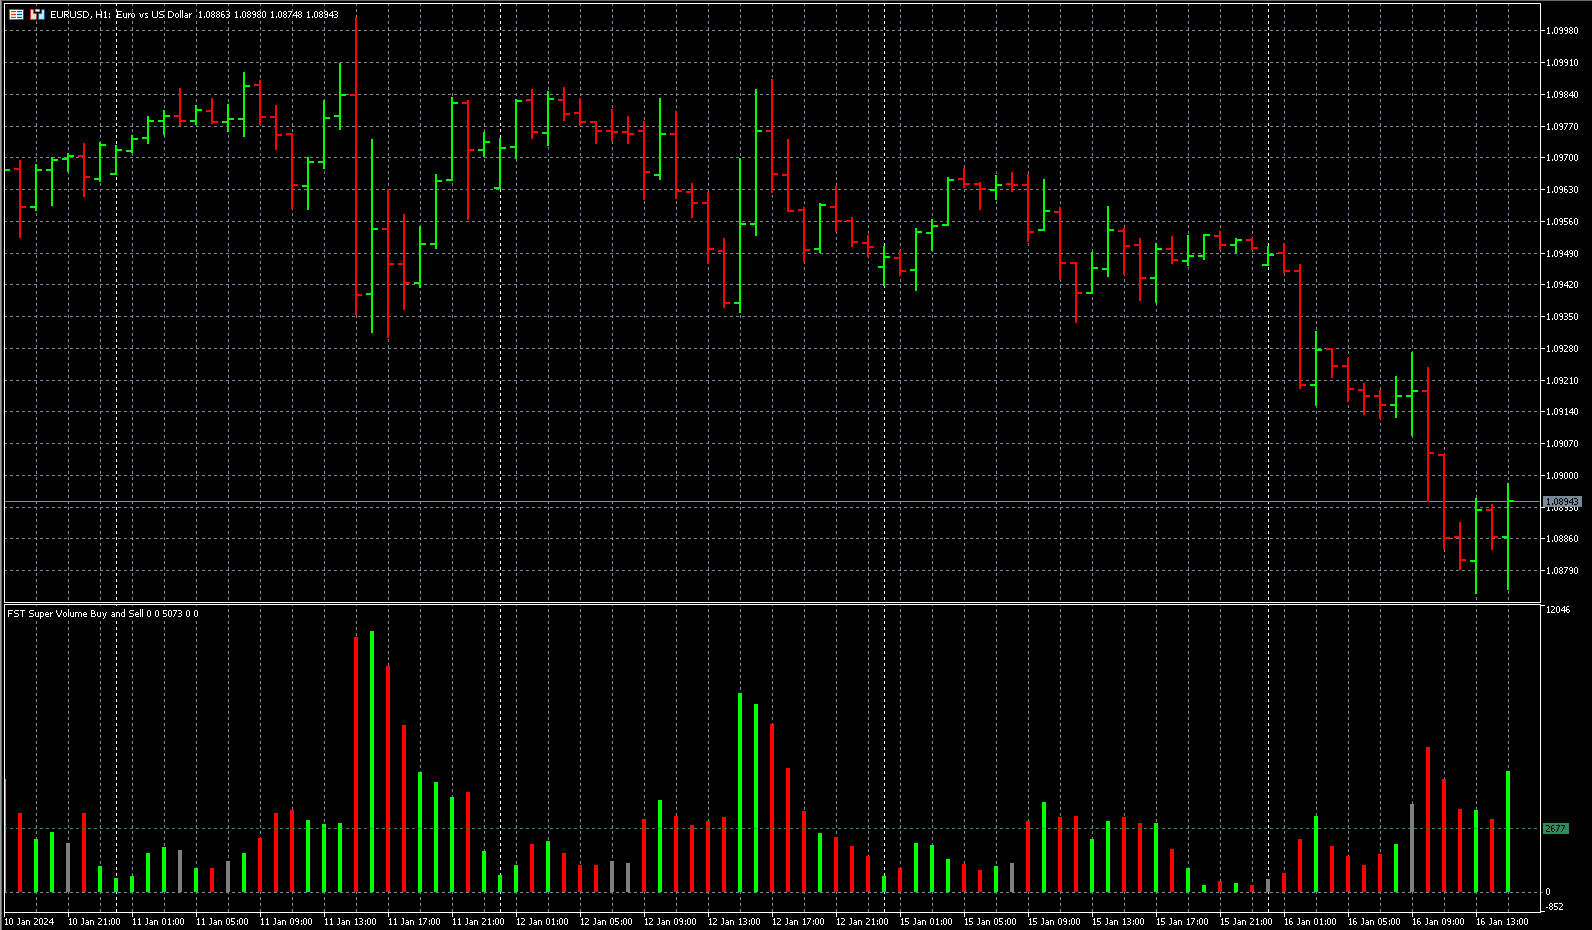
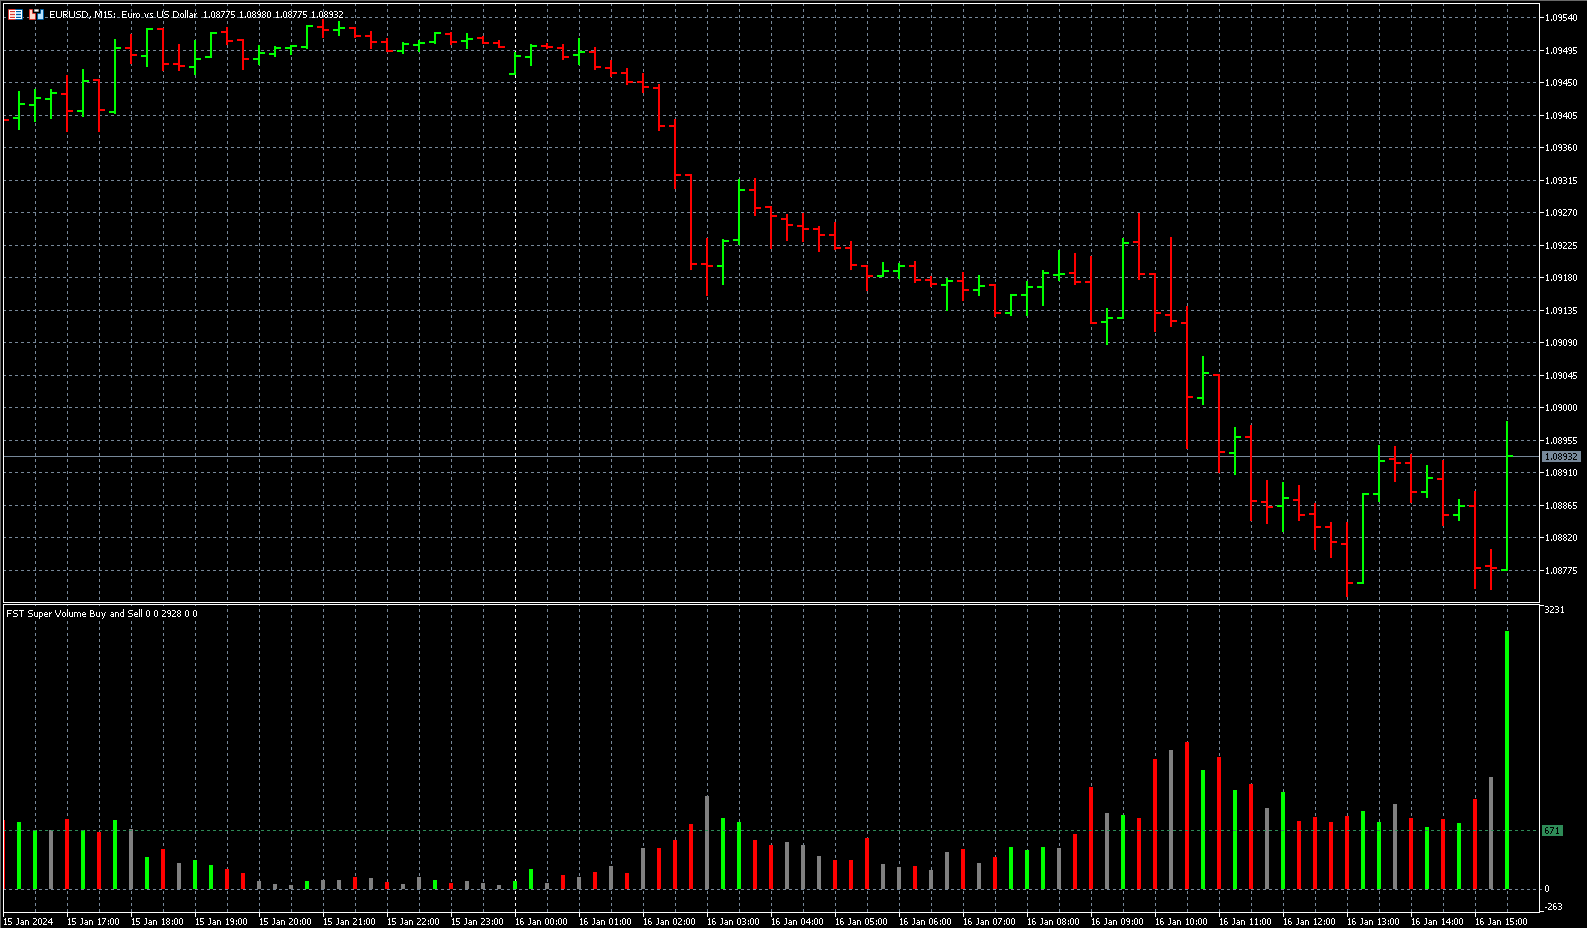
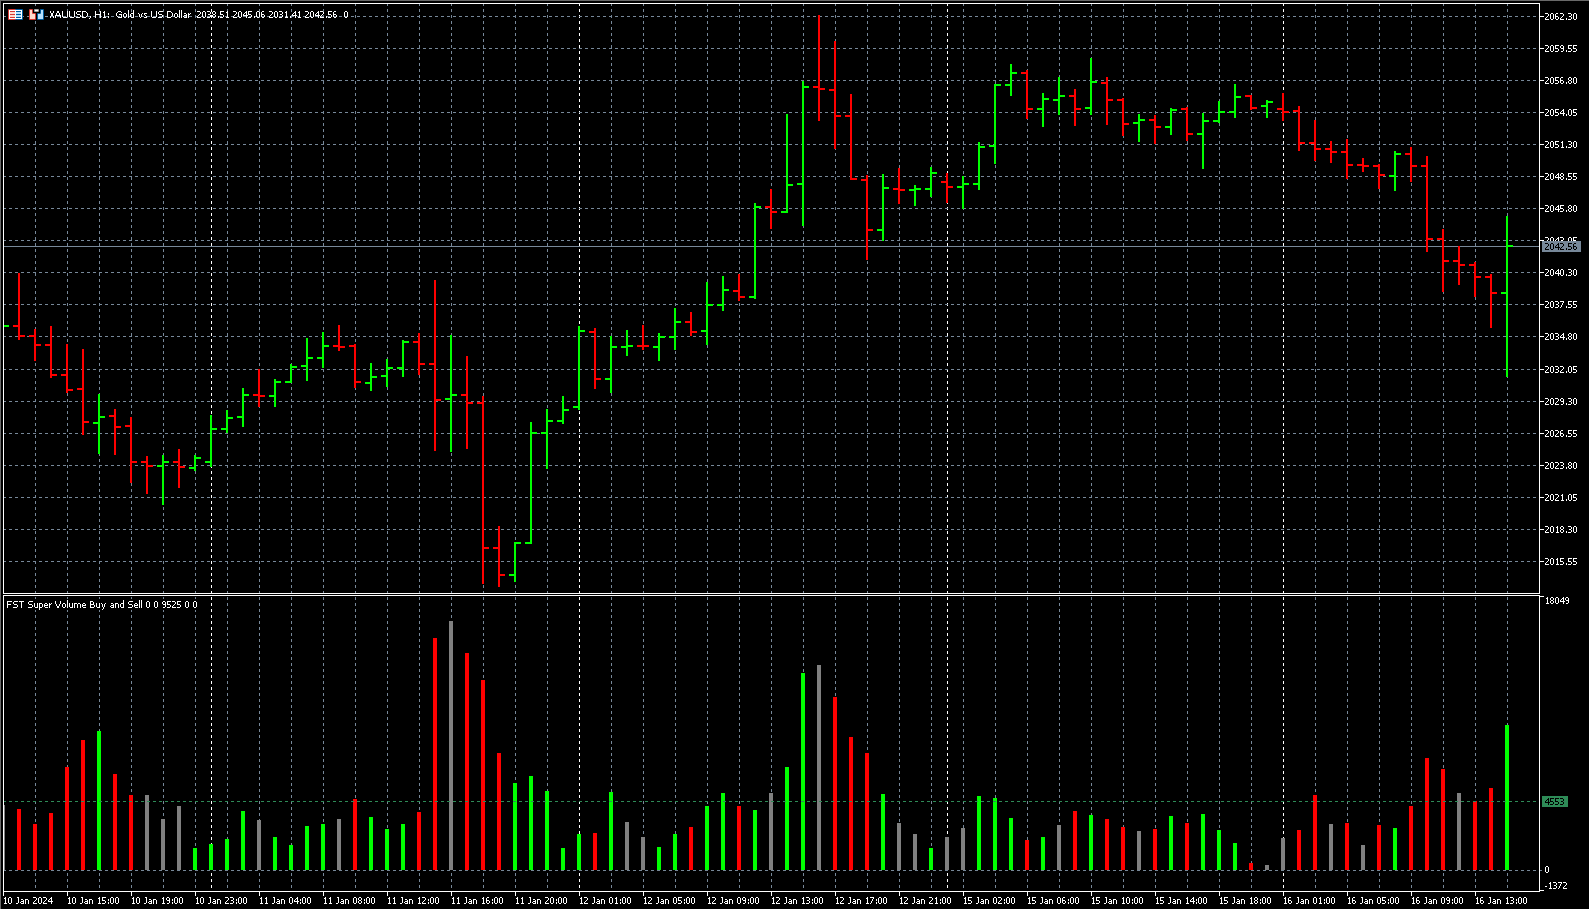
Unlock the power of precise volume analysis with Buy, Sell, and Neutral indicators.
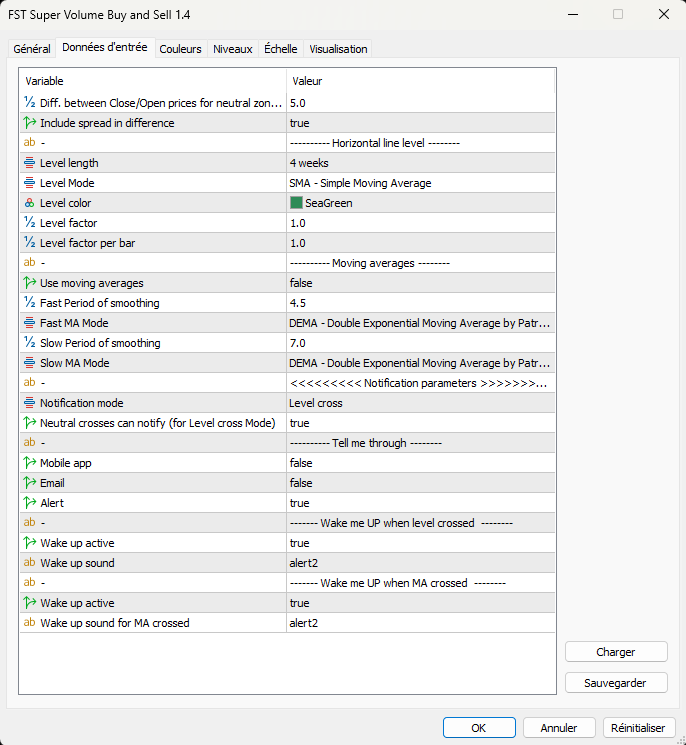
Tailor your approach with customizable levels based on timeframes and moving average methods.
Key Features:
- Dynamic Volume Insights
Instantly identify Buy, Sell, and Neutral volumes for informed trading decisions. Gain clarity on market sentiment like never before.
- Adaptable Level Configuration
Customize and adapt levels to match your preferred timeframe and moving average method. Tailor the indicator to align with your unique trading style.
- Dual Moving Averages
Explore the synergy of a fast and slow moving average, each with multiple method options. Uncover nuanced trends and trading opportunities with precision.
- Cross-Level Notifications
Stay ahead of market shifts with cross-level notifications. Receive alerts instantly, ensuring you never miss a critical trading moment.
- Sound Alerts for Immediate Action
Enhance your responsiveness with customizable sound alerts. Set distinct tones for different scenarios, ensuring you're alerted to potential opportunities or risks.
This advanced indicator empowers traders with a comprehensive toolkit for nuanced volume analysis.
Tailor your levels, explore dual moving averages, and stay informed with timely notifications and sound alerts.
Elevate your trading strategy to new heights with a tool designed for precision and adaptability.
MT4 version: https://www.mql5.com/en/market/product/110404
- "Would have sended an email outside the tester."