IRDeS 1 0
- インディケータ
- バージョン: 1.0
- アクティベーション: 5

**IRDeS(距離とスパイクの検出指標)**は、ほぼ完璧なタイミングで市場に参入するための力とゼロからの距離を示す指標です。
ゼロからの距離とボラティリティを検出する青色の連続線と、ゼロを上回る赤色のヒストグラムおよびゼロを下回る緑色のヒストグラムから構成され、特定のローソク足での取引の強度と力を測定し、チャート上の特定のポイントで強力な推進、つまり「スパイク」を生成します。
IRDeSは技術分析において貴重で革新的かつ多様なツールであり、市場参入後の動きのパワーの品質も測定できるため、現代の状況に適しています。
IRDeSの明白な利点にもかかわらず、他のどの指標と同様に、アナリストは慎重に行動し、特定のチャート領域に焦点を当て、他の領域を避ける必要があります。
特にトレーダーはこの指標を過買いまたは過売りの条件を見つける手段として使用しようとするかもしれませんが、これが常に機能するわけではありません。 IRDeSは任意の値を取る可能性があるため、「過剰のしきい値」を正確に特定することは不可能です。当社の指示に従えば、時間と十分な経験を積めば、ほぼ誰でもチャートデータを分析し、IRDeSを効果的に使用できるようになるでしょう。
注目すべき点:
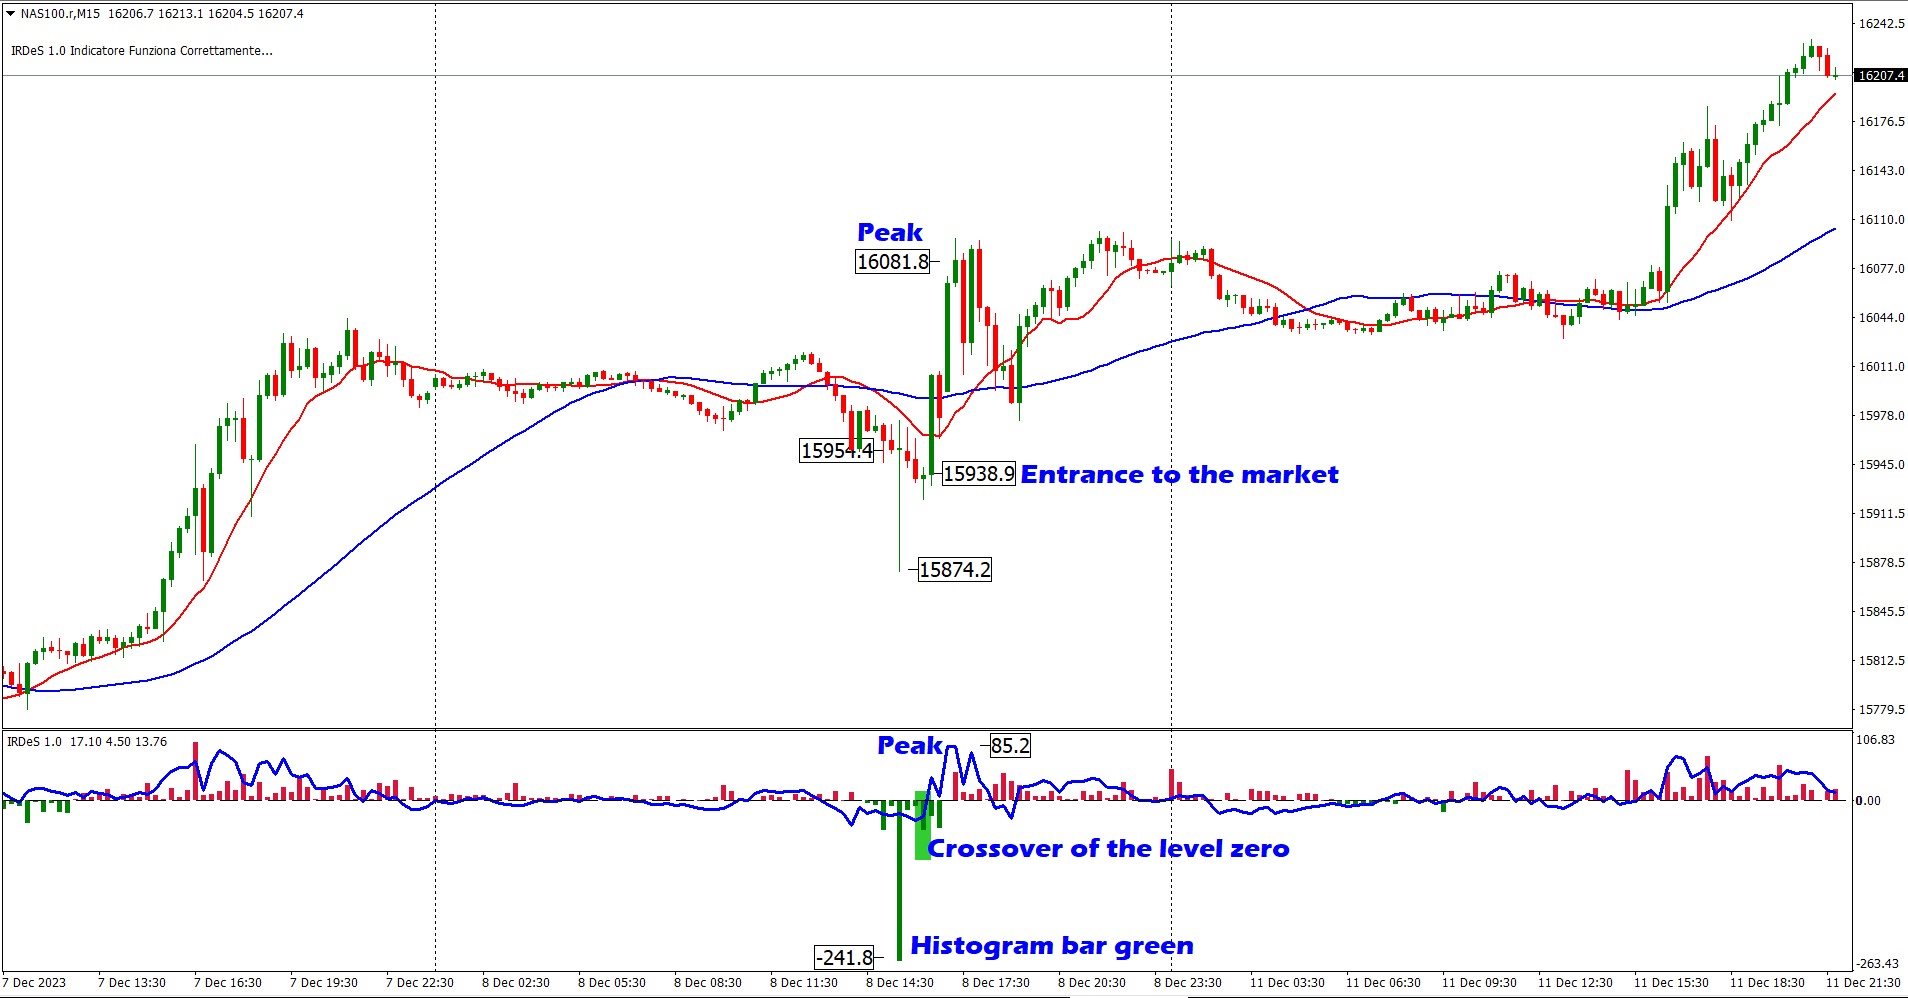
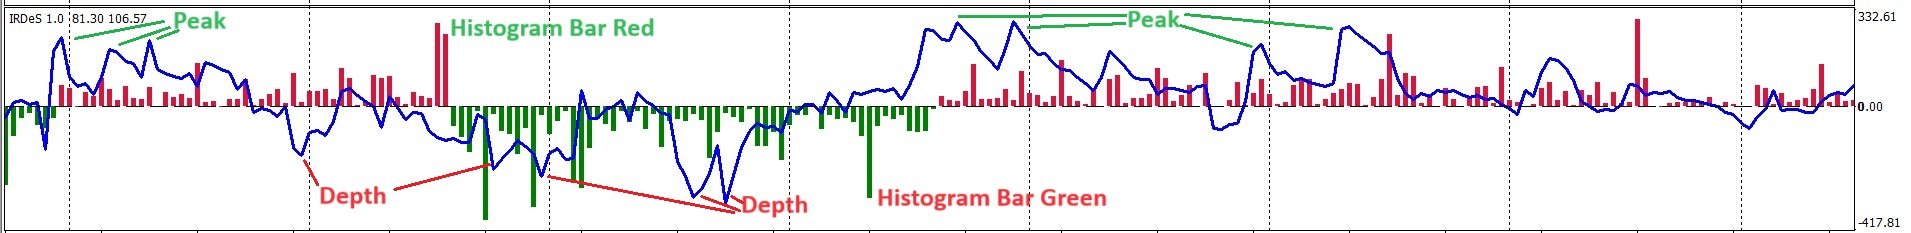
- ピーク(ゼロを上回る連続線);
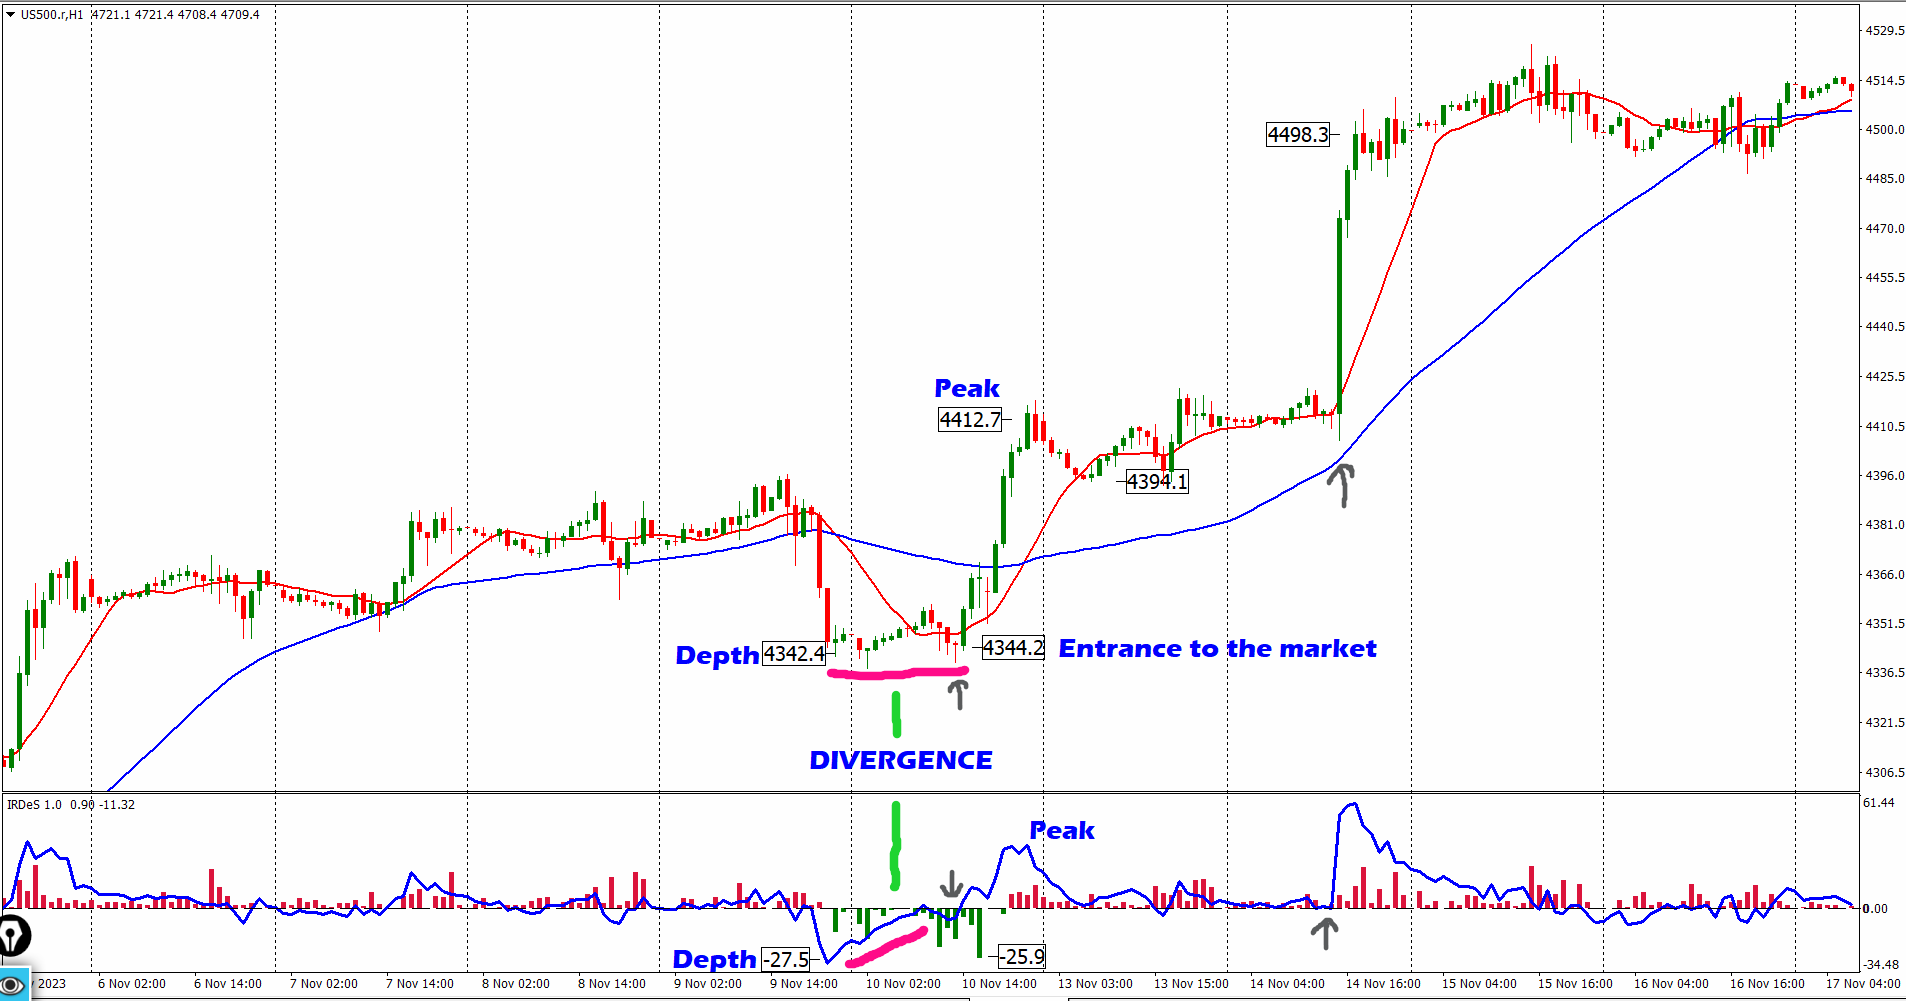
- デプス(ゼロを下回る連続線);
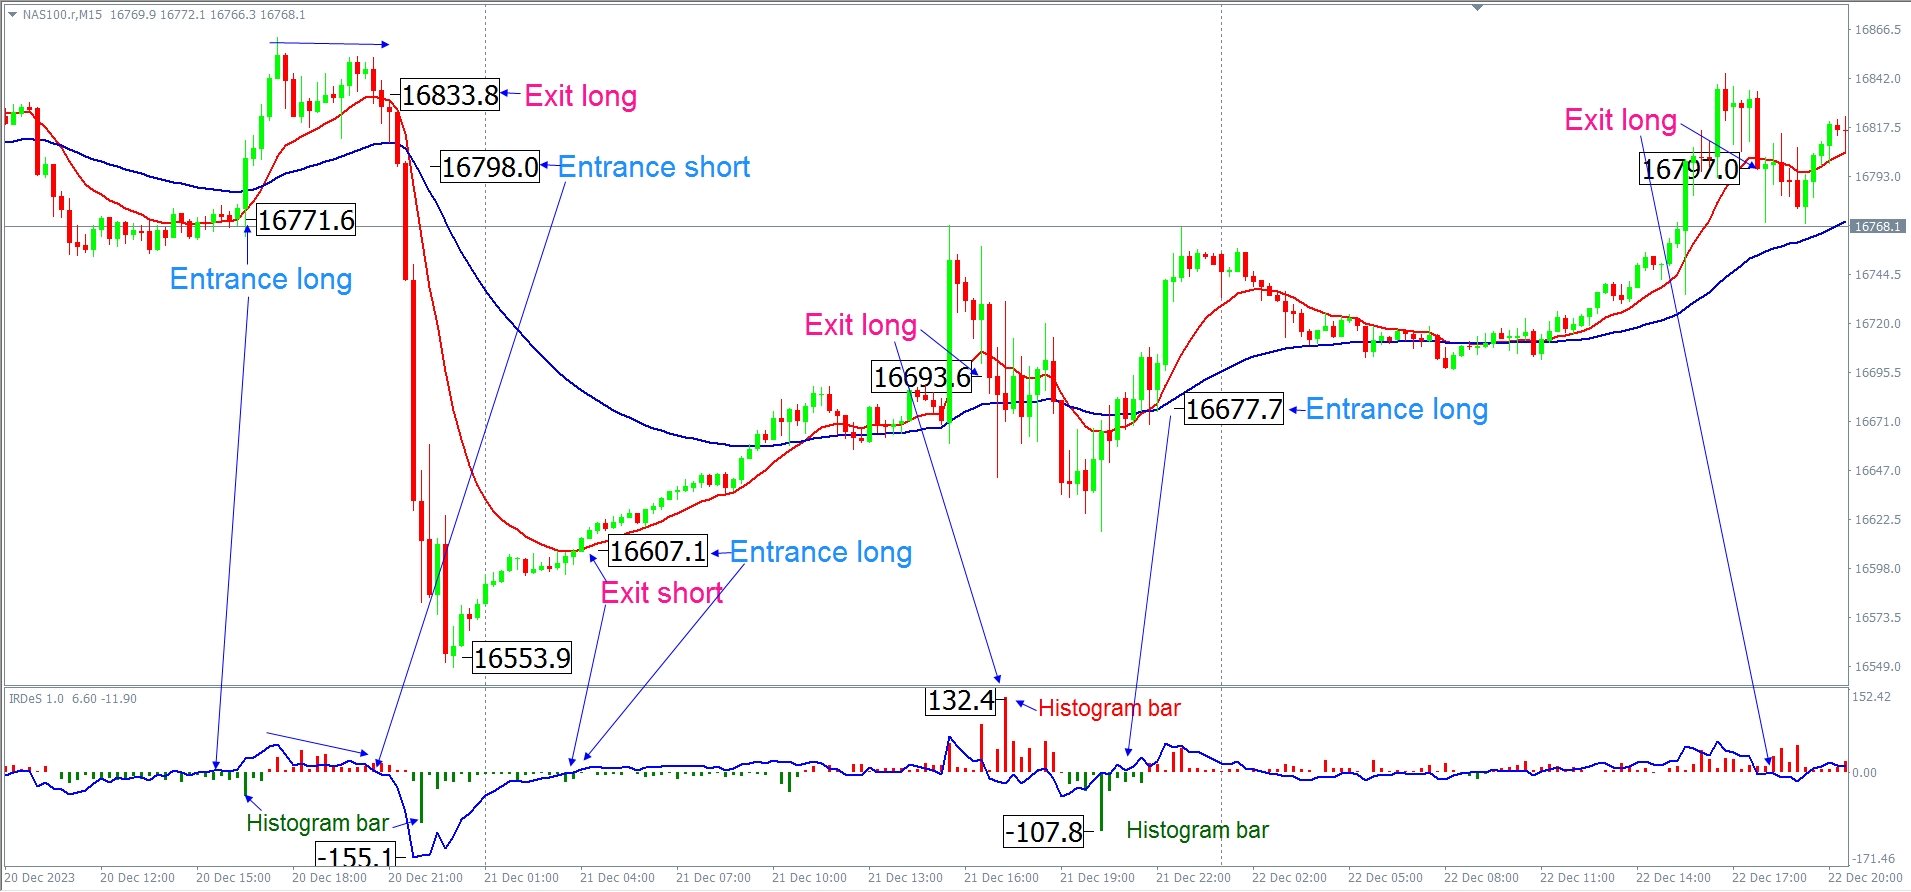
- 赤または緑のヒストグラムバーが顕著に高い;
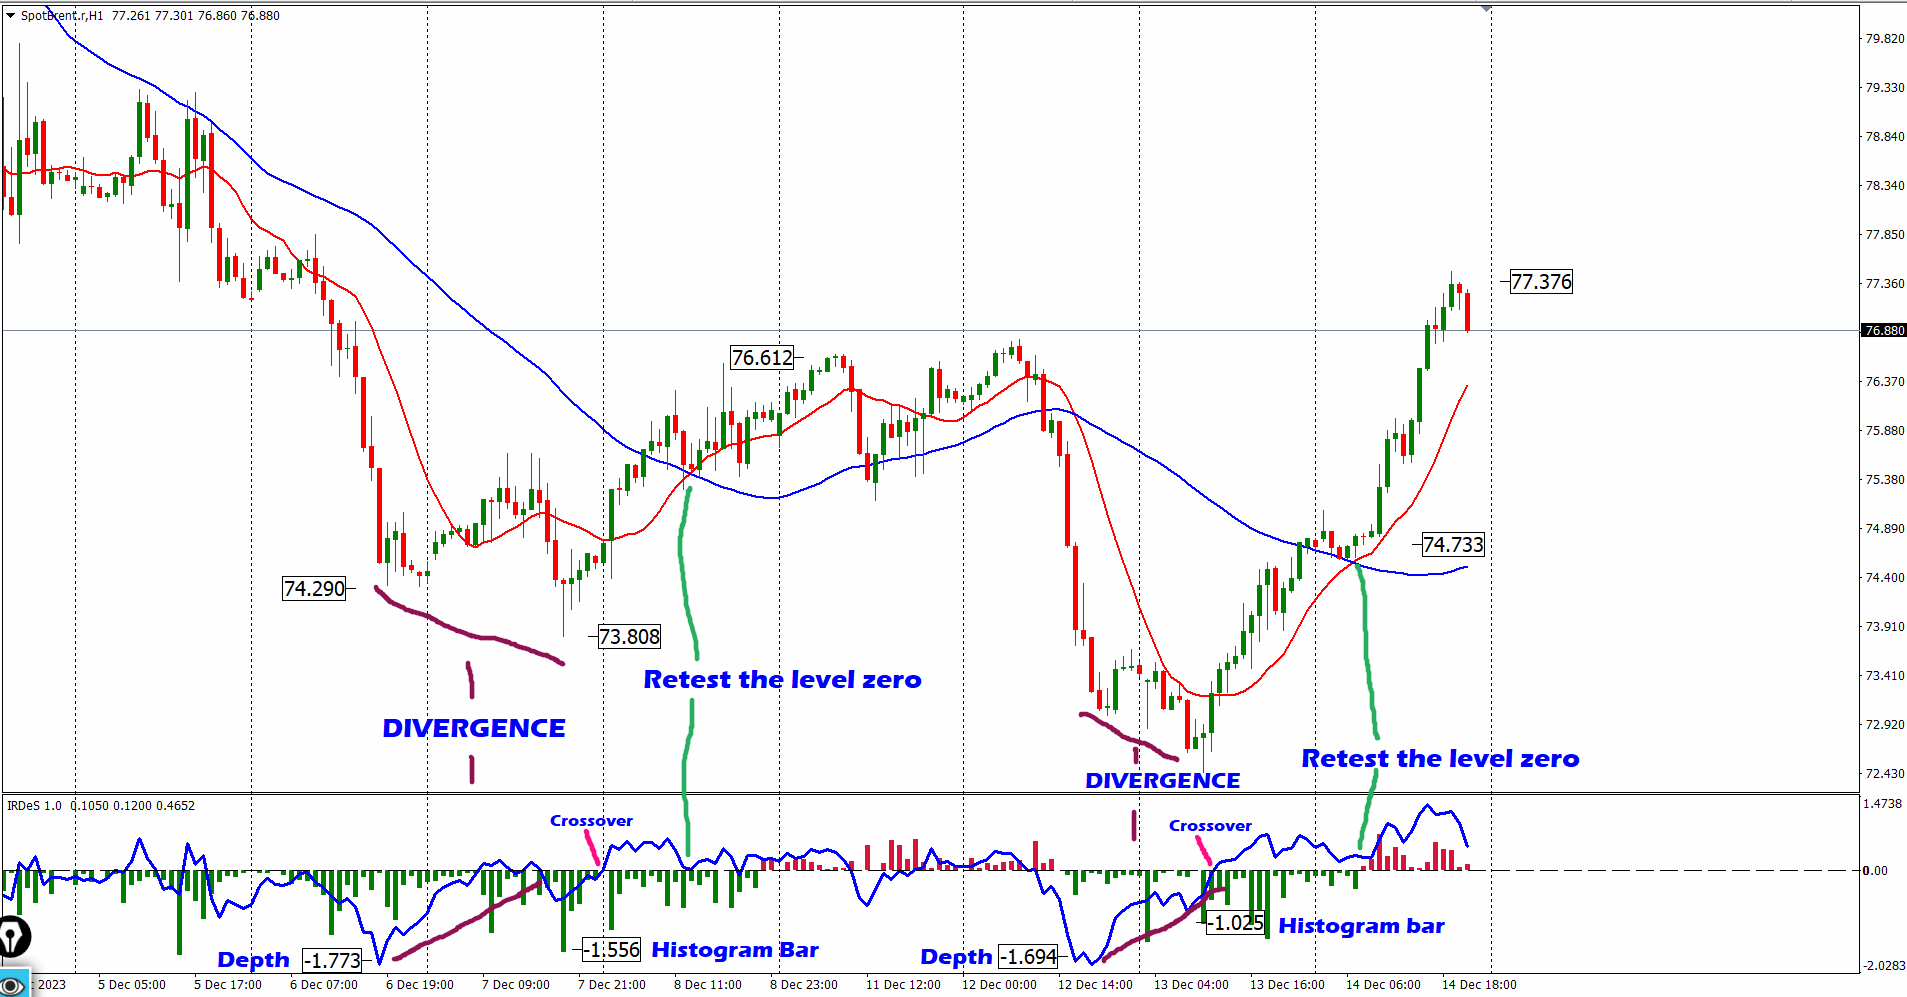
- ゼロのクロスオーバー;
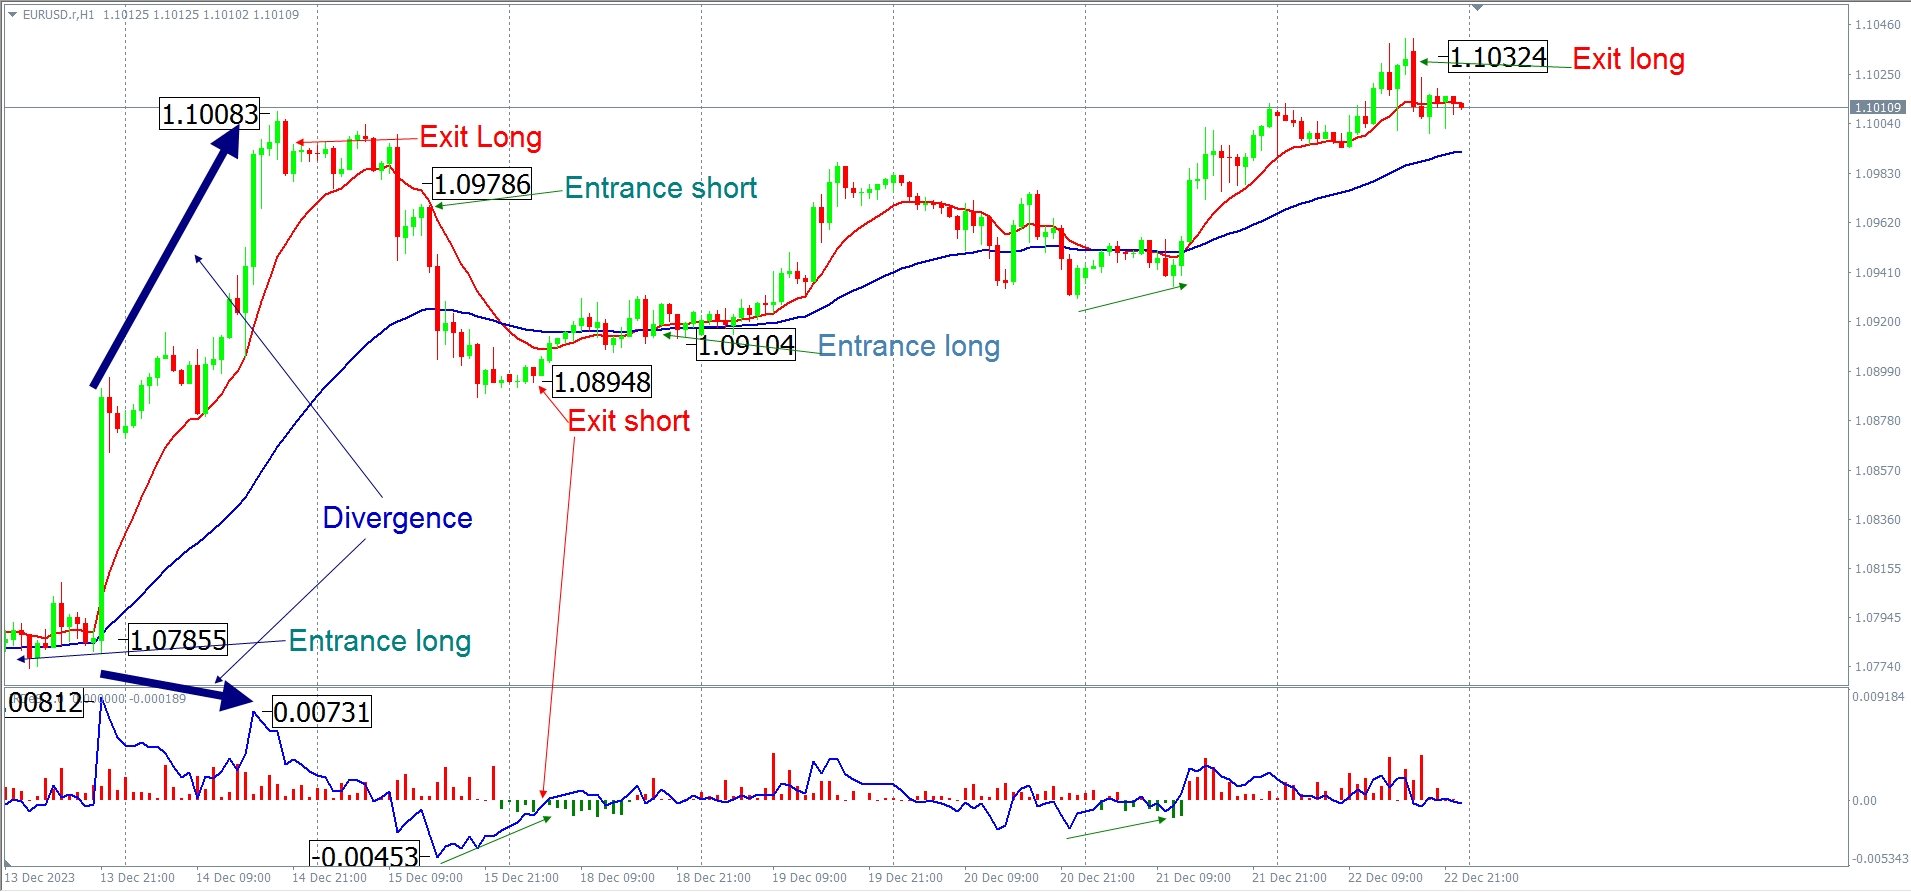
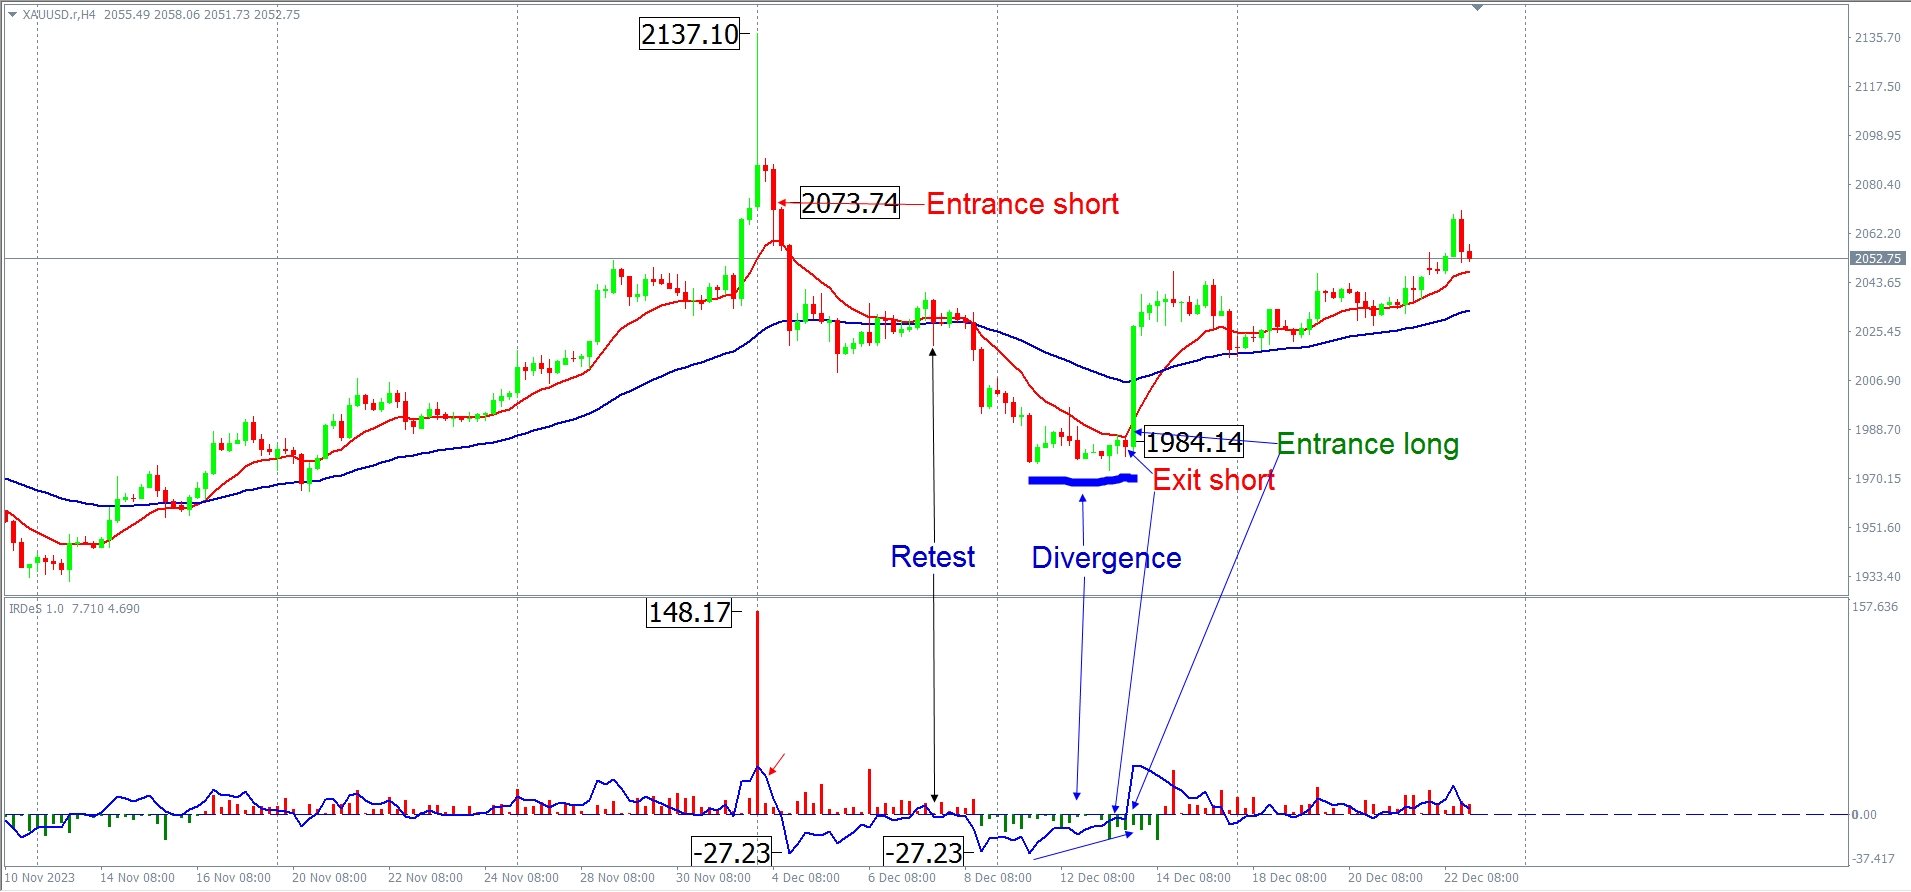
- ダイバージェンス。
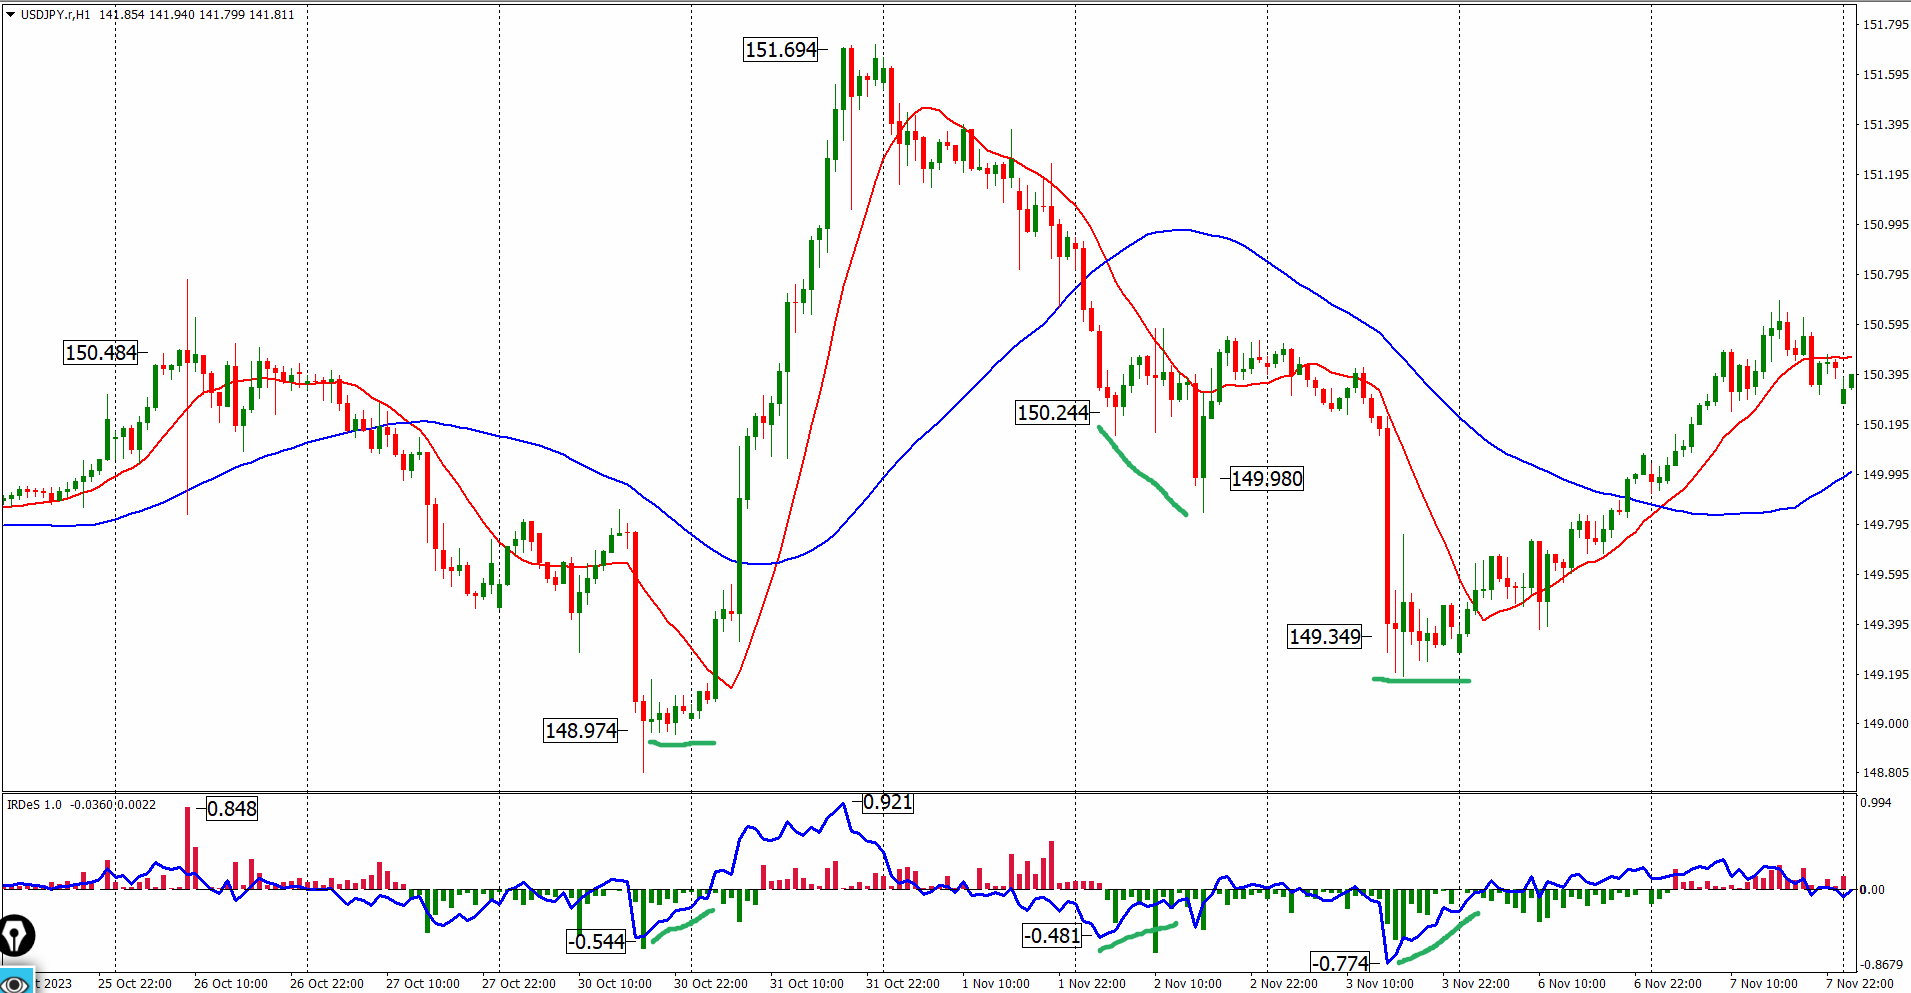
ピーク: ピークは、ゼロを上回るIRDeSの青い線によって表され、尖った山の形状を取る場合があります。ピークは正の値で測定され、最大値は過買いレベルと誤解される可能性があります。ピークがこの目的に適したチャート領域にない場合、これは大きな誤りです。
上昇トレンドがほぼ尽きるまで、リトレースメントのサインとして非常に効果的です。ピークは、顕著に高い赤いヒストグラムバーと組み合わせると、非常に有効なサインとなります。
上昇トレンドがほぼ尽きた場合、唯一かつ例外的に、最大ピークは常に顕著に高い赤いヒストグラムバーと一緒に現れる場合に限り、過買いエリアの指標となり得ます。
デプス: デプスは、IRDeSのゼロを下回る青い線によって表され、潜水を続ける場合があります。デプスは負の値で測定され、最大の負の値は過売りレベルと誤解される可能性があります。デプスがこの目的に適したチャート領域にない場合、これは大きな誤りです。
下降トレンドがほぼ尽きるまで、リトレースメントのサインとして非常に効果的です。デプスは、顕著に深い緑のヒストグラムバーと組み合わせると、この目的に非常に有効なサインとなります。
下降トレンドがほぼ尽きた場合、唯一かつ例外的に、デプスは常に顕著に深い緑のヒストグラムバーと一緒に現れる場合に限り、過売りエリアの指標となり得ます。
赤または緑のヒストグラムバーが顕著に高い: ヒストグラムバーが顕著に高い(赤い)または深い(緑の)場合、注意が必要な警告サインです。前述のように、赤いバーはゼロを上回り、緑はゼロを下回り、特定のローソク足での取引の強度と力を測定し、チャート上の特定のポイントで強力な推進を生成します。
顕著に高い赤いバーはピークと組み合わせると、売りの市場参入を評価する非常に有効なサインです。顕著に深い緑のバーはデプスと組み合わせると、買いの市場参入を評価する非