Smart Currency Strength MT5
- インディケータ
- Francesco Baldi
- バージョン: 1.2
- アップデート済み: 19 7月 2023
- アクティベーション: 10
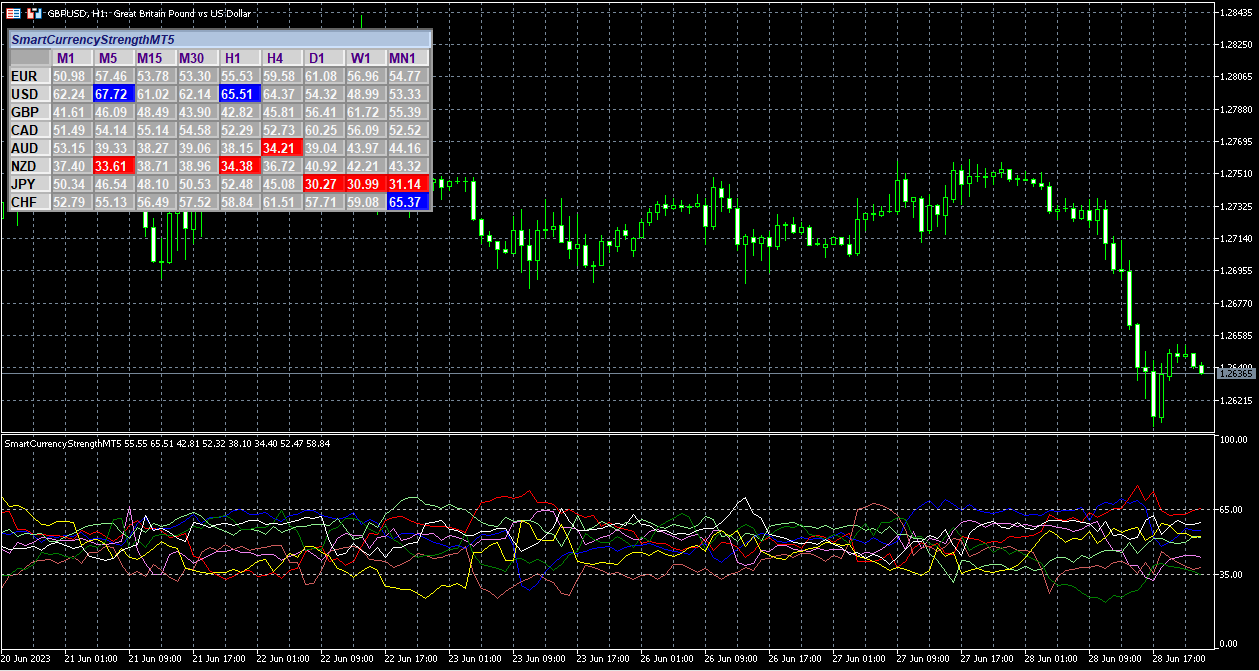
Smart Currency Strength is a powerful yet simple indicator that measures the strength of individual currencies.
It features a graphic panel that lists the main currencies and their strength in each timeframe, ranging from 0 (most oversold) to 100 (most overbought).
The strength for all currencies in the current timeframe is also shown in a separate window as a multi-line graph, where each currency is represented with a different color, this allows you to monitor the evolution of strength trend through time.
This can be used to identify the most trending currency pair to trade (formed by the most overbought and the most oversold currencies), or as a filter for your strategy, in order to avoid buying a weak currency or selling a strong one.
This indicator can be used in an expert advisor as it features a buffer for each supported currency.
Supported currencies are: EUR, USD, GBP, CAD, AUD, NZD, JPY, CHF
MT4 version is here
Configuration parameters:
Indicator to use: choice of indicator to use for strength calculation, RSI, MFI or Stochastic
Max Number of Bars to Process: since the indicator works on 28 pairs simultaneously, setting this parameter can improve the performance, the default value should be good for all purposes, 0 disables this setting and processes all available barsRSI Indicator parameters: if you chose RSI you can set its parameters in this section
MFI Indicator parameters: if you chose MFI you can set its parameters in this section
Stochastic Oscillator Indicator parameters: if you chose Stochastic Oscillator you can set its parameters in this section
Show Panel: display the multi-timeframe panel
Overbought level: currencies above this level of strength are considered overbought and are highlighted in blue color in the panel, a line at this level is also drawn in the indicator window
Oversold level: currencies below this level of strength are considered oversold and are highlighted in red color in the panel, a line at this level is also drawn in the indicator window
Default values (65, 35) are optimized for RSI indicator, for MFI it would be advisable to set 70, 30 e for Stochastic 85, 15
Bars Shift: Timeframe bar shift for the values displayed in the panel (default 0 is current bar)
Symbol Prefix and Symbol Suffix: if you are backtesting this indicator and your broker has prefixes or suffixes in the currency pair names (i.e. EURUSD#, EURUSD.m, etc.) you should specify them here
Should you need help with configuration or functionalities feel free to contact me.