YouTubeにあるマーケットチュートリアルビデオをご覧ください
ロボットや指標を購入する
仮想ホスティングで
EAを実行
EAを実行
ロボットや指標を購入前にテストする
マーケットで収入を得る
販売のためにプロダクトをプレゼンテーションする方法
MetaTrader 5のための新しいエキスパートアドバイザーとインディケータ - 154

CyberTrend is a fully automatic Expert Advisor based on advanced algorithms for short term trend prediction. This EA uses several custom made indicators combined with candles prediction that helps to achieve a very high-rate of winning trades. This EA successfully passed long term back-test with real tick data, variable spread, real commision and swap from Metatrader 5 Strategy Tester. CyberTrend is also fully adjustable by user. Please read the blog to get more information about FAQ and setti
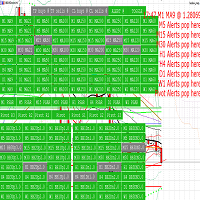
Provides automated (HFT) trading, manual trading, and alerts, with a manager panel.
Utilises bollinger bands, moving averages, Parabolic SAR, pivots and pending orders with range breakout. Allows linking takeprofit, stoploss, Sound & push-notifications, buy & sell triggers, to customizable indicators; 8 moving averages, 3 Bollinger bands, PSAR, and daily pivots.
A grasp of the configurability:
Active market hours requirement for all majors.
set timer intervals per timeframe trade tri

Советник Forex Ilan Barbudos -это аналог советника торгующий на одном графика в разные стороны одновременно(для этого требуется соответственный счёт который это позволяет), с добавлением множества дополнительных логик и возможностей для торговли, с оставленными настройками советника . Советник торгует по системе Мартингейл с увеличением последующих лотов в серии ордеров, с целью их усреднения. Первые ордера робот выставляет по двум свечам. Так же советник имеет возможность прекращать торговлю в

Forex Abrams Основа работы EA, это увеличение лота и их усреднение, но основное отличие, это пропорциональная торговля. Благодаря этому параметры советника не будут переоптимизированны. Советник торгует одновременно в обе стороны, без индикатора. Самая важная информация о работе выводится на график. Самое главное, это правильно оптимизировать советник. Покупки и продажи оптимизируются отдельно, для этого следует выключить LONG TRADES OPEN или SHORT TRADES OPEN. Далее следует выключить Step Pro
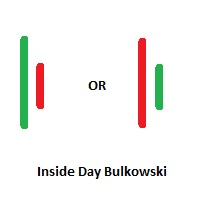
Inside Days Candlestick Bulkowski The Inside days candlestick is a well-known candle pattern composed of two candles. This indicator for showing outside days candlestick that describe by Thomas Bulkowski.
If you need for MetaTrader 4 version, please visit here: https://www.mql5.com/en/market/product/34725
Feature Highlights Show inside days candlestick. Customizable "Symbol". Customizable symbol distance from candlestick.
Input Parameters Symbol - Input symbol code from "wingdings" for ins

Fx Karakurt Работа робота, это увеличение лота и их усреднение, основное отличие, это пропорциональная торговля. Благодаря этому параметры советника не будут переоптимизированны. Советник торгует одновременно в обе стороны, без индикатора. Самая важная информация о работе выводится на график. Главное правило- это правильно оптимизировать советник. Покупки и продажи оптимизируются отдельно, для этого следует выключить LONG TRADES OPEN или SHORT TRADES OPEN. Начинать оптимизировать советник

The DYJBands opens and closes positions using Bollinger Bands signals: It performs trades after a price rebound from the borderlines of the indicator. It has the option to close positions by an opposite signal, by take profit and stop loss, move a trade to breakeven upon reaching the central Bollinger band or after a certain price movement. By default, the EA is configured for trading the GBPUSD currency pair on the H1 timeframe. Also, settings for the EURUSD, USDJPY, USDCAD and XAUUSD currency

The indicator My Big Bars can show bars (candles) of a higher timeframe. If you open an H1 (1 hour) chart, the indicator puts underneath a chart of H3, H4, H6 and so on. The following higher timeframes can be applied: M3, M5, M10, M15, M30, H1, H3, H4, H6, H8, H12, D1, W1 and MN. The indicator chooses only those higher timeframes which are multiple of the current timeframe. If you open an M2 chart (2 minutes), the higher timeframes exclude M3, M5 and M15. There are 2 handy buttons in the lower r
FREE

The indicator High Trend Pro monitors a big number of symbols in up to 4 timeframes simultaneously and calculates the strength of their signals. The indicator notifies you when a signal is the same in different timeframes. The indicator can do this from just one chart. Therefore, High Trend Pro is a multicurrency and multitimeframe indicator. High Trend Pro uses emproved versions of popular and highly demanded indicators for calculating its signals. High Trend Pro calculates the signal strength
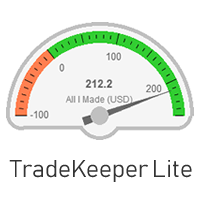
The utility TradeKeeper Lite can show your profits for different periods and bip a sound when you reach a profit target value. Click the tachometer to quickly switch to the next profit period. There are 5 of them: This Day, This Week, This Month, Last 90 Days and All I Made. With the utility TradeKeeper Pro , available at this link , you can also open trades with a magic number and volume of your choice, trail any orders with a simple trail or iSAR-based trail, as well as close any open trades a
FREE

RoboSar is a professional robot based on the Parabolic SAR indicator. The Expert Advisor is designed for the analysis of trending markets. On the "bull market" the indicator is below the prices, on the "bearish market" it is above the price. If the price crosses the Parabolic SAR lines, the indicator reverses, and its further values are located on the other side of the price. In case of such an indicator reversal, the reference point is the previous period's high or low. The reversal of the in
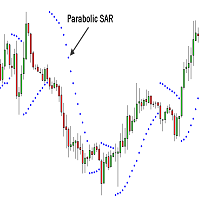
Professional Constrictors Expert Advisor follows the market using the Parabolic Stop and Reverse system indicator. At each Parabolic SAR indicator signal, a position is opened in the direction approaching the indicator. In case of an opposite signal, a new position closing the previous one is opened (in other words, positions are opened and closed partially). Thus, the EA constantly follows the price. The EA has been designed for working in the flat market. It features a critical drawdown,
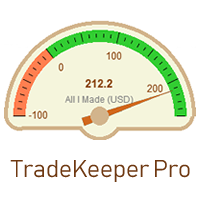
The utility TradeKeeper Pro allows you to open a trade manually with a magic and a volume of your choice. It does not open its own trades, it can only open a trade by your command.
TradeKeeper Pro can trail any open trades by the iSAR (parabolic) indicator, and a simple trail. It can set the stoploss level at the open price as soon as possible. To trail any open trades for any instruments, it suffices to launch the utility in one chart. TradeKeeper Pro can close any trades or pending orders of

If you want to share your trading signal, but you do not want to distribute your investor password, this product is fit with you. "Just copier Pro" is designed to copy trading without any complicated settings. The copy can be done in one PC or over the internet. One EA can be set as master (provider) or slave (receiver). The receiver lot can be set to multiple providers lots. In "Globe" mode, the signal provider (master) have to give the password to signal receiver, (the password that is set in

KT Auto Fibo draws Fibonacci retracement levels based on the ongoing trend direction. The Highs and Lows are automatically selected using the Maximum and Minimum points available on the chart. You can zoom in/out and scroll to adjust the Fibonacci levels accordingly.
Modes
Auto: It draws the Fibonacci levels automatically based on the chart area. Manual: It draws the Fibonacci levels only one time. After that, you can change the anchor points manually.
Usage: Helps to predict the future p

Outside Days Candlestick Bulkowski The Outside days candlestick is a well-known candle pattern composed of two candles. This indicator for showing outside days candlestick that describe by Thomas Bulkowski.
If you need for MetaTrader 4 version, please visit here: https://www.mql5.com/en/market/product/34411
Feature Highlights Show outside days candlestick. Customizable "Symbol". Customizable symbol distance from candlestick.
Input Parameters Symbol - Input symbol code from "wingdings" for

KT Pin Bar identifies the pin bar formation which is a type of price action pattern which depicts a sign of reversal or rejection of the trend. When combined with support and resistance, BRN and other significant levels, Pin Bar pattern proved to be a very strong sign of reversal.
Basically, a pin bar is characterized by a small body relative to the bar length which is closed either in upper or lower 50% part of its length. They have very large wicks and small candle body.
A pin bar candlest

KT Psar Arrows plots the arrows on chart using the standard Parabolic SAR indicator. A bullish arrow is plotted when the candle's high touch the SAR. A bearish arrow is plotted when the candle's low touch the SAR. The signals are generated in the real-time without waiting for the bar close.
Features
A beneficial tool for traders who want to experiment with the trading strategies that include the use of Parabolic Sar indicator. Can be used to find turning points in the market. Use custom PSA

SHOCK DEAL! --> BUY GOLD Scalper PRO with -$130 OFF and GET a BONUS PREMIUM EA! NOTE: (Regular Price: $397) - The offer ends soon! Click here to read more about Trend Matrix EA and the SHOCK DEAL promotion! GOLD Scalper PRO signal account: https://www.mql5.com/en/signals/2109002 For Settings, Instructions and additional LIVE Results Click Here! GOLD Scalper Pro is a very effective and profitable trading strategy, professionally developed especially for trading GOLD (XAUUSD) . I have used th

The indicator draws daily support and resistance lines on the chart, as well as the Pivot level (reversal level).
Adapted to work in MT5
The standard timeframe for calculating support and resistance levels is D1. You can choose other timeframes according to your strategy (for example, for M1-M15, the optimal timeframe for calculations is H1)
The function for calculating support and resistance levels has been updated; in this calculation option, fibonacci levels are taken into account, res
The Expert Advisor builds a grid of orders at prices near support or resistance levels. Entry points are calculated by the EA using the author's algorithm and based on a variety of factors. The EA uses several time ranges for analysis. The built-in trend filter allows to make more accurate entries with a greater likelihood of closing them with profit and thus reducing the number of simultaneously open orders. All orders are closed upon reaching the expected profit. Through the use of TakeProfit

This tool is used to generate a K - line reflection chart of a currency pair for foreign exchange transactions.
For example, if the currency pair is EURUSD, a custom currency pair named EURUSD_ref is generated and a chart for that currency pair is opened. The price of a custom pair of currency is the inverse of the price of the original pair, which is the equivalent of a new pair of currency, the USDEUR.
The usage is simple, put it on any chart, the new chart will open, and then draw the co
EA de Long & Short para B3 BOVESPA BMF IBOV Link para entender como funciona a parametrização e o painel de controle mql5.com/pt/blogs/post/757181
Esse Expert Advisor (EA) foi desenvolvido para realizar operações de Long & Short na Bolsa de Valores de São Paulo (B3 BOVESPA), podendo funcionar tanto em formato de Day Trade quanto de Swing Trade. Ele automatiza o processo de identificação de oportunidades de negociação entre dois ativos (Símbolo 1 e Símbolo 2), aproveitando as discrepâncias de p
* This product was converted using "BRiCK Convert4To5 MT4 " based on the MQL4 source file of "BRiCK Convert4To5 MT4 Free" . "Convert4To5" is a Script that converts MQL4 source files into MQL5 source files.
Experts, Indicators, Scripts, and Libraries with extension ".mq4" will be available for MT5.
Parameter
None.
Procedure
1. Open the following folder.
terminal_data_folder\MQL4\Files\ (in the terminal menu select to view "File" - "Open the data directory") 2. Confirm that the BRiC
FREE

Engulfing Candlestick Bulkowski The engulfing candlestick is a well-known candle pattern composed of two candles. This indicator for showing engulfing candlestick that describe by Thomas Bulkowski.
If you need for MetaTrader 4 version, please visit here: https://www.mql5.com/en/market/product/34193
Feature Highlights Show bullish engulfing and bearish engulfing. Customizable "Up Symbol". Customizable "Down Symbol". Customizable symbol distance from candlestick. Customizable "Down Color". Cus

"ONE SHOT, ONE KILL" - Trade like a Pro SNIPER . The best EA for anyone who loves the ACCURACY, PATIENCE, PERFECTION. The EA works like a sniper who hidden and waits until the best chance coming. So that, it only places about one order per month on average. While waiting, it takes time to analyze the market to find a unique pattern with the highest win rate (you can see it takes time in the backtesting). - This EA isn't suited for people who want to trade a lot of orders per day, trade every day

"Quick Copier" is designed to copy trading without any complicated settings. It copies master orders faster than "Just Copier" (https://www.mql5.com/en/market/product/20920). Please also check this product at fxina.hostingerapp.com. The copy can be done in one PC. One EA can be set as master (provider) or slave (receiver). The receiver lot can be set to multiple providers lots. Any type of copy is available. MT4 -> MT5 MT4 -> MT4 MT5 -> MT5 MT5 -> MT4 If you want to copy MT4 -> MT5 or MT5 -> MT
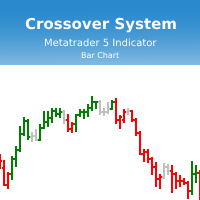
Индикатор Crossover System основан на трех скользящих средних, который изменяет цвет баров в зависимости от определенных условий скользящих средних. Этот индикатор позволит реализовывать системы из одной скользящей средней, из двух скользящих средних и из трех скользящих средних. Параметры индикатора: fastperiod - период быстрой скользящей средней fastMethod - метод построения быстрой скользящей средней fastPrice - метод вычисления быстрой скользящей средней fastshift - сдвиг быстрой скользя

Blahtech Fisher Transform indicator is an oscillator that displays overbought and oversold locations on the chart. The Fisher Transform algorithm transforms prices with any distribution shape into a normal distribution. The end result is a curve with sharp turning points that may help to identify bullish or bearish trends. Fisher Transform values exceeding 1.66 on the daily chart are considered to be good areas for reversal trades. Links [ Install | Update | Training | All Products ]
This indicator helps you control several pairs in a small workspace, therefore, it is not necessary to open several charts on the platform to do so. The indicator shows sequentially up to 6 different pairs, besides that each of these pairs has a button with which you can stop the indicator to observe the selected pair. Place the indicator on a chart to monitor several pairs and the rest of your space use it on the chart of the pair you wish to observe in detail. MT4 version Parameters Ob

Trade easily from the chart with CAP Trade Pad EA . It handles risk management for you and can perform several useful tasks with your existing trades. Trade easily from the chart Trade with precise risk management hassle free Set your desired stop loss and take profit levels Close all existing trades with a single click Delete all pending orders with a single click Reap partial profits with a single click It has no input parameters
How to Use Please Read this blog - Details Information in o
FREE

Blahtech Moving Average indicator is a multitimeframe version of the standard Moving Average indicator. It is also enhanced with customisable alerts, period breaks and other configuration options. The 50 day and 200 day moving averages are widely followed by investors and traders, with breaks above and below the MA lines considered to be signals of interest. Links [ Install | Update | Training | All Products ]
Feature Highlights Up to three timeframes Configurable calculation variab
FREE
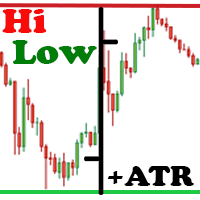
The Hi Low Last Day ( Hi Lo Last Day ) indicator shows the high and low of the last trading day and the second trading day. There are many trading strategies on the daily levels. This indicator is indispensable when using such trading strategies. In fact, everything is simple in trading, you just need to understand and accept it for yourself. There is only price!!! What is price? This is the level on the chart. The level is the price that the buyer and the seller are holding back. What price is
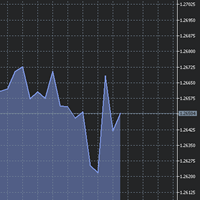
The utility Filled Area Chart adds to the standard set of price presentations. It is a brand new, nice price chart. You will certainly like it if you want to feel yourself a trader born under the Bloomber lucky star.
The Properties allow to set the colors and other things: Color preset - choose a preset or set to "Custom" and set your own colors using the properties below.
Custom area color - color of the area below the price line. Works only with Color preset = Custom.
Custom chart color -
FREE
The purpose of this utility is to manage one or more subwindow in the same chart by opening and closing them through a button or the keyboard keys
How it works: If you want to handle more than one subwindow you need to reinstall the indicator . In this case some setups has to be customized onlu in the last subwindow installed and others setups in the installed subwindow during the first time installation. They are denoted in the input rispectively as ' LW ' and ' IW '.
First of all insta

One of the best tools for analyzing volume,
Weis Wave was idelized by David Weis, to facilitate the reading of directional flow. For the VSA method disciples it is an evolution of the practices created by Richard Wycoff, facilitating a predictive reading of the market, always seeking an accumulation and distribution of the negotiated contracts.
Cumulative wave volume Range of wave ( removed) Average Wave volume Ref "Tim Ord lectures" ( removed)
FREE

Highly configurable OBV indicator.
Features: Highly customizable alert functions (at levels, crosses, direction changes via email, push, sound, popup) Multi timeframe ability Color customization (at levels, crosses, direction changes) Linear interpolation and histogram mode options Works on strategy tester in multi timeframe mode (at weekend without ticks also) Adjustable Levels Parameters:
OBV Timeframe: You can set the lower/higher timeframes for OBV. OBV Bar Shift: Y ou can set the offs
FREE

KT Momentum Arrows Indicator is based on a momentary breakout which is calculated using the bands deviation and emerging volatility in a certain direction. A buy signal is generated when the price closes above the upper band and a sell signal is generated when the price closes below the lower band. A magnitude coefficient is used as the input which affects the band deviation and volatility at the same time. The coefficient value should be carefully selected and analyzed based on the instrument a

TeaCii Auto Fibonacci MTF is an implementation of Fibonacci Levels The indicator is simple and yet more powerful than those in the market
IMPORTANT: UNIQUE SELLING POINTS - The Levels are set automatically - You can see ANY TIMEFRAME Levels in ANY Chart. E.g. Watch H1 on M1. Watch M1 on H1 - The Levels are available in Buffers for EA Use - Helps you to get an edge early in by using multi timeframe
Parameters TimeFrame : The timeframe of the indicator. It can be same, higher or lower than t

KT COG is an advanced implementation of the center of gravity indicator presented by John F. Ehlers in the May 2002 edition of Technical Analysis of Stocks & Commodities magazine. It's a leading indicator which can be used to identify the potential reversal points with the minimum lag. The COG oscillator catches the price swings quite effectively.
MT4 version of the same indicator is available here KT COG Advanced MT4
Calculation of COG The COG indicator is consist of the two lines. The mai

HV Models is an Indicator that containes 4 methods for calculating historical volatility of the selected asset. Volatility is one of the fundamental values describing changes in the underlying asset. In statistics, it usualy describes as a standard deviation. The price chart has 4 values (Open High Low Close) when we calculate volatility using a standard indicator, only one of these values is used as a result we get one-sided volatility picture. The presented indicator uses 4 volatility ca

Market Sentiment is an indicator for MT5. Market sentiment is the feeling or tone of a market . Also called investor sentiment, it is generally described as being bullish or bearish : When bulls are in control, prices are going up . When bears are in control, prices are going down . Markets being driven by emotions, the market sentiment is about feelings whereas fundamental value is about business performance .
Settings : Range in bars : numbers of bars used for the calculation, at your own

常に利益を上げる5つ星FXトレーダーになりたいですか? 1. シンプルな取引 システムと 2020年のメジャーストラテジーアップデートの 基本説明を読む 2. 購入時のスクリーンショットを送信して、専用取引チャットへの個人的な招待を受ける
このトレードマネージャーは 、 全自動取引管理を使用したいすべての FXトレンド ユーザーにとって理想的な追加機能です。
手動で開いた取引を直ちに検出し、FXトレンドのトレンドラインに沿って自動的にストップを管理 します。
お客様のトレードは、トレードマネージャーのプロパティで設定された固定計算設定に基づいて管理されています。
適切なEAマジックナンバーを設定することで、これらのEA注文をあなたの個人的なトレンド取引スタイルに従って管理することができます。 有効な注文の自動検出 イニシャルストップの自動設定 トレーリングストップの自動化 Expert Advisorsの注文の自動検出 アクティブなExpert Advisor注文の自動管理 カウンタートレンドのトレードのためのセキュリティ・ストップロス ブレークイーブン・ストップロ
CAP Universal Grid EA MT5 is a highly efficient and mechanical trading strategy which has no reliance on direction, profits from volatility and uses the intrinsic wavy nature of the market. [ Installation Guide | Update Guide | Submit Your Problem | FAQ | All Products ] Easy to set up and supervise No indicators or hard analysis needed Grid trading is time-frame independent Requires little forecasting of the market Extracts money out of the market regularly
Key Features Easy to set
Description: - Chart Time + Indicator is very simple and easy, but it can be very important to control the time before opening any manual trade. This indicator shows the time in a panel between 3 different options. Can be possible to move the panel with mouse or with fixed coordinates on the chart. Input Parameters: - Local Time : Enable Local Time if you want to show it (Personal Computer Time). - Server Time : Enable Server Time if you want to show it (Broker Time). - GMT Time
This indicator copies graphical objects (vertical lines, horizontal lines, text labels, fibo and etc.) from master chart to other charts.
For example, you can copy lines from the chart GBPUSD with period H1 to chart GBPUSD with period M15. It's makes technical analyses more simple. Show label - show label on the Master chart, where you draw graphical objects to copy; Font size - font size of label; Type of synchronisation - type of synchronisation Copy text - on/off copy of text objects
Copy
FREE

RSI magic kjuta trial is the demo version of RSI magic kjuta.
Custom Indicator (RSI magic kjuta) based on the standard (Relative Strength Index, RSI) with additional settings and functions. The maximum and minimum RSI lines on the chart have been added to the standard RSI line. Now you can visually observe the past highs and lows of RSI, and not only the values of the closing bars, which avoids confusion in the analysis of trades. For example, the EA opened or closed an order, but the RSI l
FREE

This positions risk visualization indicators, indicators allow you to clearly know price go back will be generated how much account Loss Percent. This is very useful indicator for Controlling Risk when account is open positions, attach this indicator to the chart of the open positions, this indicator will draw three Lines, the three Line of Loss Percent default value is 10% 30% 50% user can define their own Loss Percent value. Loss Percent corresponding Back Point will show in the upper

Magic Finger can help you identify trends and trading opportunities clearly. The finger points to the open position signal, and the discoloration line is confirmed by the trend.
If you are a day trader, you can choose to trade during a period of active trading, referring to the discoloration line as the basis for the next order, finger signal as a filter.
If you are a trend trader, you can choose a period above H1, wait for the appearance of the finger signal in the key price area, and enter
Santa Scalping is a fully automated Expert Advisor with no use of martingale. Night scalping strategy. The SMA indicator filter are used for entries. This EA can be run from very small accounts. As small as 50 EUR.
General Recommendations The minimum deposit is 50 USD, default settings reccomend for eurusd m5 gmt +2 . Please use max spread 10 if you will not have orders change it to -1. Use a broker with good execution and with a spread of 2-5 points. A very fast VPS is required, preferably w

Индикатор RSI magic kjuta5 .
Пользовательский Индикатор ( RSI magic kjuta ) на основе стандартного Индикатора Силы ( Relative Strength Index, RSI ) с дополнительными настройками и функциями. К стандартной линии RSI добавлены линии максимального и минимального значения RSI на графике. Теперь можно визуально наблюдать прошедшие максимумы и минимумы RSI , а не только значения по закрытию баров, что позволяет избежать путаницы при анализе торгов. Например, советник открыл или закрыл ордер, но

BeST_Darvas Boxes is a Metatrader Indicator based on the trading method developed in the 50’s by the Hungarian Nicolas Darvas . BeST_Darvas Boxes indicator draws the Top and the Bottom of every Darvas Box that can be confirmed on the current Chart draws Buy and Sell Arrows for every confirmed Upwards or Downwards Breakout of the above levels draws always only after the bar closing and so is non-repainting or backpainting it can be used as a standalone trading system/method
Inputs
Basic Sett
Scalpermultichartsmt5 は、ナイトスキャルピングのための完全自動マルチ通貨取引システムです。 特徴 Expert Advisorは28のメジャーメジャーとクロスで取引しています , Gold, Silver 。 Expert Advisorは危険な方法を使用しません Expert Advisorは、理解のために利用可能な入力パラメータの最小数を使用します Expert Advisorは、ブローカーからのすべての注文に対して固定および非表示のストップロスとテイク利益を設定します Expert Advisorは、マジックナンバーマジックを使用して注文を識別します 推奨事項 狭いスプレッドと注文の迅速な実行を持つ任意のブローカーは、取引に適しています 最低推奨預金は1 100です チャートにExpert Advisorをインストールするだけで十分です パラメータ スリッページ-価格のスリッページ Magic-マジックナンバー ロット-注文数量 TradeHour-アドバイザーの取引時間 そして、他の人。..
Expert Advisorはスプレッドと実行速度に敏

Rental/Lifetime Package Options and Privileges * For optimum results the yearly or lifetime package is suggested due to live training !
Rent Monthly Six Months Yearly/Lifetime Weis Wave with Speed with Alert+Speed Index x x x Manual x x x Quick Set up Video x x x Blog x x x Lifetime Updates x x x Setup and Training Material
x x Free Rectangle Break Alert Tool x Discord Access Channel "The SI traders"
x 2-hour live methodology training
x
How to trade with it: http://

The indicator displays the orders book, as well as increases its depth, remembering the location of orders that have gone beyond the current "window" view.
Indicator capability Display the levels of open positions. Simulation of placing/cancelling/editing pending orders directly in the displayed orders book.
Indicator features The orders book display works only on those trading symbols for which it is broadcast by the broker. To reset the information about the rows that were recorded in the
FREE

Matreshka self-testing and self-optimizing indicator: 1. Is an interpretation of the Elliott Wave Analysis Theory. 2. Based on the principle of the indicator type ZigZag, and the waves are based on the principle of interpretation of the theory of DeMark. 3. Filters waves in length and height. 4. Draws up to six levels of ZigZag at the same time, tracking waves of different orders. 5. Marks Pulsed and Recoil Waves. 6. Draws arrows to open positions 7. Draws three channels. 8. Notes support and re

Idea extracted from the books by Anna Coulling and Gavin Holmes using Volume and Spread Analysis (VSA) techniques coupled with Al Brooks' expertise with Price Action these candles are magical, identify the exact moment
of the performance of the big players are acting in the market represented by the colors:
1) Red Candles we have an Ultra High activity,
2) Candles Orange we have a Very High Activity
3) Candles Yellow we have one High Activity
4) White Candles represent normal activ
FREE

Description: - We all want to have the lowest spread and never high, with this utility we can have more information and a clearer idea of when the spread is acceptable or not. The Panel InfoSpread is a utility expert advisor and shows information on different spread options in one or more symbols, can be actual spread, average, minimum, maximum and tick counter. Read and show the symbols that are in the Market Watch window. Also you can put a maximum limit of average spread in every symbol f
Automated multicurrency Expert Advisor with an unlimited number of currency pairs. In this case, it is possible to indicate on each individual currency pair how the adviser will work with it. You can add orders manually.
The expert does not have a specific strategy. Everyone chooses what features he will use. And on what indicators and on which TF to work with them.
Real account, which is fully led by an expert. MACD and Envelopes are used . Индикаторы Two Moving Average Envelopes RSI Force

The default input values are already optimized for EURUSD at time frame M1, spread at 14 and hedged account mode with leverage 1:100 and initial deposit of US$ 10,000, if you don't have this balance, I suggest you to use a CENT account. Always use the strategy tester optimization to set the best values for your assets, time frame, spread and account mode. It is very important and strongly recommended for successful trading. Optimize the input values as your needs.The EA's Strategy The Strategy T

This is a free version of the indicator, the period between the vertical lines is always 30 bars. In the paid version the period can be set by user, so a configuration with many ThreePointsChannel indicators with different periods is possible.
The principle of construction - on top of any number of bars set by the user, a channel is constructed with maximum and minimum lines so that the bars touch the maximum and minimum of the channel at exactly three points. The name of the indicator follows
FREE

This is a free version and is forecasting only 5 bars The FourierExtrapolationMAFree indicator transforms and extrapolates the Moving Average function by the Fast Fourier Transformation method.
1. The transformation period is set by two vertical lines, by default the first blue line and the second pink.
2. By default, the Moving Average (MA) line is drawn in red.
3. By Fourier Transform, the indicator builds a model of N harmonics, which is as close as possible to the MA values. The model
FREE

The Advanced Trend Scalper MT5 indicator is designed to help both novices and professional traders. The indicator analyses the market and gives you buy and sell signals. It does not use any other indicators, it works only with the market actions. The signal appears right after the candle close and it does not repaint. The efficient algorithm provides a high degree of reliability of such signals. Advanced Trend Scalpe r for the MetaTrader 4 terminal : https://www.mql5.com/en/market/product/

Описание стратегии:
Набор торгуемых валютных пар: GBPUSD, GBPAUD, GBPCAD, GBPJPY, EURUSD, EURGBP, EURAUD, EURCAD, EURJPY, AUDUSD, AUDNZD, AUDCAD, AUDJPY, NZDUSD, NZDCAD, USDCAD, USDJPY
В момент открытия рынка после выходных, определяется на каких парах из списка цена прошла от открытия до закрытия недельной свечи более 2000 пунктов и открываем позицию в противоход недельному движению с целью забрать откат в 500 пунктов. Стоп не ставится.
Если цена пошла против позиции, то через кажды
FREE

Weiss Wave with lots of functionality and lightweight. The same can be used both in markets that have access to volume (REAL=Contracts, Tick=Business) or points!
You will be able to:
- Analyze the volume of the market by swings made!
- Define the source of the data presented in the graphic, its size and color! Or simply hide this information!
- Define whether or not to show the swings in the graph and how many swings! In addition to setting the trend line color, thi
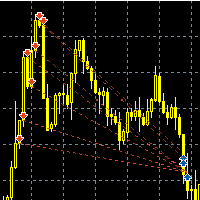
Название советника : Survivor (есть расширенная версия: https://www.mql5.com/ru/market/product/36530 ) Валютные пары : USDJPY, EURUSD, GBPUSD, AUDUSD, GBPJPY, XAUUSD, EURCHF Рекомендованная валютная пара : USDJPY Таймфрейм : М5 Время торговли : круглосуточно Описание : Трендовый советник с возможностью мартингейла и построением сетки ордеров. В советнике используются три группы аналогичных сигналов для открытия, закрытия и дополнительных сделок. При наличии тренда(определяется МА) ловится отс
FREE

It's demo version of Auto StopLoss Defender , you can buy on page - https://www.mql5.com/ru/market/product/33106 or extended version of the program is Auto StopLoss Premium , you can set stoploss and takeprofit - https://www.mql5.com/ru/market/product/33111
Demo restrictions: Stop-loss 0.10% for new order.
While you are trading, Auto StopLoss Defender doing all the routine work. "Must have" for scalping. Best way to save account balance in case of force majeure.(Internet connection lo
FREE

Binance MT5 is a tool for charting & manual trading Bitcoin and Altcoin on Binance Spot Market from MT5 platform. Support all order types: Limit, Market, Stop-Limit and Stop-Market .
Parameters Symbol = symbol name HistoryData = start time to download history data API Key = your binance api key Secret Key = your binance secret key
* You should allow WebRequest from Tools menu >> Options >> Expert Advisors and add URL: https://api.binance.com * For automatic tradin

Japanese candlestick analysis has been in existence for hundreds of years and is a valid form of technical analysis. Candlestick charting has its roots in the militaristic culture that was prevalent in Japan in the 1700s. One sees many terms throughout the Japanese literature on this topic that reference military analogies, such as the Three White Soldiers pattern Unlike more conventional charting methods, candlestick charting gives a deeper look into the mind-set of investors, helping to establ
FREE
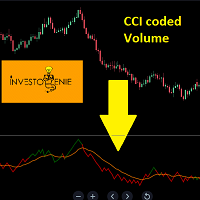
The Indicator is based on Commodity Channel Index (CCI) coded on Volume. The concept is to try and analyze the movement of Volume and Price in a certain direction
Concept:
If the Price of the indicator moves below the threshold price, it turns RED indicating the direction downwards is getting strong.
If the Price of the indicator moves above the threshold price, it turns GREEN indicating the direction upwards is getting strong.
The moving average acts as a great filter to decide entry/exi
MetaTraderマーケットは、他に類のない自動売買ロボットやテクニカル指標の販売場所です。
MQL5.community ユーザーメモを読んで、取引シグナルのコピー、フリーランサーによるカスタムアプリの開発、支払いシステムを経由した自動支払い、MQL5Cloud Networkなど、当社がトレーダーに対して提供するユニークなサービスについて詳しくご覧ください。
取引の機会を逃しています。
- 無料取引アプリ
- 8千を超えるシグナルをコピー
- 金融ニュースで金融マーケットを探索
新規登録
ログイン