YouTubeにあるマーケットチュートリアルビデオをご覧ください
ロボットや指標を購入する
仮想ホスティングで
EAを実行
EAを実行
ロボットや指標を購入前にテストする
マーケットで収入を得る
販売のためにプロダクトをプレゼンテーションする方法
MetaTrader 5のためのテクニカル指標 - 36

Indicator SR levels true in small time frames is very useful for scalping while in bigger ones it is good for day or position trading.
SR levels true can draw 4 support/resistance levels based on defined maximum rebouds from price level. Indicator scans defined number of bars in time axis and defined number of pips in price axis (both sides - up and down) and calculates how much times price was rejected from scanned price levels. At the price levels where maximum rebounds are counted, support

持続可能な分布は、金融シリーズをスムーズにするために使用できます。かなり深い履歴を使用して分布パラメーターを計算できるため、場合によっては、このような平滑化は他の方法と比較してさらに効果的です。
図は、10年間のH1時間枠でのEUR-USD通貨ペアの始値の分布の例を示しています(図1)。魅力的ですね。
この指標の根底にある主な考え方は、価格の分散によって持続可能な分布のパラメーターを決定し、データを使用して金融シリーズを平滑化することです。このアプローチのおかげで、平滑化された値は、特定の市場状況で最も可能性の高い価格値になる傾向があります。
インジケータの動作は、パラメータLBを使用して設定されます。その値は、バーで表される平滑化されたシリーズの長さを決定します。また、許容値は1〜255の範囲です。
青い線は平滑化された高値を示し、赤線は安値を示し、緑の線は終値を示します。
このインジケーターの主な欠点は、インジケーターが履歴のすべての部分で等しく安定するように、スムージングウィンドウの幅を設定できないことです。したがって、トレーダーは特定の要件に合わせてパラメ
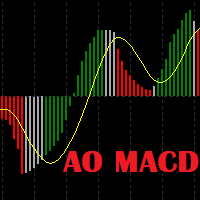
Awesome Oscillator Moving Average Convergence/Divergence Indicator. Not late as AO and not noisy as MACD. The basic version of the indicator is presented. The "PRO" version is under development with such features as sending signals to e-mail and plotting divergence and convergence lines on the chart.
Input parameters: Fast: short EMA Slow: long EMA Signal: signal line Colors: Red: MACD < Signal Green: MACD > Signal Gray: MACD above Signal, but lower than the previous MACD MACD below Signal, bu

取引を決定する際には、履歴データだけでなく、現在の市場状況にも依存することが有用です。市場の動きの現在の傾向をより便利に監視するために、AIS Current Price Filterインジケーターを使用できます。 この指標は、ある方向または別の方向で最も重要な価格の変化のみを考慮します。これにより、近い将来の短期的な傾向を予測することが可能です。現在の市場状況がどのように発展したとしても、遅かれ早かれ現在の価格はこの指標を超えます。トレーダーの観点から最も興味深いのは、価格がインディケーターレベルから可能な限り移動した状況です。これらの瞬間は、新しい取引ポジションを開くために最も最適であることが判明する可能性があります。 インジケーターの動作は、選択した時間枠に依存せず、2つのパラメーターを使用して構成されます。 FS -感度のしきい値を設定できるパラメーター。値が大きいほど、価格の動きは強くなり、インディケータで考慮されます。その許容値は0から255の範囲にあります。ゼロの値が選択された場合、感度のしきい値は現在の広がりに等しくなります。 LB -インジケーターの計算に使用される

The Relative Strength Index (RSI), developed by J. Welles Wilder, is a momentum oscillator that measures the speed and change of price movements. The RSI oscillates between zero and 100. We have added to the reputable RSI indicator several types of alerts and a signal interval filter to be incorporated in your Expert Advisors. It works in ALL Timeframes ans instruments.
Product Features Email Alert Sound alert Push Notification (Alerts can be sent to your mobile phone) Signs on chart Aler

インジケータMTFクリスタリウム矢印は、半自動取引システムであります. これは、すべての通貨ペアで動作します。
インジケータは、三つのルールを使用しています:1)我々は唯一のトレンドで取引、2)"誰もが販売しているときに購入し、誰もが買うときに販売する"、3)価格
インジケータMTF矢印は、内蔵の指標を使用して、複数の時間枠全体のクリスタリウムフィルタルール。 トレンドは、選択した時間間隔で一致した場合、インジケータは、市場に参入するための矢印を与えます。 それからあなた自身の決定をする。 購入する-緑の矢印、売る-赤い矢印。 指標では、ロットを変更したり、EAの取引時間とシャットダウン時間を設定することができます。 また、作業期間と時間フィルタを変更することができます。 ビープ音が鳴ってる
推薦された働く期間D1。 フィルタH1とH4。
設定:
TF働く期間(推薦されたD1) Cci_cperiodcomment
CCIレベルアップ
CCIレベルDn CCI価格 SARステップ SAR最大値 TFのFilter1–(推薦されたH1)

This is a multicurrency and multitimeframe indicator that calculates the angle between two points. Points for measuring the angle can be taken from the ZigZag (the last two points), or from the Moving Average (between two given bars), or it can be the closing prices of bars.
Angle measurement is possible in degrees or in radians. You can select the scale for the calculation. For a better understanding of the indicator, you can study the free Angle High Low indicator. In the parameters you can

Trailing Uses Standard Deviation.
A daptive_Trailing_uses_StdDev_Indicator is an indicator of directional movement that allows you to identify a trend at the time of its inception and set the levels of a protective stop.
Unlike trailing with a constant distance, the indicator uses the distance to the price proportional to the current standard deviation of StdDev. The distance is equal to the product of the standard deviation and the constant coefficient set by the user.
Thus, the traili

Navigators is a great tool for detecting peaks and valleys on a chart. This indicator uses a modified peak and trough detection algorithm. This algorithm includes the Fractals indicator and the ZigZag indicator.
This tool should be used to analyze peaks and valleys, as well as to detect patterns, or for other purposes. You can use this powerful tool for your own purposes at your own risk.
Using this indicator, you can anticipate the future price behavior of a certain number of bars. The indicator draws a line showing simulated future price values. You can use this information both for entering / exiting the market. So for the installation / correction of stops accompanying the position.
The indicator has several parameters. HistoricBars - The number of historical bars to analyze. FutureBars - The number of bars to predict the price. Prediction - prediction depth coefficient.
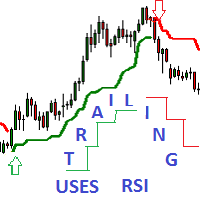
Adaptive Trailing uses RSI Indicator - an indicator of directional movement that allows you to determine the trend at the time of its inception and set the levels of a protective stop.
Trailing can be carried out both from below, when the stop level is below the current price and is pulled up behind the price if it increases, and above, when stop levels are above the current price.
There are two modes for calculating the stop level. Simple trailing is done with a constant distance of Npoint

KT MA Crossover draws the buy and sell arrows based on the crossover of chosen moving averages. Moreover, it also generates the appropriate alerts and displays the MFE (Most Favorable Excursion) for each successive signal. The moving average crossover is one of the primary strategies followed by traders around the world. Usually, it consists of a fast and slow moving average to find a buy and sell entry signal according to the crossover direction. Buy signal - when fast MA crosses above the slo

Hurst Fractal Index Фрактальный Индекс Херста - показатель персистентности временного ряда При значении индикатора >0.5 временной ряд считается персистентным (тенденция сохраняется) При значениях индикатора явно < 0.5 временной ряд считается антиперсистентным (возможна смена направления движения) Для наглядности значения индекса усредняются периодом 2-3. Настройки индикатора: Max Bars - глубина истории расчета (кол-во баров на графике для которых произведён расчет) Data from Timeframe - исполь

KT Round Numbers plots the round number levels which are also commonly known as psychological levels in the Forex world. In the context of Forex trading, round number levels are those levels in which there are two or more zeroes at the end. They are named as 00 levels on the chart.
Some traders also consider the halfway points as a valid round number level. They are named as 50 levels on the chart.
Use of round number levels in trading Round number levels work as strong support and resistan

MOON 4 TREND COLORS: is a Tren indicator. I s a powerful indicator of TREND for any par and any timeframe. It doesn't requires any additional indicators for the trading setup.The indicator gives clear signals about opening and closing trades, PAINTING THE CANDLES OF COLOR IN FUNCTION OF THE SENSE OF TREND .This Indicator is a unique, high quality and affordable trading tool.
Perfect For New Traders And Expert Traders Low risk entries. For MT5 Only Great For Scalping Great For Swing Trad
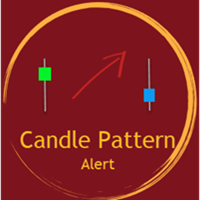
Candle Pattern Alert indicator alerts when the last price closed candle matches the set input parameters. You can choose to scan through all the symbols in Market Watch or enter your favorite symbols and also you can enter time frames you need to scan. ---------Main settings-------- Select all symbols from Market Watch? - if Yes the program scans through all the symbols displayed in Market Watch, if No - only selected in next input symbols are scanned
Enter symbols separated by commas - enter s
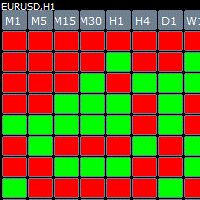
Cube indicator represents the original candle stick chart but in a top down cube form in order to see previous patterns in the markets more easy. The indicator has build in alert once there is a consecutive 3,4,5 bars in a row you get an message.
Parameters Bars_Limit = total visible cubes
TF_M1 = true; TF_M2 = false; TF_M3 = false; TF_M4 = false; TF_M5 = true; TF_M6 = false; TF_M10 = false; TF_M12 = false; TF_M15 = true; TF_M20 = false; TF_M30 = true; TF_H1 = true; TF_H2 = false; TF_H

ZenMACDインジケーターについて話す
4色2線式MACD
列の面積の合計を表示する
InpFastMA = 12; //高速EMA期間
InpSlowMA = 26; //遅いEMA期間
InpSignalMA = 9; //信号SMA期間
InpAppliedPrice = PRICE_CLOSE; //適用価格
InpMaMethod = MODE_EMA; // Ma_Method
input bool ChArea = false; // chzhshch Area
高速EMA期間高速回線パラメータ
遅いEMA期間の遅いラインパラメータ
信号SMA周期信号線パラメータ
オプションのアプリケーション価格
ツイスト理論で定義されたトレンド強度を対比し、2つのトレンドを比較し、カラム面積の合計を比較します
このインジケータは、対応する領域を計算し、比較を容易にします
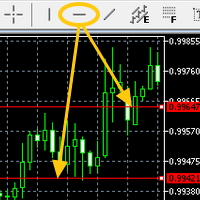
Attach the indicator on the chart and draw the red line from the button on MT5's built-in menu bar then the alert will be sent to you(push,email,popup and sound)
Hi You all know the red line (the MT5 built-in red line) drawn from the menu bar on MT5. It is often used to check the resistance etc.....It is very useful but it is little troublesome to get an alert(sound, push, email and popup) when the red line is touched by the price. Here is Price Touch Alert indication, just use the button t

Candlestick patterns
The candlestick Pattern Indicator and Scanner is designed to be a complete aid tool for discretionary traders to find and analyze charts from powerful candle patterns. Recognized Patterns:
Hammer Shooting star Bearish Engulfing Bullish Engulfing Doji Marubozu
Scanner Imagine if you could look at all the market assets in all timeframes looking for candlestick signals.

For any trader, the result of market analysis is the correct determination of entry and exit points from the market. The ClearArrows indicator does not display any unnecessary information that may distract or mislead the trader, but only the most important thing. The indicator is very easy to use, when a down arrow appears, you need to open a SELL deal, when an up arrow appears you need to open a BUY deal.
The ClearArrows indicator, despite its outward simplicity, has a large analytical algor
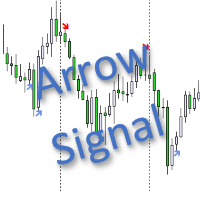
この指標は「確率的」カテゴリに属します。インジケーターコントロールをできるだけ単純化しようとしたので、入力パラメーターに最小設定が表示されます。これは、信号矢印のアイコンの選択です。 「買う」信号が「 購入アローコード 」パラメータでエンコードされ、そして「売る」信号が「 アローコードを売る 」パラメータを用いて符号化されます。信号の信号矢印コード(32〜255の値を使用してください)は、Wingdingsフォントから取得されます。 インジケーターはティックごとに機能し、現在のバーでシグナルを検索します(現在のバーはチャートの右端のバーです)。そのため、現在のバーでシグナルが表示されたり消えたりする状況が発生する可能性があります。このプロパティを知っていると、早期のシグナルを受信したい場合は、現在のバーからのシグナルを使用できます。しかし同時に、それはよりリスクの高い取引になります。前のバーからのシグナルを使用する場合、そのような取引はより安全になります。 バージョン2では、信号検索アルゴリズムが変更されました。バージョン2は、一部の誤った信号を遮断します。

O GRIDBOT WIM robô de investimento para Mini Índice.
Parametrizado com grade linear ou zona de expansão (FIMATHE).
CONFIGURAÇÕES: Ponto de entrada Pivot dia anterior double r1 = pivot + distance; double r2 = r1 + distance; double r3 = r2 + distance; double r4 = r3 + distance; double r5 = r4 + distance; double r6 = r5 + distance; double r7 = r6 + distance; double r8 = r7 + distance; double r9 = r8 + distance; double r10 = r9 + distance; double s1 = pivot
Smart Breakout Indicator determines support and resistance levels and also shows the breakout points of the levels in the form of a histogram.
The program contains two indicators in one: 1-support and resistance lines, 2-histogram indicator based on high price fluctuations. The indicator autonomously calculates the best support and resistance levels and also in the form of a histogram shows the best moments of the breakdown of the lines.
The histogram indicator is based on the action of p

Ez Channel インジケーターは、チャート内の実際のトレンドチャネルを自動的に識別するため、トレンドフォロートレーダーにとって不可欠なツールです。このインジケーターを使用すると、チャート上にトレンド ラインを手動で描くために何時間も費やす必要がなくなります。任意のシンボルと時間枠のトレンド チャネルをすばやく描画することで、時間と労力を節約します。 Ez Channel の主な機能の 1 つは、好みに応じて期間を簡単に調整できるミニ コントロール パネルです。このコントロール パネルでは、新しい市場の動きによる変化が発生する前に、識別されたチャネルを保存することもできます。この機能により、傾向線を再描画する手間をかけずに、市場の傾向を簡単に追跡および分析できます。 Ez Channel はすべてのシンボルとタイムフレームに適しているため、多用途でさまざまな取引戦略に適用できます。これにより、識別されたチャネルを将来の使用に備えて保存することができ、これらの保存されたチャネルを任意の時間枠で表示することができます。この機能により、さまざまな時間枠にわたる傾向を比較および分析できるよ

Hello, pleasure to welcome you here, my name is Guilherme Santos. QB Indicator is the best indicator with easy to setup built-in RSI, truly a powerful tool! Basically its concept is to indicate entries in regions of market exhaustion. Just attach it with the default settings on any currency pair and watch the magic happen. Also try and other timeframes like M1 and M15. Some settings available: RSI Period RSI Overbought Limit RSI Oversold Limit when to buy When the indicator sets a green arrow on

Our goal is to provide accessible and quality service, enable market participants, traders and analysts alike, with much-needed tools for informed, timely trading decisions. The most optimized, highly robust and easy to use DYJ Trend analyst indicator. DYJ Trend analyst attempts to gauge bullish and bearish forces in the market by using two separate measures, one for each type of directional pressure. The indicator's BearsIndex attempts to measure the market's appetite for lower prices. The in
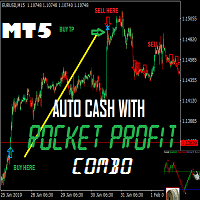
This is a great Metatrader5 Tool , which you can use Daily for your profitable Trading. The Accuracy is the best system you need to succeed in trading without stress. The signals doesn't repaint at all, alerts on bar close, and stays glued. The system works on MT5 and another version for MT4 also available.
What you get upon purchase:
-Lifetime support for the use of the system - Easy to use, clean user friendly interface with no single settings required - Arrow Signals showing where t
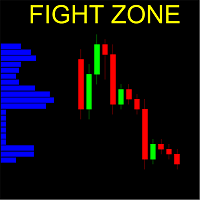
Vertical bar chart of candles!
What is it
This indicator creates a vertical bar chart of all visible candles corresponding to the amount of candles that the bars cross. The goal of this indicator is to easily check the places or regions where the candles concentrate. Those regions are a good place to place positions because they have a increased chance of staying more time there again.
It's hard to explain in words the exactly working of this indicator, we suggest you watch the video, it i

This indicator determines the short-term and long-term trend. The analysis is based on the selected timeframe. Indicator shows the points of opening deals for sale or purchase, and also indicates the direction of the trend at: Short term Long term
This indicator not only signals an immediate purchase or sale. It indicates short term and long term trend. The indicator allows you to examine in more detail the real and historical market trends!
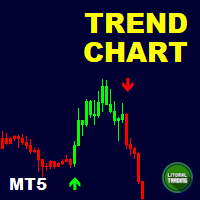
Are you the trend surfing type? Do you like to follow the big sharks? Nope? So you are the type that trades reversion? Awaiting the trend exhaustion and entering on trade?
So this indicator is for you ! With it is extremely easy to identify the trend and when it reverses because the chart is automatically colored according to a defined moving average. You can change it settings and make it your own (or hide it).
In addition it is possible to have indicative arrows on chart and also popup and
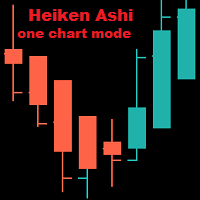
Heiken Ashi On One Chart Mode The indicator is displayed only on one of the chart modes: Bars, Candles, Line. The default is Bars. When switching the chart mode, the indicator is displayed or disappears depending on the chart mode. Input parameters: iChartMode: on what chart mode should the indicator be displayed mBars mCandles mLine Colors: LightSeaGreen: bull candle Tomato: bear candle

Candlestick Patterns MT5 is a simple and convenient indicator able to define 29 candle patterns.
Advantages Defines and highlights 29 candle patterns; Estimated trading direction is shown as an arrow; Each candlestick pattern can be disabled in the settings; The indicator can be used as an arrow indicator in EAs.
Parameters TextSize - chart text size; TextColor - chart text color; Alert - enable/disable alerts; ---------- Candlestick Patterns ------------- - settings separator; AdvanceB
トレーダーに市場のダイナミクスと取引機会に関する貴重な洞察を提供する強力なテクニカル指標である、 Awesome Oscillator Alert の紹介です。包括的な機能とユーザーフレンドリーなインターフェイスを備えたこのインジケーターは、市場で優位性を獲得したいトレーダーにとって不可欠なツールです。
Awesome Oscillator Alert の際立った機能の 1 つは、すべての通貨ペアと時間枠との互換性です。主要通貨ペアでもエキゾチック通貨でも、このインジケーターは取引戦略にシームレスに統合できます。さらに、ユーザーフレンドリーなインターフェイスによりパラメータを簡単にカスタマイズできるため、個々の取引の好みに合わせてインジケーターをカスタマイズできます。
リアルタイムのアラートは取引を成功させるための重要な要素であり、Awesome Oscillator Alert はそれらを正確に提供します。ポップアップ、サウンド、モバイル アラートを介して即座に通知を受け取り、重要な入退出信号を常に通知します。このリアルタイムのフィードバックにより、タイムリーな取引決
This is a trend indicator based on a strategy created by William Dunnigan that emit signals to buy or sell on any timeframe and can assist in decision making for trading on stock market or Forex. The signals are fired according to the following rules: Buy Signal = Fired at the first candlestick in which close price is higher than the higher price of the last candlestick. The higher and lower prices of the current candlestick must be higher than the corresponding ones of the last candlestick as w

The Metatrader 5 has a hidden jewel called Chart Object, mostly unknown to the common users and hidden in a sub-menu within the platform. Called Mini Chart, this object is a miniature instance of a big/normal chart that could be added/attached to any normal chart, this way the Mini Chart will be bound to the main Chart in a very minimalist way saving a precious amount of real state on your screen. If you don't know the Mini Chart, give it a try - see the video and screenshots below. This is a gr

The VMA is an exponential moving average that adjusts its smoothing constant on the basis of market volatility. Its sensitivity grows as long as the volatility of the data increases. Based on the Chande's Momentum Oscillator, the VMA can automatically adjust its smoothing period as market conditions change, helping you to detect trend reversals and retracements much quicker and more reliable when compared to traditional moving averages.

Every trader knows that he or she should never Risk more than 2% (or 5%) per trade. This is a Money Management law and an usable LotSize should be calculated each time because a trader must use a different StopLoss value for different Support and Resistant level. This indicator will calculate an appropriate LotSize for the moment when you will put it on the chart and each time you will drag the "Stop Loss Line" in any direction.
Inputs: Order_Type - Buy or Sell TakeProfitPoints - how many p
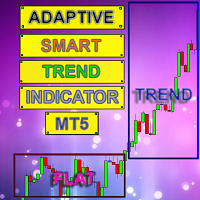
Smart indicator Adaptive Smart Trend Indicator determines the sectors of the Trend and the Flat and also in the form of a histogram shows the breakdown points of the levels (1 - 5).
The indicator performs many mathematical calculations to display more optimal Trend movements on the chart.
The program contains two indicators in one: 1 - draws the Trend and Flat sectors, 2 - the histogram indicator shows the best signals for opening an order. The indicator autonomously calculates the mo

The Rise of Sky walker is a trend indicator is a powerful indicator for any par and any timeframe. It doesn't requires any additional indicators for the trading setup.The indicator gives clear signals about opening and closing trades.This Indicator is a unique, high quality and affordable trading tool. Can be used in combination with other indicators Perfect For New Traders And Expert Traders Low risk entries. Never repaints signal. Never backpaints signal. Never recalculates signal. Great Fo

Crossing of market price and moving average with all kinds of alerts and features to improve visualization on the chart.
Features Crossing of market price and Moving Average (MA) at current bar or at closing of last bar; It can avoid same signals in a row, so it can allow only a buy signal followed by a sell signal and vice versa; MA can be set for any of the following averaging methods: Simple Moving Average (SMA), Exponential Moving Average (EMA), Smoothed Moving Average (SMMA), Linear-w

- This is an indicator of directional movement that allows you to determine the trend at the time of its inception and set the levels of a protective stop.
Trailing can be carried out both from below, when the stop level is below the current price and is pulled up behind the price if it increases, and above, when stop levels are above the current price.
Unlike trailing with a constant distance, the stop level is set at the lower boundary of the quadratic regression channel (in the case of t

KT Power Pennant finds and marks the famous pennant pattern on the chart. A pennant is a trend continuation pattern with a significant price movement in one direction, followed by a period of consolidation with converging trend-lines.
Once a pennant pattern is formed, a buy/sell signal is provided using a bullish or bearish breakout after the pattern formation. MT4 Version is available here https://www.mql5.com/en/market/product/44713
Features
Pennant patterns provide a low-risk entry aft
This app supports customer investments with equipment financing and leasing solutions as well with structured chat Our success is built on a unique combination of risk competence, technological expertise and reliable financial resources.
Following topics are covered in the Trading Support Chat -CUSTOMISATION -WORKFLOW -CHARTING TIPS -TRADE ANALYSIS
PLEASE NOTE That when the market is closed, several Brokers/Metatrader servers do not update ticks from other timeframes apart from the current

Trend indicator Carina . The implementation of the trend indicator is simple - in the form of lines of two colors. The indicator algorithm is based on standard indicators as well as our own mathematical calculations. The indicator will help users determine the direction of the trend. It will also become an indispensable adviser for entering the market or for closing a position. This indicator is recommended for everyone, both for beginners and for professionals.
How to interpret information f

Horizontal Volumes Indicator - using a histogram, displays the volume of transactions at a certain price without reference to time. At the same time, the histogram appears directly in the terminal window, and each column of the volume is easily correlated with the quote value of the currency pair. The indicator practically does not require changing the settings, and if desired, any trader can figure them out.
The volume of transactions is of great importance in exchange trading, usually an in

*Non-Repainting Indicator Arrow Indicator with Push Notification based on the Synthethic Savages strategy for synthethic indices on binary broker.
Signals will only fire when the Synthethic Savages Strategy Criteria is met BUT MUST be filtered.
Best Signals on Fresh Alerts after our Savage EMA's Cross. Synthethic Savage Alerts is an indicator that shows entry signals with the trend. A great tool to add to any chart. Best Signals occur on Fresh Alerts after our Savage EMA's Cross + Signal

mql4 version: https://www.mql5.com/en/market/product/44606 Simple indicator to calculate profit on fibonacci retracement levels with fixed lot size, or calculate lot size on fibonacci levels with fixed profit. Add to chart and move trend line to set the fibonacci retracement levels. Works similar as default fibonacci retracement line study in Metatrader. Inputs Fixed - select what value will be fix, lot or profit Fixed value - value that will be fix on all levels Levels - levels for which

The Candlestick Patterns indicator for MT5 includes 12 types of candlestick signales in only one indicator. - DoubleTopsAndBottoms - SmallerGettingBars - BiggerGettingBars - ThreeBarsPlay - TwoBarsStrike - Hammers - InsideBars - OutsideBars - LongCandles
- TwoGreenTwoRed Candles - ThreeGreenThreeRed Candles The indicator creats a arrow above or under the signal candle and a little character inside the candle to display the type of the signal. For long candles the indicator can display the exac

This incicator shows you when a pin bar is formed, and aid you perform a inversion strategy or a trend continuation based on resistence support and or channel. Typically a pin bar shows you a price rejection from the market and the signal most of time is profitable. So i suggest to use buy/sell limit order over ratrace SL little bit over or below bar and take profit based on your strategy and money management.
Best timeframe are D H4 H1

The main idea of this product is to generate statistics based on signals from 5 different strategies for the Binary Options traders, showing how the results would be and the final balance based on broker's payout.
Strategy 1: The calculation is secret. Strategy 2: The signal is based on a sequence of same side candles (same color). Strategy 3: The signal is based on a sequence of interspersed candles (opposite colors). Strategy 4: The signal consists of the indicators bollinger (we have 3 typ

This product is a set of tools that help the trader to make decisions, bringing information from different categories that complement each other: trend, support / resistance and candle patterns. It also has a panel with information about the balance. The trend has two different calculations and is shown as colored candles. Strategy 1 is longer, having 3 different states: up, down and neutral trend. Strategy 2 has a faster response and has only 2 states: up and down trend. Support and resistance

1. Why did I develop this series of indicators
I found that most traders need to use multiple time frame indicators. They usually switch time frame to see indicators. However, once the timeframe is switched, you cannot see the corresponding relationship between the price in the smaller timeframe and the indicator in the larger timeframe . For example: if your price chart is in H1 timeframe, you can see H4, D1 and W1 indicators in H1 timeframe Chart. This is more helpful for you to find t
MetaTraderマーケットは、開発者がトレーディングアプリを販売するシンプルで便利なサイトです。
プロダクトを投稿するのをお手伝いし、マーケットのためにプロダクト記載を準備する方法を説明します。マーケットのすべてのアプリは暗号化によって守られ、購入者のコンピュータでしか動作しません。違法なコピーは不可能です。
取引の機会を逃しています。
- 無料取引アプリ
- 8千を超えるシグナルをコピー
- 金融ニュースで金融マーケットを探索
新規登録
ログイン