YouTubeにあるマーケットチュートリアルビデオをご覧ください
ロボットや指標を購入する
仮想ホスティングで
EAを実行
EAを実行
ロボットや指標を購入前にテストする
マーケットで収入を得る
販売のためにプロダクトをプレゼンテーションする方法
MetaTrader 4のためのエキスパートアドバイザーとインディケータ - 36

Three white Candlestick USES THE TREND WAVE INDICATOR AND IT CAN IDENTIFY THE BEGINNING AND THE END OF A NEW WAVE TREND MOVEMENT.
AS AN OSCILLATOR, THE INDICATOR IDENTIFIES THE OVERBOUGHT AND OVERSOLD ZONES.
IT WORKS GREAT TO CATCH THE SHORT TERM PRICE REVERSALS AND USES A MARTINGALE STRATEGY TO CLOSE ALL TRADES IN PROFIT.
USE DEFAULT SETTINGS ON H1 OR HIGHER TIME FRAME ON ANY PAIR FOR MORE ACCURATE TRADES
WHY THIS EA :
Smart entries calculated by 4 great strategies The EA can be run

Gold Hacker EA is built with our years of experience in trading and programming skills, based on the fact that trend is always your friend with consideration of the variety of market conditions , by combining the trend indicators with our mathematical strategy to always follow the trend and recover from the sideways trend. Unlike traditional methods that solely rely on Stop Loss orders to limit losses, Gold Hacker EA uses an efficient mechanism to manage losing positions. We support risk manage

The EA of Bollinger Bands are a popular technical analysis tool used by traders and investors to analyze price volatility and potential price reversal points in financial markets, such as stocks, forex, or cryptocurrencies. They consist of three lines: The middle band: This is typically a simple moving average (SMA) of the price over a specific period. The most common period used is 20. The upper band: This is the sum of the middle band and twice the standard deviation of the price over the same
RSI Intelligent is a fully automated scalping robot that uses a very efficient Relative Strength Index (RSI) breakout strategy, Probabilistic analysis with (RSI). Most effective in the price Cumulative probability of a normal distribution that occupy the bulk of the market time. Transactions happen almost every day like Scalping follow trend. A Forex robot using the Relative Strength Index (RSI) indicator combined with an artificial neural network would be an advanced automated trading system th

DYJトレンド反転EAはDYJトレンド反転指標に基づく
ATRトレンドラインを使って入場信号を探します。
EAは指示ファイル信号を直接呼び出すことができる。
インジケータファイルのサポートなしで信号を取得することも可能です。
EAはグリッドとデュアル投資戦略を採用する。
二重投資戦略の開始取引はリスクパラメータによって制御できる。
EAはリスクモードでEAのストップロスと出来高ポーリングをコントロールできる。
リスク管理モデルには、最大株主資本または最大取引量に達することが含まれます。
EAは利益目標追跡と反対のシグナルを使ってオフにすることができる。
EAは市場に対抗するゲーム戦略を用いている。 EA parameter template: XAUUSD( Link ) GBPUSD( Link ) Recommend ECN account
XAUUSD SPREAD is about 8, GBPUSD SPREAD is about 2, When recommending grid doubling strategy, t

Are you in search of a reliable tool to enhance your trading experience on MetaTrader 4? Look no further! "Great Safe Signal" is here to elevate your trading strategy and provide you with invaluable insights for making informed decisions. Key Features: Precision Analysis: "Great Safe Signal" employs advanced algorithms to analyze market trends and price movements with pinpoint accuracy. This ensures that you have the most precise information at your fingertips. User-Friendly Interface: We unders

For Live Results with the same EA Powerful Candle click the link below for signal copying and see the live trades as well. https://www.mql5.com/en/signals/2073310
The "Powerful Candle Strategy" is a trading strategy commonly used in financial markets, especially in the realm of technical analysis. This strategy relies on identifying specific candlestick patterns to make trading decisions. Candlestick patterns are graphical representations of price movements in a given time frame, typically on

" Valiant Strong Trend " - Your Ultimate MT4 Signal Indicator Are you ready to elevate your trading game to new heights? Look no further than the "Valiant Strong Trend" MT4 signal indicator, your indispensable tool for navigating the complex world of financial markets. Key Features: Precise Trend Identification : "Valiant Strong Trend" employs advanced algorithms to accurately identify market trends, whether they are bullish or bearish. Say goodbye to guesswork and hello to informed trading deci

Triple Candlestick USES THE TREND WAVE INDICATOR AND IT CAN IDENTIFY THE BEGINNING AND THE END OF A NEW WAVE TREND MOVEMENT.
AS AN OSCILLATOR, THE INDICATOR IDENTIFIES THE OVERBOUGHT AND OVERSOLD ZONES.
IT WORKS GREAT TO CATCH THE SHORT TERM PRICE REVERSALS AND USES A MARTINGALE STRATEGY TO CLOSE ALL TRADES IN PROFIT.
USE DEFAULT SETTINGS ON H1 OR HIGHER TIME FRAME ON ANY PAIR FOR MORE ACCURATE TRADES
WHY THIS EA :
Smart entries calculated by 4 great strategies The EA can be run on ev

Here is another version of famous Super Trend indicators which is modified by Kivanc Ozbilgic. I have get the code from Trading View and converted it to MT4 language. this is great opportunity for Trading View users who want to migrate to MT4 so can test this indicator and also make their custom EAs based on it. there are much more inputs than standard super trend also there are up/down arrows with alarms as well.
The Nice Pro Signal Signal Indicator is a powerful tool designed to assist traders in making informed decisions in the financial markets. This advanced indicator leverages cutting-edge algorithms and technical analysis to identify potential entry points with high accuracy.
Features: 1. Precision Entry Points: The indicator generates precise arrow signals on the chart, highlighting potential entry points for various trading strategies.
2. Trend Identification: By analyzing price movemen

The EA Three Hammer Candlesticks Strategy is a candlestick pattern-based trading strategy used in technical analysis to identify potential trend reversals in financial markets, particularly in stocks, forex, and commodities. The strategy focuses on three specific candlestick patterns: the Hammer, the Inverted Hammer, and the Shooting Star. These patterns can provide valuable information about market sentiment and potential price reversals. Here's how the strategy works: The Hammer: The Hammer is

Welcome to the next level of precision and profitability in gold trading - introducing Gold Net Max , the ultimate Forex robot designed exclusively for scalping the gold market. This advanced trading tool combines cutting-edge technology with a relentless focus on capturing short-term price movements, allowing traders to harness the full potential of scalping strategies in the world of precious metals.
Key Features:
Scalping Expertise: Gold Net Max is a master of scalping. It's enginee

Creating a Forex trading strategy based on random patterns is generally not a recommended approach for successful trading. Forex trading is a complex financial market where traders use various strategies, technical and fundamental analysis, risk management, and market knowledge to make informed decisions. Relying on random patterns is more akin to gambling and is unlikely to yield consistent profits in the long term. Successful Forex trading strategies typically involve careful analysis and plan

Pure Safe Trend indicator is designed for signal trading. This indicator generates trend signals.
It uses many algorithms and indicators to generate this signal. It tries to generate a signal from the points with the highest trend potential.
This indicator is a complete trading product. This indicator does not need any additional indicators.
The indicator certainly does not repaint. The point at which the signal is given does not change.
Features and Suggestions Time Frame: H1

Pivot Point Super Trend is another type of famous super trend indicator which is equipped with pivot points in different way. this indicator used to be available in the Trading view and this is converted from there to the MT4 language. MT5 version of the indicator is also available and you can find in my products. there are also buy/sell signals shown on the screen.
ATR Stops is an indicator which shows Dynamic support and resistance lines by considering ATR value and also a multiplier. its highly effective to find out the trend direction and also is useful for using as stop loss levels. it could be used in different ways one usual way is to buy when line becomes green and sell when it becomes red. when its combined with money management rules and risk reward considerations there is good results.

Otto is an expert advisor (EA) that utilizes proprietary indicators and trend lines while implementing a robust risk management strategy. It focuses on generating consistent and secure profits over the long term. By employing a fractional lot approach across various currency pairs, it effectively diversifies risk and increases trading opportunities for generating profits. Additionally, Otto can be applied to trading gold to potentially yield substantial returns. The EA executes daily transactio

Title : UT_Bot - ATR-Based Trading Indicator Introduction : Discover the power of "UT_Bot," the ultimate trading indicator that leverages the Average True Range (ATR) to provide unparalleled accuracy in your trading decisions. If you're seeking a more reliable alternative to the Super Trend indicator, look no further. UT_Bot is your key to precision trading. Key Features : ATR-Powered Precision: UT_Bot uses the ATR to deliver accurate signals that adapt to market volatility. Enhanced Trend Detec
The Real Strong Signal Signal Indicator is a powerful tool designed to assist traders in making informed decisions in the financial markets. This advanced indicator leverages cutting-edge algorithms and technical analysis to identify potential entry points with high accuracy.
Features 1. Precision Entry Points: The indicator generates precise arrow signals on the chart, highlighting potential entry points for various trading strategies.
2. Trend Identification: By analyzing price movem
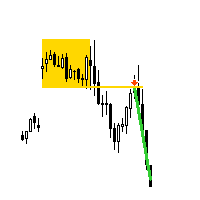
Dax index M5 Strategy
"AV Dax Breakout EA" is an Expert Advisor for MetaTrader 4, which follows a DAX M5 opening strategy . Typically, no more than one trade is opened per day on the german index.
After trend determination with the "AV SuperTrend" indicator and other conditions, a breakout trade is automatically opened as a pending order in the direction of the trend. If the conditions are not suitable, a retest trade can then be carried out and possibly later a retracement trade back to

This is the Full Version, to get the free version please contact me. The free version works on “GBPCHF” charts. All symbols and time frames scanner. Harmonic Pattern
Harmonic patterns are used in technical analysis that traders use to find trend reversals. They are considered one of the most accurate technical analysis tools, as they allow traders to predict the future price movement direction and the potential trend targets. Also, unlike many other technical tools, the number of false signal

This is the Full Version, to get the free version please contact me. The free version works on “USDJPY” charts. All symbols and time frames scanner. Contact me after payment to send you the User-Manual PDF File. OVER and UNDER
Over & Under pattern is an advanced price action trading concept in the trading industry. The Over & Under pattern is more than a confluence pattern or entry technique than a trading strategy. It is a reversal pattern that is created after a significant obvious trend. I

このインジケーターは、「回帰チャンネルツール」のコンセプトに基づいた堅牢な市場分析手法を提供します。このツールを活用することで、トレーダーはチャートの回帰チャンネルに対して優れたコントロールを行い、より情報を得てトレードの決定を行うことができます。 回帰チャンネルツールは、トレーダーのツールボックスにおける強力な道具です。価格トレンドや潜在的なサポートと抵抗レベルに対する貴重な洞察を提供することを目的としています。このツールは特にトレンド内の修正波動を視覚化するのに効果的であり、価格のダイナミクスの包括的なビューを提供します。 以下は、このインジケーターを使用する際の主な特徴と利点について詳しく説明します: チャンネルレベルとサポート/レジスタンス: このインジケーターの主な利点の一つは、動的なサポートとレジスタンスゾーンとして機能するチャンネルレベルを生成する能力です。これらのレベルは潜在的なエントリーポイントや出口ポイントを特定するのに重要であり、トレーディング戦略の精度を向上させます。 修正波動レベル: 修正波動レベルを有効にすることで、トレーダーは大きなトレンド内での潜在的な修

Creating a trading strategy using the Moving Average Convergence Divergence (MACD) indicator can be a powerful tool for traders looking to identify trends and potential entry/exit points in the financial markets. Here's a simple MACD-based trading strategy: Strategy Name: MACD Trend-Following Strategy Timeframe: This strategy can be applied to various timeframes, but it's commonly used on daily or 4-hour charts. Indicators: MACD (Moving Average Convergence Divergence): This consists of three com

The Awesome Cross Trend Signal Indicator is a powerful tool designed to assist traders in making informed decisions in the financial markets. This advanced indicator leverages cutting-edge algorithms and technical analysis to identify potential entry points with high accuracy.
Features: 1. Precision Entry Points: The indicator generates precise arrow signals on the chart, highlighting potential entry points for various trading strategies.
2. Trend Identification: By analyzing price mov
DYJのトレンドが逆転したのは、パニック売りで価格が大幅に下落した後、市場の底部で高値に達したことが多い。
この指標の低い値は、通常、大皿の上部と盤整中の長時間の横皿段階に現れる。
DYJ AtrTrendReversalは、他の変動指標と同じ原則に基づいて説明することができる。
この指標に基づく予測原理は、指標値が高いほど、
トレンドが変化する確率が高いほど 指標値が低いほど、トレンドの移動は弱くなります。 指標にATRトレンド線が表示されます。
インジケータは現在のろうそくに矢印を表示して、すぐに倉庫を開けることができます。 最大利益トレンド線を表示します。
反対のクローズトレンド線を表示します。 インジケータは開倉点と閉倉点の接続線のみを表示することもできます。
入り口と出口をよりよく見ることができます
統計的利益の合計を表示します。
Input
InpLossKeyValue = 2 -- Key value for Loss ATRPeriods = 14 -- ATR periods InpSimulatedVol

The term "EA Slope of Moving Average" likely refers to a concept related to trading and technical analysis, particularly in the context of using Expert Advisors (EAs) in trading platforms like MetaTrader. Here's an explanation of each part of the term: EA (Expert Advisor) : An EA is a software program used in MetaTrader and other trading platforms to automate trading strategies. Traders can create or purchase EAs to execute trades based on predefined rules, algorithms, or indicators. Slope : In

xTrendでトレンドを一目瞭然に! メリット ・ トレンドが一目瞭然:違う色と違う太さの上昇線、下降線、レンジ線が互いに繋がって指定された過去一定期間(Barの数)から現在までの全体的なトレンドが目立ちに表示されて裁量トレードを速やかに実現できる! ・Pipsが表示可能:そのトレンド線がどれほど変化したかはPipsの表示ですぐに明らかになる。 ・設定簡単:表示期間、各線の色と太さ、Pips表示、それだけの設定。もデフォルトの値は最適ですので 設定なしでもぜんぜんOK!アルゴリズムに関する難しいパラメターは一切なしので全てアルゴリズムに任せて良い! ・独自のアルゴリズム:長い年月に磨いた世界唯一無二のアルゴリズム、トレンド判断の正確率抜群! ・任意の時間足に適用 ・任意の銘柄に適用 ・任意のFX会社 に適用 ・MT4版・MT5版両方対応 ・多言語対応

The KT 4 Time Frame Trend is an invaluable forex indicator for traders seeking to identify the trend direction across 4-time frames accurately. This innovative indicator allows users to simultaneously observe and analyze price trends across four different timeframes. Whether you're a beginner or an experienced trader, this tool offers an enhanced understanding of trend dynamics, leading to improved trading strategies on your trading platform. The capability to concurrently monitor multiple timef

According to my 18+ years of trading experience, it is too naive to believe that you will get rich by buying a junk EA and let it run automatically without any fundamental knowledge in investment. For those who want to be serious about investing they should buy this EA and train themselves as professional traders with appropriate minimal intervention to the EA. User friendly Interface. On panel fat finger protection. High speed for sending manual orders. Auto follow up for manual orders pla

User friendly Interface. On panel fat finger protection. High speed for sending manual orders. Auto follow up for manual orders placed by the panel. Highly customized parameters for automated or manual buy/sell orders. Customized money management system. Advanced users can choose their buy/sell decision according to their views and leave the rest to the EA to follow up their initial decisions. Beginners can fully rely on the built-in technology to make transaction decisions. Users can limi

User friendly Interface. On panel fat finger protection. High speed for sending manual orders. Auto follow up for manual orders placed by the panel. Highly customized parameters for automated or manual buy/sell orders. Customized money management system. Advanced users can choose their buy/sell decision according to their views and leave the rest to the EA to follow up their initial decisions. Beginners can fully rely on the built-in technology to make transaction decisions. Users can limi

The KT Trades Info indicator is useful for traders wishing to stay informed about their trading performance. This indicator provides real-time updates on the profitability of all ongoing and completed trades, enabling traders to make well-informed decisions. By incorporating key financial metrics, it provides a comprehensive picture of a trader's financial status at a glance. This means traders can monitor their performance with increased accuracy and precision, facilitating better risk manageme

Certainly! An EA (Expert Advisor) Heiken Ashi strategy is a trading algorithm designed to automate trading decisions based on Heiken Ashi candlestick patterns. Heiken Ashi is a type of candlestick charting technique that aims to filter out noise and provide a smoother representation of price trends. It does this by averaging price data over a specified period. Here's a simple outline of how you can create an EA Heiken Ashi strategy: Heiken Ashi Calculation : You need to implement the Heiken Ashi

UP MT4 is a smart grid trading system that leverages the power of momentum, trend trading & breakouts to analyze large amounts of market data to detect high-probability trading opportunities to exploit.
Supported currency pairs: EURUSD, GBPUSD, USDJPY, GBPJPY, NZDUSD
Timeframe: H1 When Trying The Demo: If you are looking to try out a certain set file please direct message me and I will send you one based on the account size you would need Features -------------- Multiple currency pairs sup

This robot is designed to trade based on supply and demand, It trades currency pairs. Use this robot on the m1 and m5 timeframe. avoid using the robot during news as this can have a negative affect on the performance of this EA. This robot uses the alligator indicator with the RSI indicator to get its entries. Its aim is to catch the lowest and highest points of a market trend during the specific time period.
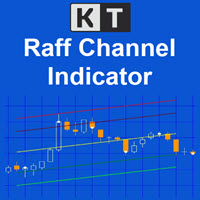
The KT Raff Channel is an enhanced and refined iteration of the original Raff channel concept pioneered by Gilbert Raff in 1996. This indicator builds upon Raff's initial work, incorporating modifications and advancements to provide traders with a more sophisticated and powerful tool. Gilbert Raff, a renowned name in the field of financial market analysis, is the developer of the Raff Regression Channel. This technical tool is designed for discerning and validating possible market price trends.
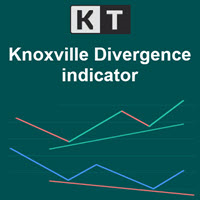
The KT Knoxville Divergence is a powerful tool that reveals unique price divergences in a financial instrument by employing a carefully crafted combination of the Relative Strength Index (RSI) and a momentum oscillator. This indicator effectively captures subtle variations in market dynamics and assists traders in identifying potentially profitable trading opportunities with greater precision. Knoxville Divergences is a type of divergence in trading developed by Rob Booker. Divergence in tradin

FOREXTROIDS USES THE TREND WAVE INDICATOR AND IT CAN IDENTIFY THE BEGINNING AND THE END OF A NEW WAVE TREND MOVEMENT.
AS AN OSCILLATOR, THE INDICATOR IDENTIFIES THE OVERBOUGHT AND OVERSOLD ZONES.
IT WORKS GREAT TO CATCH THE SHORT TERM PRICE REVERSALS AND USES A MARTINGALE STRATEGY TO CLOSE ALL TRADES IN PROFIT.
USE DEFAULT SETTINGS ON H1 OR HIGHER TIME FRAME ON ANY PAIR FOR MORE ACCURATE TRADES
WHY THIS EA :
Smart entries calculated by 4 great strategies The EA can be run on even a $2

SETFILE FOR XAUUSD : https://drive.google.com/file/d/1Rv139d1wc5lnDcRv6k7M_A6roSMqz2U9/view?usp=sharing
**Expert Advisor Name:** FIREBALL EXPERT
**Description:**
FIREBALL EXPERT is a sophisticated and highly specialized trading tool designed for the dynamic world of financial markets. This Expert Advisor (EA) has been meticulously crafted to cater to traders who seek to harness the power of market trends while effectively managing volatility. Its primary focus is on trend trading, and it
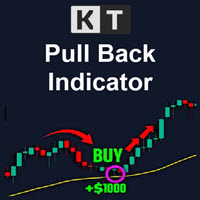
The KT Pull Back Arrows shows the pull back arrows using the RSI (Relative Strength Index) to identify suitable pull-back entry areas within the overbought and oversold zones. The indicator effectively pinpoints favorable moments for initiating pull-back trades by leveraging these RSI thresholds. Trend trading is often considered the most profitable strategy in the Forex market. It is the equivalent of riding the wave, going with the flow, and capitalizing on market momentum. However, timing is

Introducing Emerald Dragon: Your Gateway to Trading Success Are you tired of navigating the treacherous waters of the forex markets, always on the lookout for opportunities? The trading world can be relentless, leaving you yearning for a reliable companion. Look no further. Allow me to introduce you to Emerald Dragon, a formidable trading algorithm designed to extinguish your trading woes and ignite your success. Emerald Dragon is not just another algorithm; it's your trusty partner in the dyna

This is the Full Version, to get the free version please contact me.
The free version works on “AUDNZD” and “XAUUSD” charts.
All symbols and time frames scanner
Head and Shoulder
One of the most popular Price Action patterns is the Head and Shoulders pattern. The pattern has three local tops that resemble the left shoulder, head, and right shoulder. The head and shoulders chart pattern appears in all kinds of markets, including Forex, cryptocurrency, commodities, stocks, and bonds. The

Introducing Austin Bat: Your Key to Profitable Forex Trading! Are you ready to soar to new heights in the forex market? Look no further than Austin Bat—an advanced automated trading system that combines cutting-edge technology with expert insights to maximize your trading potential.
At the heart of Austin Bat lies a powerful strategy based on the cross of fast and slow custom moving averages, meticulously crafted using Jurik's renowned expertise in forex analysis. Jurik moving averages are cel
KT Momentum Histogram provides traders with a visualization of the momentum of a particular asset, which helps determine the strength and potential direction of a market trend. The indicator calculates and operates based on momentum in trading.
What Exactly is a Momentum Histogram
Momentum is the rate of acceleration of an asset's price or volume. In other words, it measures the speed at which the price of an asset is moving in a particular direction over a specific period of time. Positive
The KT Buy Sell Volume is a powerful tool traders use to gauge the strength and weakness of price movements. In the whirlwind of the Forex market, traders aim to identify and ride the waves of a bullish or bearish trend that exudes strength and potential. However, recognizing these trends necessitates a method, metric, or indicator to quantify their strength. One crucial factor that traders examine for this purpose is volume. Volume refers to the number of shares or contracts traded in a securit

Microlab Exp is a trending analytical bot. An expert system based on geometric virtual pattern algorithms specially designed for time series.
For this version of the Expert Advisor to work, there is no need to download any indicators or additional products, the bot is an independent finished product.
Microlab Exp is a tool for trading in the foreign exchange market.
The minimum recommendation is $1000. While the recommended minimum deposit is between $1,000 and $10,000 for one currenc

VANGLUTIO USES THE TREND WAVE INDICATOR AND IT CAN IDENTIFY THE BEGINNING AND THE END OF A NEW WAVE TREND MOVEMENT.
AS AN OSCILLATOR, THE INDICATOR IDENTIFIES THE OVERBOUGHT AND OVERSOLD ZONES.
IT WORKS GREAT TO CATCH THE SHORT TERM PRICE REVERSALS AND USES A MARTINGALE STRATEGY TO CLOSE ALL TRADES IN PROFIT.
USE DEFAULT SETTINGS ON H1 OR HIGHER TIME FRAME ON ANY PAIR FOR MORE ACCURATE TRADES
WHY THIS EA :
Smart entries calculated by 5 great strategies The EA can be run on even a $200
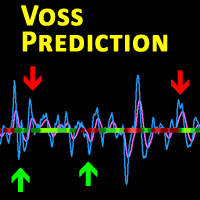
Description This is a modified version of the popular Voss Predictive Filter - A peek into the future by Dr. John Ehlers. It contains 2 lines - V-Line (blue) and F-Line (red), a trend indication and BUY/SELL signals.
Usage Buy Green dots indicate an up trend. Open a BUY position if the V-Line crosses the F-Line from below and an up trend is signaled (green dots) Close BUY position if V-Lines falls beneath F-Line again Sell Red dots indicate a down trend Open a sell position if V-Line fall

Attraverso l'indicatore Savius Zone potrai finalmente: Definire delle zone oggettive da attenzionare Ridurre la discrezionalità Filtrare i tuoi pattern operativi Avvalerti di un metodo comprovato Qui di seguito alcune funzioni dell'indicatore Savius Zone: Zone Buy & Sell L’indicatore fornisce delle zone buy e sell ogni giorno dopo l’apertura del mercato cash sui seguenti mercati: DAX, S&P500, Nasdaq, Russel2000, Dow Jones
Occasioni giornaliere Savius Zone fornisce occasioni di trading tutti i

DISCLAIMER : THIS EXPERT ADVISOR IS BUILT DEPEND ON NEW AND ADVANCE PRICEACTION. DONT BACK TEST IT IN THE TIME PERIOD BEFORE 2021 . Introducing our MT4 EA:
Designed with advanced algorithms and utilizing deep learning technology, our Expert Advisor (EA) is crafted to assist you in the intricate world of forex trading. The system analyzes market behaviors and conducts transactions based on specific criteria, empowering you to engage with market trends more effectively. With the backing

The EA Fractals Alligator strategy is a trading strategy popularized by Bill Williams, a famous trader and author of the book "Trading Chaos." It is a part of his broader trading system called the "Chaos Theory" and is based on the use of three moving averages, which he refers to as the "Alligator." The Alligator consists of the following three moving averages: Alligator's Jaw (Blue Line): This is a 13-period Smoothed Moving Average (SMA) moved 8 bars into the future. Alligator's Teeth (Red Line

The "REVERSAL" indicator is a pointer indicator without redrawing and delay. The "REVERSAL" indicator shows the best trend entry points on the chart. It is better to use it in tandem with other trend indicators as a filter. The indicator shows good results on all timeframes. The signal is generated after the candle closes and appears as blue and red arrows. If you reduce the amplitude, then you can trade in the style of scalping

VANDORA FX USES THE TREND WAVE INDICATOR AND IT CAN IDENTIFY THE BEGINNING AND THE END OF A NEW WAVE TREND MOVEMENT.
AS AN OSCILLATOR, THE INDICATOR IDENTIFIES THE OVERBOUGHT AND OVERSOLD ZONES.
IT WORKS GREAT TO CATCH THE SHORT TERM PRICE REVERSALS AND USES A MARTINGALE STRATEGY TO CLOSE ALL TRADES IN PROFIT.
USE DEFAULT SETTINGS ON H1 OR HIGHER TIME FRAME ON ANY PAIR FOR MORE ACCURATE TRADES
WHY THIS EA :
Smart entries calculated by 5 great strategies The EA can be run on even a $20

Certainly, I can explain a trading strategy using the EA of Commodity Channel Index (CCI) indicator. The CCI is a popular technical analysis tool used by traders to identify potential trend reversals, overbought, or oversold conditions in a market. Here's a basic CCI indicator strategy: Strategy Overview: The CCI indicator oscillates around a zero line, providing signals based on its position relative to this line. This strategy involves using CCI to identify potential trend reversals and overbo

In the ever-evolving world of Forex trading, understanding the different trading sessions is paramount to making informed trading decisions. Each trading session brings its own unique characteristics, opportunities, and challenges, and recognizing these can greatly enhance your trading strategies. Whether you're a novice or a seasoned trader, the Forex market's three main trading sessions – Asian, London, and New York – are crucial milestones that dictate market behavior and potential trade set

GOLD /USD (XAU/USD) Travel 22 EA is a Result of 5 Years of (Experience, Testing and Developing). Also This EA Based on Special Coding Algorithm of Take Profit and Treating Trades. Combine of a Custom Indicators is used to Take Trades at Strong Points Only. Trading is With Trend and Only Safe Positions.
Currency pair : GOLD/USD (XAU/USD) H1 OR M1 Timeframe
If you want a few but guaranteed deals use H1 Timeframe.
If you want more deals during the day use M1 Timeframe.
If you see u

Certainly! An EA (Expert Advisor) EMA (Exponential Moving Average) Trend Following Crossover strategy is a popular algorithm used in trading to identify trends in financial markets, such as stocks, forex, or cryptocurrencies. This strategy uses two Exponential Moving Averages with different periods to generate buy and sell signals based on their crossovers. Here's how it works: Exponential Moving Averages (EMAs): An Exponential Moving Average gives more weight to recent price data, making it mor
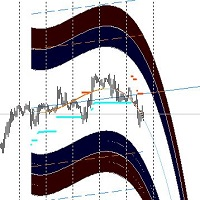
The forex market, like nature, moves in cycles — oscillating between peaks and troughs, bullish runs and bearish retreats. But what if you had a compass to chart these cycles and anticipate every turn? Austin Market Levels Indicator is crafted to be that compass, designed meticulously to decode market cycles and pinpoint profit opportunities.
---
Mastering Market Cycles
The secret to consistent forex trading success often lies in understanding the underlying patterns. Austin Market

The Trends Trg indicator determines the prevailing trend. They help to analyze the market at the selected time interval. Easy to set up and works on all pairs and all time frames. Trend indicators make it possible to classify the direction of price movement by determining its strength. Solving this problem helps investors enter the market on time and get a good return.
It is extremely important for any trader to correctly determine the direction and strength of the trend movement. Unfortunate

The Cyber Trend indicator analyzes the price action and if there is a temporary weakness in the trend, you can notice it from the indicator readings, as in the case of a pronounced change in trend direction. Entering the market is not difficult, but staying in it is much more difficult. Keeping up with the trend will become much easier with the Cyber Trend indicator! This indicator allows you to analyze historical data and, based on them, display instructions to the trader for further actions.

This "EA EMA High & Low Price" refers to the concept of using Exponential Moving Averages (EMA) in the context of tracking the highest (high) and lowest (low) prices of a financial instrument, such as a stock, currency pair, or commodity. The Exponential Moving Average is a widely used technical analysis tool that helps traders and analysts identify trends and potential reversals in price movements. In this context, the "EMA High & Low Price" approach involves calculating the Exponential Moving

This indicator will give you entries as result of scalping strategy that will be applied on 14 symbols in same time and you are able to be notified with this entries
Note : This indicator for scalping on 5 minutes timeframe only .
How to use it :
1-Open chart and adjust settings (edit symbols names as your platform names , activate the alert system if you need it . 2-Wait for any signal you have it from this scanner you will have it as alert and as notification and you will see it on bo
Introducing the ON Trade Melad Pattern Indicator: Enhance Your Trading Strategy with Breakout Patterns
Discover the power of the ON Trade Melad Pattern Indicator—an intuitive tool designed to elevate your trading decisions by detecting and highlighting breakout patterns on your charts. This indicator is your key to identifying crucial breakout points and potential trend shifts with simplicity and precision.
Key Features:
Breakout Pattern Detection: The ON Trade Melad Pattern Indicator foc

Unlock Hidden Insights with the Numerokh Indicator: Your Numerology-Based Support and Resistance Tool Introducing the Numerokh indicator, a revolutionary tool that brings the mystical world of numerology into the realm of trading. Imagine having the power to identify key support and resistance levels on your charts using the age-old wisdom of numerology. This indicator takes trading to a new dimension, offering you a unique way to analyze price movements and make informed trading decisions. Key

The SuperTrend AI indicator is a novel take on bridging the gap between the K-means clustering machine learning method & technical indicators. In this case, we apply K-Means clustering to the famous SuperTrend indicator. USAGE Users can interpret the SuperTrend AI trailing stop similarly to the regular SuperTrend indicator. Using higher minimum/maximum factors will return longer-term signals. (image 1) The displayed performance metrics displayed on each signal allow for a deeper interpretat

Introducing the MT4 Immortal Day Trader – Your Optimal Trading Solution Our Expert Advisor stands apart by adhering to a disciplined approach. This EA is NOT a grid, martingale strategies and unrealistic/Unreliable gains.
Experience a new level of trading precision and reliability with our Expert Advisor meticulously designed for MetaTrader 4. Key Features: Singular Daily Trade: Crafted to execute at most one trade per symbol each day, our Expert Advisor ensures a judicious trading frequency
The KT MTF Order Blocks automatically plots the institutional order blocks by using a unique blend of price action with comprehensive multi-timeframe analysis. This advanced approach reveals the area of price reversal, originating from significant buy and sell orders strategically placed by major market players.
Features
Algorithmic Precision: A refined and distinctive order block algorithm meticulously crafted to precisely identify the most pivotal order blocks, often triggering price reve

Discover Prozones IntraWeek MT4: Elevate Your Trading Success with Precision Are you tired of sifting through market noise in search of profitable trades? Look no further than Prozones IntraWeek MT4 – your ultimate solution for consistent trading success in the fast-paced world of intraday trading. Crafted with advanced algorithms and years of market expertise, this indicator empowers traders of all levels to make informed decisions with confidence. Key Features: Pinpoint Precision in Trend Anal
MetaTraderマーケットは、履歴データを使ったテストと最適化のための無料のデモ自動売買ロボットをダウンロードできる唯一のストアです。
アプリ概要と他のカスタマーからのレビューをご覧になり、ターミナルにダウンロードし、購入する前に自動売買ロボットをテストしてください。完全に無料でアプリをテストできるのはMetaTraderマーケットだけです。
取引の機会を逃しています。
- 無料取引アプリ
- 8千を超えるシグナルをコピー
- 金融ニュースで金融マーケットを探索
新規登録
ログイン