スピーディに自動売買ロボットを注文する方法を見る
注文を投稿するまたは受注する前にルールをご覧ください。
MQL5およびMQL4で自動売買ロボットを注文する方法
ロボットを注文するにはサンプル要件仕様をご覧ください
カテゴリでの新規注文:
30+ USD
指定
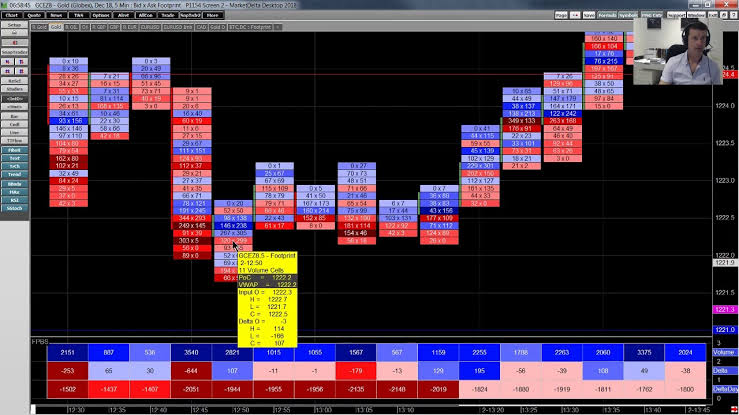
I need a developer to creat a simple bid x ask footprint indicator, showing by price level the complete sell and buy transactions, highligthing by color de dominant side, during a specific time frame (M1, M5, M30, ... D, M). At the botton should present the total volume, the delta, and the accumulative delta showing by color the do,inant size. The booton data foolow,the footprint chart just above under the respective interval.
応答済み
1
評価
プロジェクト
485
40%
仲裁
82
11%
/
63%
期限切れ
77
16%
暇
パブリッシュした人: 1 code
プロジェクト情報
予算
30 - 150 USD