类别中的新订单:
30+ USD
指定
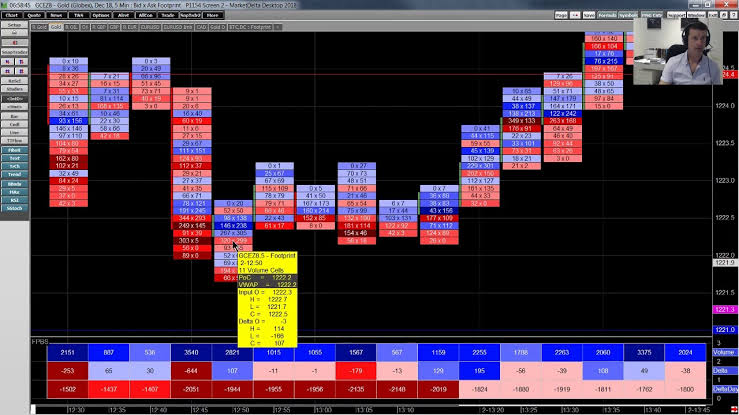
I need a developer to creat a simple bid x ask footprint indicator, showing by price level the complete sell and buy transactions, highligthing by color de dominant side, during a specific time frame (M1, M5, M30, ... D, M). At the botton should present the total volume, the delta, and the accumulative delta showing by color the do,inant size. The booton data foolow,the footprint chart just above under the respective interval.
反馈
1
等级
项目
485
40%
仲裁
82
11%
/
63%
逾期
77
16%
空闲
发布者: 1 代码
项目信息
预算
30 - 150 USD