 すべての注文
 ルール
スピーディに自動売買ロボットを注文する方法を見る
注文を投稿するまたは受注する前にルールをご覧ください。
MQL5およびMQL4で自動売買ロボットを注文する方法
ロボットを注文するにはサンプル要件仕様をご覧ください
カテゴリでの新規注文:
40 - 200 USD
30+ USD
30 - 2000 USD
30 - 60 USD
30+ USD
仕事が完了した
実行時間1 日

開発者からのフィードバック
A solution-oriented person and expresses requirements clearly. I was pleased to do business together.
依頼者からのフィードバック
Very good developer, always quick response, very much clear with concepts and above all very economical, will LOVE to work again
指定
I had converted below tradingview indicator using chatGPT AI
But there are few errors in mq4,
I want coder must
1. Fix errors
2. Must match mq4 indicator results with tradingview indicator results
I am also attaching screenshot of tradingview indicator
//@version=5
indicator("Volumatic Variable Index Dynamic Average [BigBeluga]", "Volumatic VIDYA [BigBeluga]",
overlay = true, max_lines_count = 500, max_labels_count = 500)
// INPUTS ――――――――――――――――――――――――――――――――――――――――――――――――――――――――――――――――――――――――――――――――――――――――――――――――――――――――{
// Input parameters for length, momentum, and source data
int vidya_length = input.int(10, "VIDYA Length") // Length of the VIDYA calculation
int vidya_momentum = input.int(20, "VIDYA Momentum") // Momentum length for VIDYA
float band_distance = input.float(2, "Distance factor for upper/lower bands", step = 0.1) // Distance factor for upper/lower bands
// Define pivot parameters
int pivot_left_bars = 3 // Left side pivot bars
int pivot_right_bars = pivot_left_bars // Right side pivot bars
float source = input.source(close, "Source") // Source for VIDYA calculation
// Define colors for up and down trends
color up_trend_color = input(#17dfad, "+", group = "Color", inline = "c") // Color for uptrend
color down_trend_color = input(#dd326b, "-", group = "Color", inline = "c") // Color for downtrend
bool shadow = input.bool(true, "Shadow", group = "Color", inline = "c")
// Initialize variables for line, volume, and trend state
var line pivot_line = na // Variable for storing line references
var float volume_value = na // Variable for storing volume data
float smoothed_value = na // Smoothing variable for VIDYA trend levels
var bool is_trend_up = na // Boolean variable for tracking trend direction
// Initialize arrays for storing line and volume information
var array<line> liquidity_lines_low = array.new<line>(500) // Array for storing lines for lows
var array<line> liquidity_lines_high = array.new<line>(500) // Array for storing lines for highs
var float up_trend_volume = na // Volume accumulated during uptrend
var float down_trend_volume = na // Volume accumulated during downtrend
// }
// FUNCTIONS―――――――――――――――――――――――――――――――――――――――――――――――――――――――――――――――――――――――――――――――――――――――――――――――――――――――――――――{
// Define VIDYA (Variable Index Dynamic Average) function
vidya_calc(src, vidya_length, vidya_momentum) =>
float momentum = ta.change(src)
float sum_pos_momentum = math.sum((momentum >= 0) ? momentum : 0.0, vidya_momentum)
float sum_neg_momentum = math.sum((momentum >= 0) ? 0.0 : -momentum, vidya_momentum)
float abs_cmo = math.abs(100 * (sum_pos_momentum - sum_neg_momentum) / (sum_pos_momentum + sum_neg_momentum))
float alpha = 2 / (vidya_length + 1)
var float vidya_value = 0.0
vidya_value := alpha * abs_cmo / 100 * src + (1 - alpha * abs_cmo / 100) * nz(vidya_value[1])
ta.sma(vidya_value, 15)
// Method to extend lines and add labels for liquidity levels
method extend_liquidity_lines(array<line> line_array, float price_level, bool is_cross, volume_val)=>
if line_array.size() > 0 and last_bar_index - bar_index < 5000
for i = 0 to line_array.size()-1
if i < line_array.size()
line liquidity_line = line_array.get(i)
float current_line_level = line.get_y2(liquidity_line)
bool price_cross = is_cross
? price_level < current_line_level and price_level[1] >= current_line_level
: price_level > current_line_level and price_level[1] <= current_line_level
bool is_short_line = bar_index - line.get_x1(liquidity_line) < 50
if price_cross and is_short_line
line.set_x2(liquidity_line, bar_index)
line_array.remove(i)
// Add volume label to the liquidity zone
label.new(bar_index-1, price_level[1],
str.tostring(volume_val, format.volume),
color = color.rgb(0, 0, 0, 99),
style = is_cross ? label.style_label_lower_left : label.style_label_upper_left,
textcolor = chart.fg_color,
size = size.small)
// Add a circle label to represent liquidity zone
label.new(bar_index-1, price_level[1],
text = "◉",
color = #00000003,
textcolor = is_cross ? down_trend_color : up_trend_color,
style = label.style_label_center,
size = size.normal)
// }
// CALCULATIONS――――――――――――――――――――――――――――――――――――――――――――――――――――――――――――――――――――――――――――――――――――――――――――――{
// Calculate the Average True Range (ATR)
float atr_value = ta.atr(200) // ATR calculation with length of 200
// Calculate the VIDYA (Variable Index Dynamic Average)
vidya_value = vidya_calc(source, vidya_length, vidya_momentum)
// Calculate upper and lower bands based on VIDYA and ATR
float upper_band = vidya_value + atr_value * band_distance
float lower_band = vidya_value - atr_value * band_distance
// Detect trend direction using crossovers of source with bands
if ta.crossover(source, upper_band)
is_trend_up := true
if ta.crossunder(source, lower_band)
is_trend_up := false
// Set trend-based smoothing variable
if is_trend_up
smoothed_value := lower_band
if not is_trend_up
smoothed_value := upper_band
if ta.change(is_trend_up)
smoothed_value := na
// Calculate pivot highs and lows for price action
float pivot_high = ta.pivothigh(pivot_left_bars, pivot_right_bars)
float pivot_low = ta.pivotlow(close, pivot_left_bars, pivot_right_bars)
// Create and store lines for pivot lows (support zones)
if low[pivot_right_bars] > smoothed_value and pivot_low
pivot_line := line.new(
bar_index[pivot_right_bars],
low[pivot_right_bars],
bar_index[pivot_right_bars]+5,
low[pivot_right_bars],
color = color.new(up_trend_color, 50)
)
liquidity_lines_low.push(pivot_line)
volume_value := math.sum(volume, pivot_right_bars + pivot_left_bars) / (pivot_right_bars + pivot_left_bars)
// Create and store lines for pivot highs (resistance zones)
if high[pivot_right_bars] < smoothed_value and pivot_high
pivot_line := line.new(
bar_index[pivot_right_bars],
high[pivot_right_bars],
bar_index[pivot_right_bars]+5,
high[pivot_right_bars],
color = color.new(down_trend_color, 50)
)
liquidity_lines_high.push(pivot_line)
volume_value := math.sum(-volume, pivot_right_bars + pivot_left_bars) / (pivot_right_bars + pivot_left_bars)
// Extend lines to track price movements
liquidity_lines_high.extend_liquidity_lines(smoothed_value, true, volume_value)
liquidity_lines_low.extend_liquidity_lines(smoothed_value, false, volume_value)
// Detect changes in the trend direction
bool trend_cross_up = not is_trend_up[1] and is_trend_up
bool trend_cross_down = not is_trend_up and is_trend_up[1]
// Reset volume counters when trend changes
if ta.change(trend_cross_up) or ta.change(trend_cross_down)
up_trend_volume := 0
down_trend_volume := 0
// Accumulate volume during trends
if not(ta.change(trend_cross_up) or ta.change(trend_cross_down))
up_trend_volume += (close > open ? volume : 0)
down_trend_volume += (close < open ? volume : 0)
// Calculate average volume
float avg_volume_delta = (up_trend_volume + down_trend_volume) / 2
// Determine the color of the trend
color trend_color = is_trend_up ? up_trend_color
: not is_trend_up ? down_trend_color
: chart.fg_color
// Calculate delta volume percentage
string delta_volume =
str.tostring(((up_trend_volume - down_trend_volume) / avg_volume_delta) * 100, format.percent) == "NaN%"
? "0%"
: str.tostring(((up_trend_volume - down_trend_volume) / avg_volume_delta) * 100, format.percent)
// }
// PLOT ――――――――――――――――――――――――――――――――――――――――――――――――――――――――――――――――――――――――――――――――――――――――――――――――――――――――――――{
// Display labels for volume and trend statistics on the last bar
if barstate.islast
label.delete(
label.new(bar_index, smoothed_value,
"Buy: " + str.tostring(up_trend_volume, format.volume)
+ "\n Sell: " + str.tostring(down_trend_volume, format.volume)
+ "\nDelta Volume: " + delta_volume,
color = color.new(trend_color, 90),
style = is_trend_up ? label.style_label_upper_left : label.style_label_lower_left,
textcolor = chart.fg_color
)[1])
label.delete(label.new(bar_index, smoothed_value,
text = "✪",
color = #00000003,
textcolor = trend_color,
style = label.style_label_center,
size = size.large)[1])
// Plot the VIDYA trend line
p1 = plot(smoothed_value, color = trend_color, linewidth = 2, style = plot.style_linebr)
p2 = plot(hl2, display = display.none)
// Fill between the plot and the VIDYA line
fill(p1, p2, smoothed_value, hl2, color.new(trend_color, shadow ? 80 : 100), na)
// Plot trend change markers (up and down arrows)
plotshape(
series = trend_cross_up[1] ? smoothed_value[0] : na,
title = "Trend Up",
style = shape.labelup,
location = location.absolute,
color = color.new(up_trend_color, 50),
text = "▲",
textcolor = chart.fg_color
)
plotshape(
series = trend_cross_down[1] ? smoothed_value[0] : na,
title = "Trend Down",
style = shape.labeldown,
location = location.absolute,
color = color.new(down_trend_color, 50),
text = "▼",
textcolor = chart.fg_color
)
// }
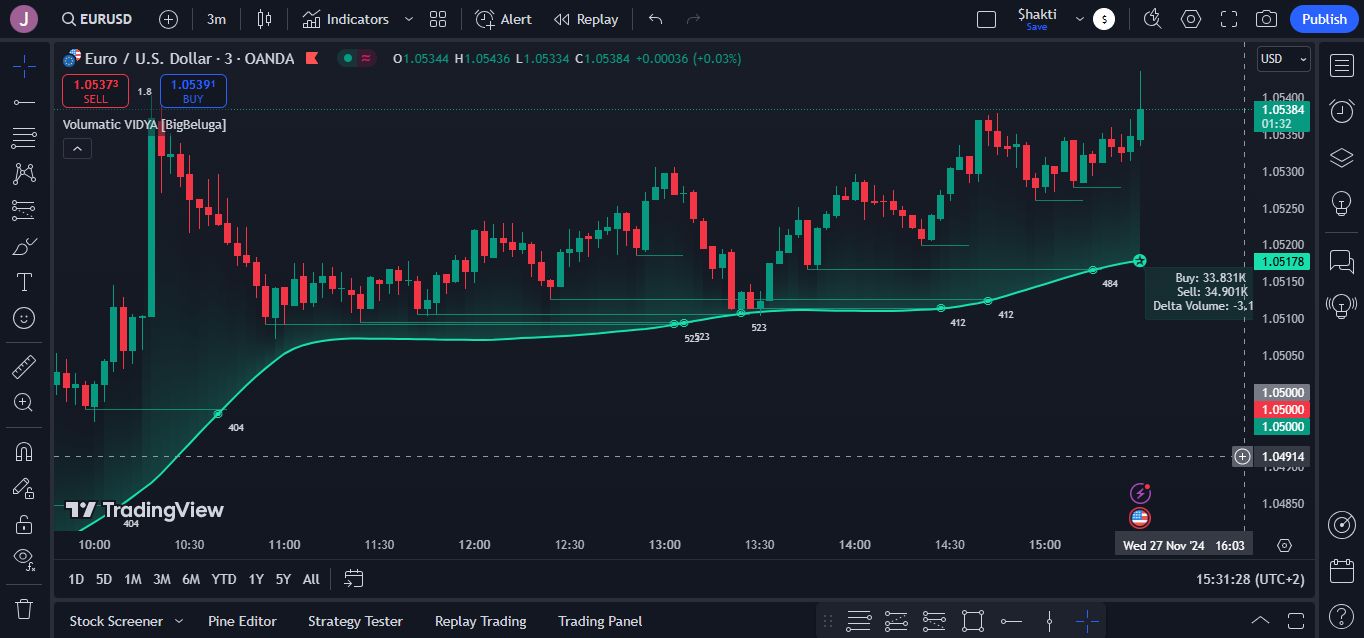
応答済み
1
評価
プロジェクト
63
24%
仲裁
10
30%
/
50%
期限切れ
10
16%
暇
2
評価
プロジェクト
1
0%
仲裁
0
期限切れ
0
暇
3
評価
プロジェクト
33
27%
仲裁
20
10%
/
50%
期限切れ
11
33%
暇
4
評価
プロジェクト
8
13%
仲裁
6
33%
/
33%
期限切れ
0
暇
類似した注文
Forex Hunter MT5
30 - 250 USD
ثبت طلبك في مواصفات البوت الثاني كذا: الجودة والأمان أهم من السعر، وما يدخل إلا إذا الفرصة قوية، مع حماية عند الخسائر وانقطاع الاتصال وارتفاع السبريد، وتشغيل مستمر على سيرفر، مع اختبارات إلزامية قبل أي تشغيل حقيقي. بهذه الصيغة يصير يشتغل وأنت مرتاح بالِك، لكنه يوقف تلقائيًا وقت عطلة السوق أو أي خلل. بس أكون واضح معك: ما في بوت يضمن عدم الخسارة، خصوصًا بالمضاربات السريعة، هدفنا نقلل المخاطر ونمنع الخسائر غير المنضبطة
My MQL5 Expert Advisor wins most trades with small profits, then suddenly takes one large loss that wipes out weeks of gains. This is the "picking up pennies in front of a steamroller" pattern. Required fix: Find the exact cause of the large losses in the code. Cap the loss on every trade with a fixed stop loss (no martingale or averaging down). Stop trading in dangerous conditions (high volatility, strong trends
//+------------------------------------------------------------------+ //| Durban Gold Hunter.mq5 (v3.00) | //| Multi-pair EA for MetaTrader 5 (Razor Markets, XM). | //| Strategy modules (each can be switched on/off): | //| 1. EMA crossover | //| 2. 714 method (EMA 7 + RSI 14) | //| 3. CRT (Candle Range Theory: range sweep and close back inside)| //| 4. Trend line breakout (auto-drawn from swing highs/lows) | //| 5
I want NinjaTrader to behave like Tradovate. When I hover over a candlestick, the cursor should automatically snap to the center of that candle across all open charts. For example, when I hover over a 30-minute candle, the cursor should align with the center of the corresponding candles on the 15-minute and other chart timeframes. I also want vertical lines drawn on one chart to automatically align with the center of
Hello, I already have an MT5 Expert Advisor for XAUUSD based on Fibonacci, market structure, BOS/CHoCH and swing trading. I need an experienced MQL5 developer to modify my existing EA, not develop a completely new one. Required modifications: Partial take-profit system with multiple TP levels. Keep profit targets conservative, using Fibonacci extension levels. Stop-loss placement beyond liquidity areas, not exactly
Hello, I am an independent developer selling an Expert Advisor (EA) on the MQL5 Market. I am looking for an experienced Forex affiliate marketing company or professional marketer to promote my existing MT5 trading robot to customers worldwide. My proposed partnership offers a 35% commission per verified sale, with the possibility of a long-term collaboration. I would like to know: Do you promote third-party MT5
The objective is to develop a custom technical indicator for MetaTrader 5 (MQL5) that replicates the exact visual structure, inputs, and features of the "AYN-Indicator by Snurk" as shown in the provided screenshot. The indicator must analyze price actions based on a flexible lookback period, plot dynamic trend filters, and render precise Buy/Sell breakout labels without any lagging or repainting
Requirements Specification: Debug & Error Fixing: Review the entire source code of the MQL expert advisor. Identify and fix all logical errors, bugs, and performance issues that cause trades to close prematurely or yield extremely low profits. Strategy Restructuring & Optimization: Fully analyze and optimize the current entry and exit strategy for USDJPY and GBPUSD. Modify, upgrade, or completely rewrite the entry
Winter
500+ USD
I am looking for an MQL5 developer to independently review an existing EA’s execution and position management logic. The review should focus on duplicate orders, trade isolation by symbol and magic number, broker price and volume constraints, error handling, and recovery after a terminal restart. This order is for an audit report. Please do not modify the source or change the trading strategy. For each finding
Title: Fully Automatic MT5 Trading Bot (Expert Advisor) with Risk Management I want a fully automated trading robot (Expert Advisor) for MetaTrader 5, written in MQL5. The bot must automatically analyse market data, identify trading opportunities, execute BUY and SELL orders, manage open positions, and close trades according to predefined rules without requiring manual confirmation for each trade. Requirements
プロジェクト情報
予算
30+ USD
締め切り
最低 2 最高 5 日