 全部订单
全部订单
 规则
规则
类别中的新订单:
50+ USD
40 - 60 USD
90+ USD
90 - 125 USD
工作已完成
执行时间1 一天

客户反馈
Very good developer, always quick response, very much clear with concepts and above all very economical, will LOVE to work again
员工反馈
A solution-oriented person and expresses requirements clearly. I was pleased to do business together.
指定
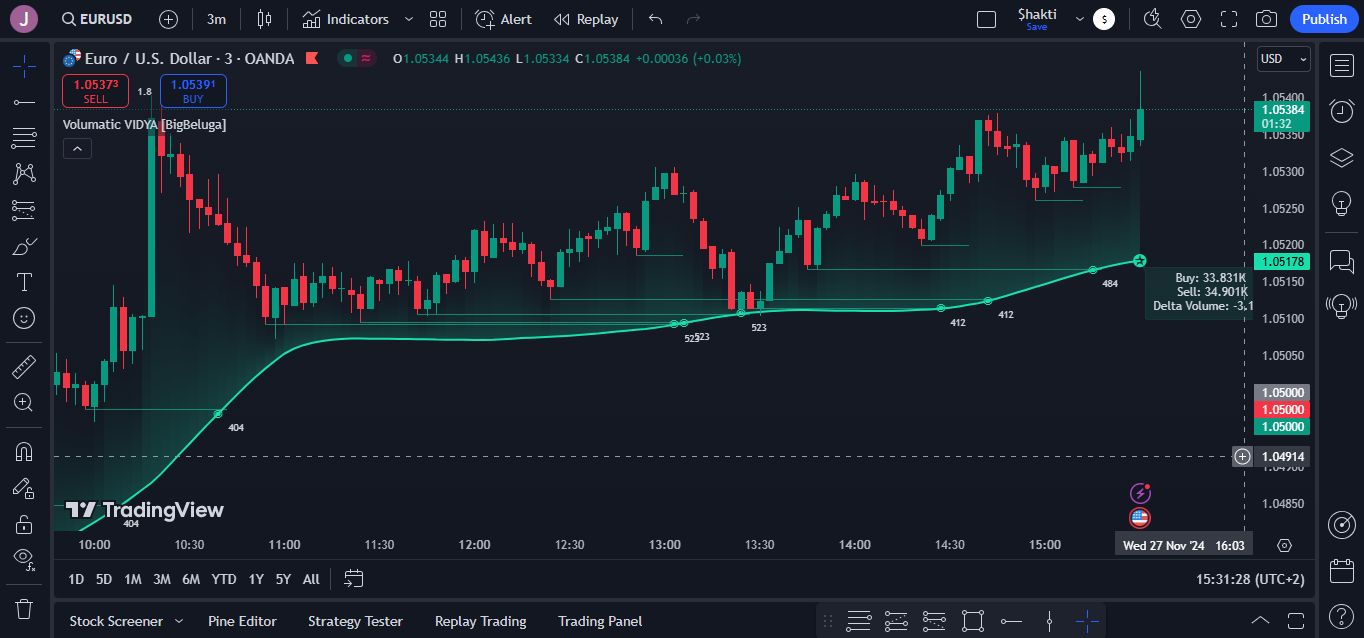
I had converted below tradingview indicator using chatGPT AI
But there are few errors in mq4,
I want coder must
1. Fix errors
2. Must match mq4 indicator results with tradingview indicator results
I am also attaching screenshot of tradingview indicator
//@version=5
indicator("Volumatic Variable Index Dynamic Average [BigBeluga]", "Volumatic VIDYA [BigBeluga]",
overlay = true, max_lines_count = 500, max_labels_count = 500)
// INPUTS ――――――――――――――――――――――――――――――――――――――――――――――――――――――――――――――――――――――――――――――――――――――――――――――――――――――――{
// Input parameters for length, momentum, and source data
int vidya_length = input.int(10, "VIDYA Length") // Length of the VIDYA calculation
int vidya_momentum = input.int(20, "VIDYA Momentum") // Momentum length for VIDYA
float band_distance = input.float(2, "Distance factor for upper/lower bands", step = 0.1) // Distance factor for upper/lower bands
// Define pivot parameters
int pivot_left_bars = 3 // Left side pivot bars
int pivot_right_bars = pivot_left_bars // Right side pivot bars
float source = input.source(close, "Source") // Source for VIDYA calculation
// Define colors for up and down trends
color up_trend_color = input(#17dfad, "+", group = "Color", inline = "c") // Color for uptrend
color down_trend_color = input(#dd326b, "-", group = "Color", inline = "c") // Color for downtrend
bool shadow = input.bool(true, "Shadow", group = "Color", inline = "c")
// Initialize variables for line, volume, and trend state
var line pivot_line = na // Variable for storing line references
var float volume_value = na // Variable for storing volume data
float smoothed_value = na // Smoothing variable for VIDYA trend levels
var bool is_trend_up = na // Boolean variable for tracking trend direction
// Initialize arrays for storing line and volume information
var array<line> liquidity_lines_low = array.new<line>(500) // Array for storing lines for lows
var array<line> liquidity_lines_high = array.new<line>(500) // Array for storing lines for highs
var float up_trend_volume = na // Volume accumulated during uptrend
var float down_trend_volume = na // Volume accumulated during downtrend
// }
// FUNCTIONS―――――――――――――――――――――――――――――――――――――――――――――――――――――――――――――――――――――――――――――――――――――――――――――――――――――――――――――{
// Define VIDYA (Variable Index Dynamic Average) function
vidya_calc(src, vidya_length, vidya_momentum) =>
float momentum = ta.change(src)
float sum_pos_momentum = math.sum((momentum >= 0) ? momentum : 0.0, vidya_momentum)
float sum_neg_momentum = math.sum((momentum >= 0) ? 0.0 : -momentum, vidya_momentum)
float abs_cmo = math.abs(100 * (sum_pos_momentum - sum_neg_momentum) / (sum_pos_momentum + sum_neg_momentum))
float alpha = 2 / (vidya_length + 1)
var float vidya_value = 0.0
vidya_value := alpha * abs_cmo / 100 * src + (1 - alpha * abs_cmo / 100) * nz(vidya_value[1])
ta.sma(vidya_value, 15)
// Method to extend lines and add labels for liquidity levels
method extend_liquidity_lines(array<line> line_array, float price_level, bool is_cross, volume_val)=>
if line_array.size() > 0 and last_bar_index - bar_index < 5000
for i = 0 to line_array.size()-1
if i < line_array.size()
line liquidity_line = line_array.get(i)
float current_line_level = line.get_y2(liquidity_line)
bool price_cross = is_cross
? price_level < current_line_level and price_level[1] >= current_line_level
: price_level > current_line_level and price_level[1] <= current_line_level
bool is_short_line = bar_index - line.get_x1(liquidity_line) < 50
if price_cross and is_short_line
line.set_x2(liquidity_line, bar_index)
line_array.remove(i)
// Add volume label to the liquidity zone
label.new(bar_index-1, price_level[1],
str.tostring(volume_val, format.volume),
color = color.rgb(0, 0, 0, 99),
style = is_cross ? label.style_label_lower_left : label.style_label_upper_left,
textcolor = chart.fg_color,
size = size.small)
// Add a circle label to represent liquidity zone
label.new(bar_index-1, price_level[1],
text = "◉",
color = #00000003,
textcolor = is_cross ? down_trend_color : up_trend_color,
style = label.style_label_center,
size = size.normal)
// }
// CALCULATIONS――――――――――――――――――――――――――――――――――――――――――――――――――――――――――――――――――――――――――――――――――――――――――――――{
// Calculate the Average True Range (ATR)
float atr_value = ta.atr(200) // ATR calculation with length of 200
// Calculate the VIDYA (Variable Index Dynamic Average)
vidya_value = vidya_calc(source, vidya_length, vidya_momentum)
// Calculate upper and lower bands based on VIDYA and ATR
float upper_band = vidya_value + atr_value * band_distance
float lower_band = vidya_value - atr_value * band_distance
// Detect trend direction using crossovers of source with bands
if ta.crossover(source, upper_band)
is_trend_up := true
if ta.crossunder(source, lower_band)
is_trend_up := false
// Set trend-based smoothing variable
if is_trend_up
smoothed_value := lower_band
if not is_trend_up
smoothed_value := upper_band
if ta.change(is_trend_up)
smoothed_value := na
// Calculate pivot highs and lows for price action
float pivot_high = ta.pivothigh(pivot_left_bars, pivot_right_bars)
float pivot_low = ta.pivotlow(close, pivot_left_bars, pivot_right_bars)
// Create and store lines for pivot lows (support zones)
if low[pivot_right_bars] > smoothed_value and pivot_low
pivot_line := line.new(
bar_index[pivot_right_bars],
low[pivot_right_bars],
bar_index[pivot_right_bars]+5,
low[pivot_right_bars],
color = color.new(up_trend_color, 50)
)
liquidity_lines_low.push(pivot_line)
volume_value := math.sum(volume, pivot_right_bars + pivot_left_bars) / (pivot_right_bars + pivot_left_bars)
// Create and store lines for pivot highs (resistance zones)
if high[pivot_right_bars] < smoothed_value and pivot_high
pivot_line := line.new(
bar_index[pivot_right_bars],
high[pivot_right_bars],
bar_index[pivot_right_bars]+5,
high[pivot_right_bars],
color = color.new(down_trend_color, 50)
)
liquidity_lines_high.push(pivot_line)
volume_value := math.sum(-volume, pivot_right_bars + pivot_left_bars) / (pivot_right_bars + pivot_left_bars)
// Extend lines to track price movements
liquidity_lines_high.extend_liquidity_lines(smoothed_value, true, volume_value)
liquidity_lines_low.extend_liquidity_lines(smoothed_value, false, volume_value)
// Detect changes in the trend direction
bool trend_cross_up = not is_trend_up[1] and is_trend_up
bool trend_cross_down = not is_trend_up and is_trend_up[1]
// Reset volume counters when trend changes
if ta.change(trend_cross_up) or ta.change(trend_cross_down)
up_trend_volume := 0
down_trend_volume := 0
// Accumulate volume during trends
if not(ta.change(trend_cross_up) or ta.change(trend_cross_down))
up_trend_volume += (close > open ? volume : 0)
down_trend_volume += (close < open ? volume : 0)
// Calculate average volume
float avg_volume_delta = (up_trend_volume + down_trend_volume) / 2
// Determine the color of the trend
color trend_color = is_trend_up ? up_trend_color
: not is_trend_up ? down_trend_color
: chart.fg_color
// Calculate delta volume percentage
string delta_volume =
str.tostring(((up_trend_volume - down_trend_volume) / avg_volume_delta) * 100, format.percent) == "NaN%"
? "0%"
: str.tostring(((up_trend_volume - down_trend_volume) / avg_volume_delta) * 100, format.percent)
// }
// PLOT ――――――――――――――――――――――――――――――――――――――――――――――――――――――――――――――――――――――――――――――――――――――――――――――――――――――――――――{
// Display labels for volume and trend statistics on the last bar
if barstate.islast
label.delete(
label.new(bar_index, smoothed_value,
"Buy: " + str.tostring(up_trend_volume, format.volume)
+ "\n Sell: " + str.tostring(down_trend_volume, format.volume)
+ "\nDelta Volume: " + delta_volume,
color = color.new(trend_color, 90),
style = is_trend_up ? label.style_label_upper_left : label.style_label_lower_left,
textcolor = chart.fg_color
)[1])
label.delete(label.new(bar_index, smoothed_value,
text = "✪",
color = #00000003,
textcolor = trend_color,
style = label.style_label_center,
size = size.large)[1])
// Plot the VIDYA trend line
p1 = plot(smoothed_value, color = trend_color, linewidth = 2, style = plot.style_linebr)
p2 = plot(hl2, display = display.none)
// Fill between the plot and the VIDYA line
fill(p1, p2, smoothed_value, hl2, color.new(trend_color, shadow ? 80 : 100), na)
// Plot trend change markers (up and down arrows)
plotshape(
series = trend_cross_up[1] ? smoothed_value[0] : na,
title = "Trend Up",
style = shape.labelup,
location = location.absolute,
color = color.new(up_trend_color, 50),
text = "▲",
textcolor = chart.fg_color
)
plotshape(
series = trend_cross_down[1] ? smoothed_value[0] : na,
title = "Trend Down",
style = shape.labeldown,
location = location.absolute,
color = color.new(down_trend_color, 50),
text = "▼",
textcolor = chart.fg_color
)
// }
反馈
1
等级
项目
63
24%
仲裁
10
30%
/
50%
逾期
10
16%
空闲
2
等级
项目
1
0%
仲裁
0
逾期
0
空闲
3
等级
项目
33
27%
仲裁
20
10%
/
50%
逾期
11
33%
空闲
4
等级
项目
8
13%
仲裁
6
33%
/
33%
逾期
0
空闲
相似订单
Please may someone assist me with the indicator attached, it has a SERIOUS BUG issue in the sense that when I load it, and activate the template (attached as well) MT4 ALWAYS freezes and then eventually disconnects automatically, ALL THE TIME. It even gets worse to an extent that after disconnecting a number of times mt4 ends up not loading anymore, UNTIL I remove the indicator. Please I WILL NEED A DEMO (FOR A DAY)
A trending candle followed by a smaller trending candle which is the second candle with no 5EMA The 3rd candle is a reversal candle in which it and it's immidiate previous candle must be at least 70% of each other's body or equal body, with no 5EMA touch the 3rd candle candle is followed immediately by the 4th candle which is the signal candle in which it and the 1st cabdle must be also at least 70% of
LynxMT5algo
30 - 100 USD
An mt5 add on indicator like gainalgo style to show entrance and exit areas for gold silver and Btc scalping. It will be used to make trading more easy for beginners
Simple Added Notice For Existing Indicator
50 - 200 USD
I have the Fisher Indicator shown below the chart. I need an alert added for when the Fisher Indicator hits the 50 point at the end of each period. GBPUSD and EURUSD 4H charts are provided and I can provide additional
Hello here, I need someone who can work on pinescript and also with Renko charts. My entries for my strategy would be based on stop orders Kindly let me know if you can work on this for me and i will send necessary file and quote in the chat
EA Recovery Layer
30+ USD
Freelance Task — EA Recovery Layer Hello. I have a ready-made MQL5 EA. The signals, SL/TP and lot calculation should essentially not be touched. I need a recovery system added. I am not a programmer — below is how the robot should behave. What stays Entry only from an EA signal. Stop-loss is not a new signal. Trailing is already built into my EA — recovery does not implement its own trailing. If trailing is disabled
# SNRZ BOT — SESSION PROGRESS LOG Last updated: 2026-09-16 (local late-evening session) ## SAN BOT (new — cloned from SNRZ) - `MQL5\Experts\AutomatedOrderBot_SAN.mq5` / `.ex5` — v1.0, compiled 0 errors/0 warnings - Signal source: custom indicator "SAN" (InpSANName, buy buf 0 / sell buf 1, target bar 1), same SNRZ-style read, MA fallback if missing - Magic number 234567 (separate from SNRZ 123456 so both bots can run
Should be as it but no alarms, also we need to add a deep search so he can see all the preves candles and a memory function so its not slowing down the indicator. for higher time frames daily 4h 1h around 365 days and for lower time frames we do up to 20k bars but both flexible so i can change it later. the memory is important so the indicator is not always recalculating everything when a new candle shows especially
Hi, I need an experienced NinjaTrader 8/NinjaScript developer to finish or rebuild an automated futures strategy, ideally by the end of this week. I already have the complete TradingView Pine Script reference strategy, an existing ~2,000-line NinjaScript implementation, Playback logs, and known historical benchmark trades. MOST IMPORTANT REQUIREMENT: TRADINGVIEW ↔ NINJATRADER PARITY. The Pine Script is the reference
I need a custom MQL5 indicator for MetaTrader 5. The indicator must automatically print entry, stop loss, and take profit zones on the chart using dots. A critical requirement is that these dots must be non-lagging and absolutely non-repainting. Additionally, the indicator needs to identify and display current supply and demand zones. Please provide the mq5 source code and the ex5 file upon completion
项目信息
预算
30+ USD
截止日期
从 2 到 5 天