すべての注文
 ルール
仕事が完了した

指定
Good Day Developer
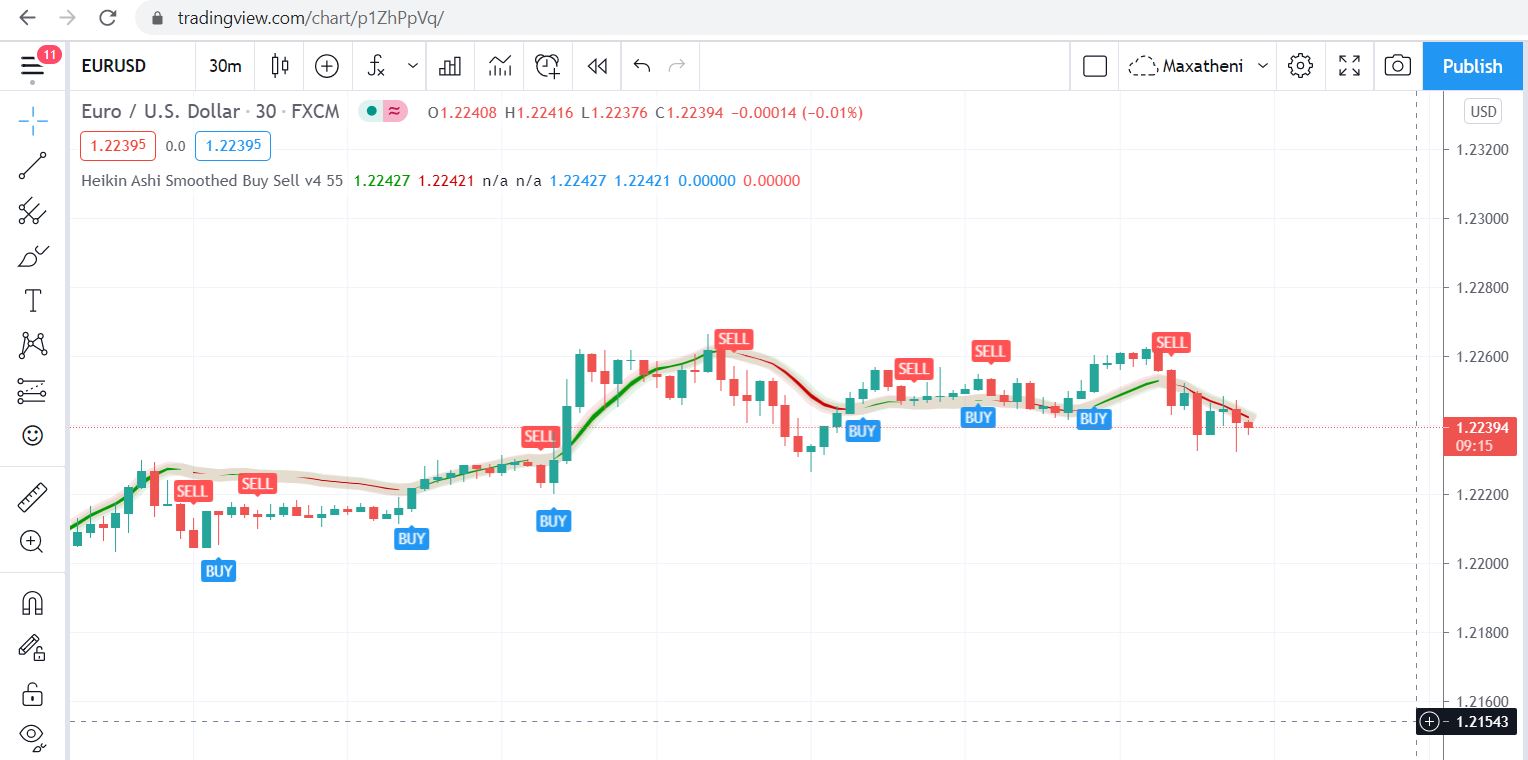
May you kindly convert the below pinescript from TradingView into an MQL4 Indicator. Below is the source code of the indicator on TradingView
I require the indicator asap, so your assistance would be highly appreciated. The MQL4 indicator should be the exact replicae of the Trading View indicator.
My budget is between $20 - $40
Source Code:
study("Heikin Ashi Smoothed Buy Sell v4 ", overlay=true)
EMAlength=input(55,"EMA LENGTH?")
src = ohlc4
haOpen = 0.0
haOpen := (src + nz(haOpen[1])) / 2
haC = (ohlc4 + nz(haOpen) + max(high, nz(haOpen)) + min(low, nz(haOpen))) / 4
EMA1 = ema(haC, EMAlength)
EMA2 = ema(EMA1, EMAlength)
EMA3 = ema(EMA2, EMAlength)
TMA1 = 3 * EMA1 - 3 * EMA2 + EMA3
EMA4 = ema(TMA1, EMAlength)
EMA5 = ema(EMA4, EMAlength)
EMA6 = ema(EMA5, EMAlength)
TMA2 = 3 * EMA4 - 3 * EMA5 + EMA6
IPEK = TMA1 - TMA2
YASIN = TMA1 + IPEK
EMA7 = ema(hlc3, EMAlength)
EMA8 = ema(EMA7, EMAlength)
EMA9 = ema(EMA8, EMAlength)
TMA3 = 3 * EMA7 - 3 * EMA8 + EMA9
EMA10 = ema(TMA3, EMAlength)
EMA11 = ema(EMA10, EMAlength)
EMA12 = ema(EMA11, EMAlength)
TMA4 = 3 * EMA10 - 3 * EMA11 + EMA12
IPEK1 = TMA3 - TMA4
YASIN1 = TMA3 + IPEK1
mavi = YASIN1
kirmizi = YASIN
longCond=mavi>kirmizi and mavi[1]<=kirmizi[1]
shortCond=mavi<kirmizi and mavi[1]>=kirmizi[1]
trendState = kirmizi < mavi ? true : kirmizi > mavi ? false : na
closePlot = plot(kirmizi, title="Close Line", color=#009900, linewidth=10, style=plot.style_line, transp=90)
openPlot = plot(mavi, title="Open Line", color=#CC0000, linewidth=10, style=plot.style_line, transp=90)
closePlotU = plot(trendState ? kirmizi : na, transp=100, editable=false)
openPlotU = plot(trendState ? mavi : na, transp=100, editable=false)
closePlotD = plot(trendState ? na : kirmizi, transp=100, editable=false)
openPlotD = plot(trendState ? na : mavi, transp=100, editable=false)
fill(openPlotU, closePlotU, title="Up Trend Fill", color=#009900, transp=1)
fill(openPlotD, closePlotD, title="Down Trend Fill", color=#CC0000, transp=1)
last_signal = 0
long_final = longCond and (nz(last_signal[1]) == 0 or nz(last_signal[1]) == -1)
short_final = shortCond and (nz(last_signal[1]) == 0 or nz(last_signal[1]) == 1)
alertcondition(long_final, title="buy alarm", message="buy signal!!!")
alertcondition(short_final, title="sell alarm", message="sell signal!!!")
last_signal := long_final ? 1 : short_final ? -1 : last_signal[1]
plotshape(long_final, style=shape.labelup, location=location.belowbar, color=color.blue, size=size.tiny, title="buy label", text="BUY", textcolor=color.white)
plotshape(short_final, style=shape.labeldown, location=location.abovebar, color=color.red, size=size.tiny, title="sell label", text="SELL", textcolor=color.white)