Todos los encargos
 Reglas
Trabajo finalizado

Tarea técnica
Good Day Developer
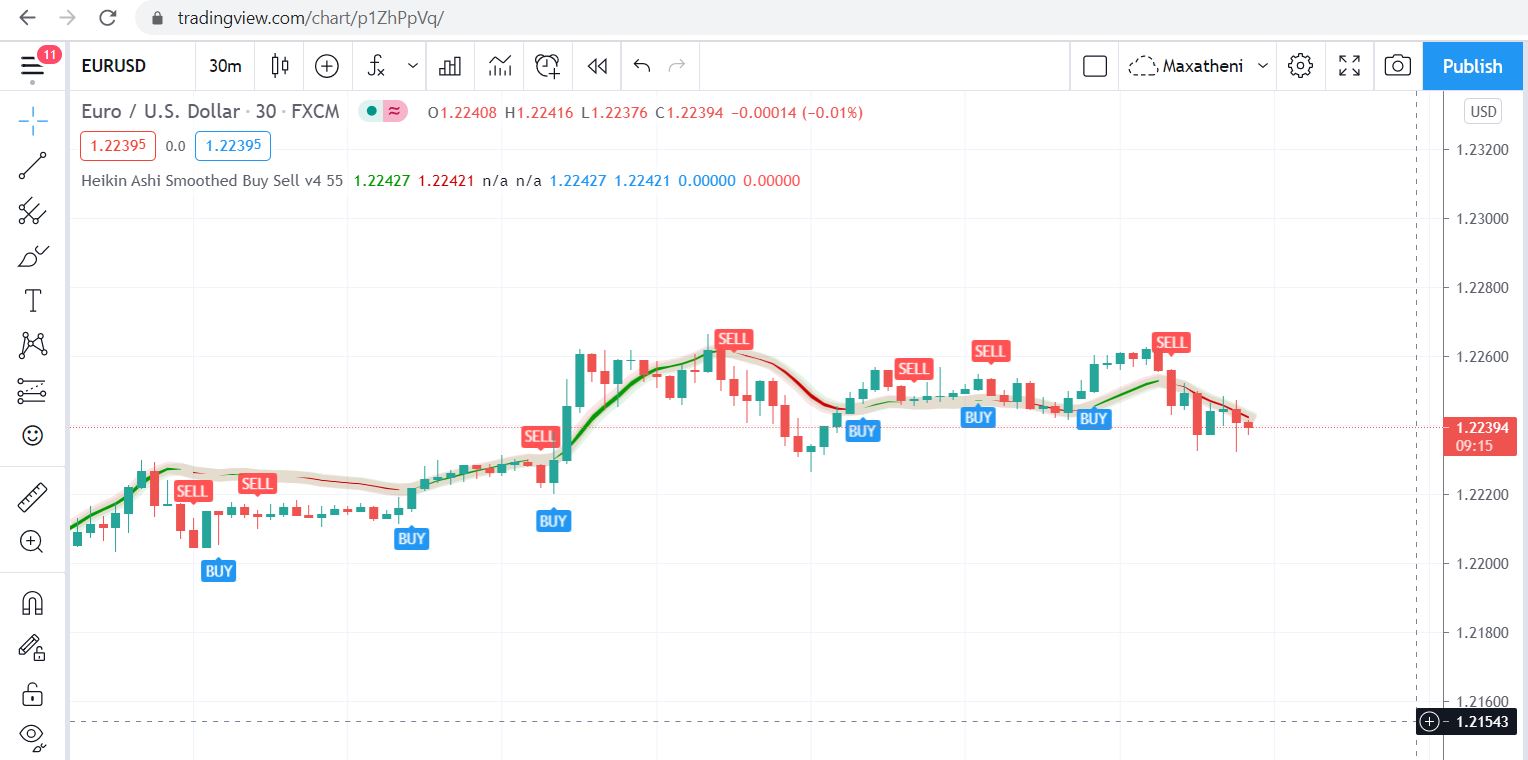
May you kindly convert the below pinescript from TradingView into an MQL4 Indicator. Below is the source code of the indicator on TradingView
I require the indicator asap, so your assistance would be highly appreciated. The MQL4 indicator should be the exact replicae of the Trading View indicator.
My budget is between $20 - $40
Source Code:
study("Heikin Ashi Smoothed Buy Sell v4 ", overlay=true)
EMAlength=input(55,"EMA LENGTH?")
src = ohlc4
haOpen = 0.0
haOpen := (src + nz(haOpen[1])) / 2
haC = (ohlc4 + nz(haOpen) + max(high, nz(haOpen)) + min(low, nz(haOpen))) / 4
EMA1 = ema(haC, EMAlength)
EMA2 = ema(EMA1, EMAlength)
EMA3 = ema(EMA2, EMAlength)
TMA1 = 3 * EMA1 - 3 * EMA2 + EMA3
EMA4 = ema(TMA1, EMAlength)
EMA5 = ema(EMA4, EMAlength)
EMA6 = ema(EMA5, EMAlength)
TMA2 = 3 * EMA4 - 3 * EMA5 + EMA6
IPEK = TMA1 - TMA2
YASIN = TMA1 + IPEK
EMA7 = ema(hlc3, EMAlength)
EMA8 = ema(EMA7, EMAlength)
EMA9 = ema(EMA8, EMAlength)
TMA3 = 3 * EMA7 - 3 * EMA8 + EMA9
EMA10 = ema(TMA3, EMAlength)
EMA11 = ema(EMA10, EMAlength)
EMA12 = ema(EMA11, EMAlength)
TMA4 = 3 * EMA10 - 3 * EMA11 + EMA12
IPEK1 = TMA3 - TMA4
YASIN1 = TMA3 + IPEK1
mavi = YASIN1
kirmizi = YASIN
longCond=mavi>kirmizi and mavi[1]<=kirmizi[1]
shortCond=mavi<kirmizi and mavi[1]>=kirmizi[1]
trendState = kirmizi < mavi ? true : kirmizi > mavi ? false : na
closePlot = plot(kirmizi, title="Close Line", color=#009900, linewidth=10, style=plot.style_line, transp=90)
openPlot = plot(mavi, title="Open Line", color=#CC0000, linewidth=10, style=plot.style_line, transp=90)
closePlotU = plot(trendState ? kirmizi : na, transp=100, editable=false)
openPlotU = plot(trendState ? mavi : na, transp=100, editable=false)
closePlotD = plot(trendState ? na : kirmizi, transp=100, editable=false)
openPlotD = plot(trendState ? na : mavi, transp=100, editable=false)
fill(openPlotU, closePlotU, title="Up Trend Fill", color=#009900, transp=1)
fill(openPlotD, closePlotD, title="Down Trend Fill", color=#CC0000, transp=1)
last_signal = 0
long_final = longCond and (nz(last_signal[1]) == 0 or nz(last_signal[1]) == -1)
short_final = shortCond and (nz(last_signal[1]) == 0 or nz(last_signal[1]) == 1)
alertcondition(long_final, title="buy alarm", message="buy signal!!!")
alertcondition(short_final, title="sell alarm", message="sell signal!!!")
last_signal := long_final ? 1 : short_final ? -1 : last_signal[1]
plotshape(long_final, style=shape.labelup, location=location.belowbar, color=color.blue, size=size.tiny, title="buy label", text="BUY", textcolor=color.white)
plotshape(short_final, style=shape.labeldown, location=location.abovebar, color=color.red, size=size.tiny, title="sell label", text="SELL", textcolor=color.white)