スピーディに自動売買ロボットを注文する方法を見る
注文を投稿するまたは受注する前にルールをご覧ください。
MQL5およびMQL4で自動売買ロボットを注文する方法
ロボットを注文するにはサンプル要件仕様をご覧ください
カテゴリでの新規注文:
50 - 100 USD
30 - 200 USD
30 - 75 USD
30+ USD
仕事が完了した
実行時間117 日
指定
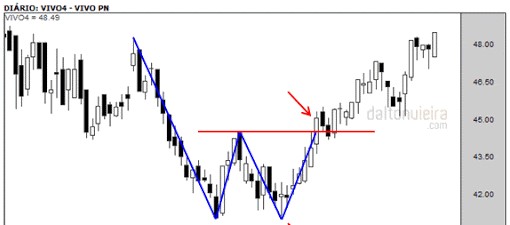
This EA needs to operate on B3 assets (Brazilian stock exchange) in its main assets, including the Mini Index (IND $ N)
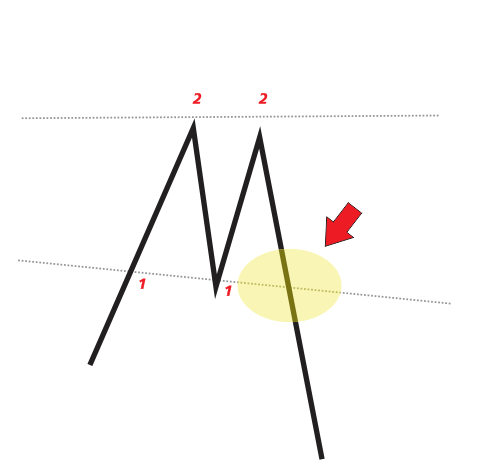
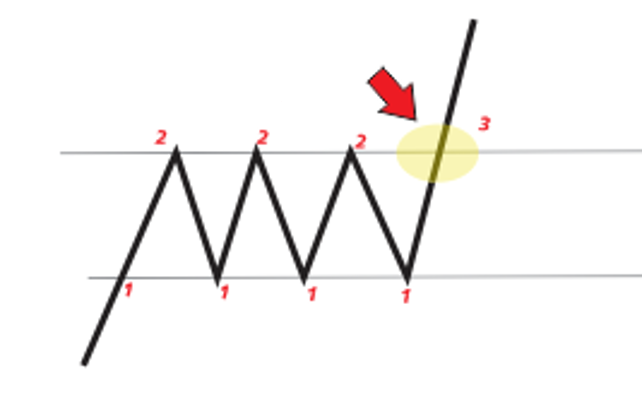
As shown in the attached images, I need an EA that performs the following operation:
Draw a resistance line joining 2 or more tops
Draw a support line joining 2 or more backgrounds
After the chart touches (without breaking) at least 2 x the support line and the resistance line should trigger the buy / sell trigger as follows:
Support line break = Sale
Breaking the resistance line = Purchase
Both the PURCHASE and the SELL must be triggered exactly at the breaking point.
Only fire the buy or sell trigger at the break if the chart has already touched the support and resistance lines at least 2 times without breaking
As an input parameter it must have:
Lots
Take profit%
Stop Loss%
Important: It is essential that the definition of Take Profit and Stop Loss are made in percentage terms%
応答済み
1
評価
プロジェクト
7
0%
仲裁
0
期限切れ
0
暇
2
評価
プロジェクト
17
59%
仲裁
2
0%
/
100%
期限切れ
2
12%
暇
3
評価
プロジェクト
3
0%
仲裁
3
67%
/
33%
期限切れ
0
暇
プロジェクト情報
予算
30 - 45 USD
締め切り
最高 5 日