트레이딩 로봇 주문 방법을 보십시오
주문을 실행하거나 포스트하기 전에 규칙을 읽으십시오
MQL5 및 MQL 4의 트레이딩 로봇을 주문하는 방법
로봇을 주문하기 위해샘플 요구 사항을 보십시오
카테고리의 새로운 주문:
50 - 100 USD
30 - 200 USD
30 - 75 USD
30+ USD
작업 종료됨
실행 시간 117 일
명시
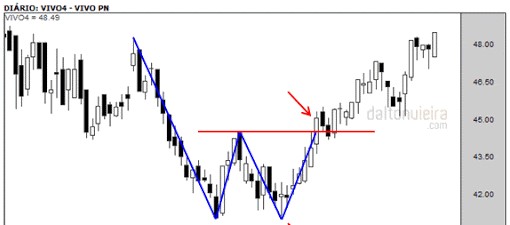
This EA needs to operate on B3 assets (Brazilian stock exchange) in its main assets, including the Mini Index (IND $ N)
As shown in the attached images, I need an EA that performs the following operation:
Draw a resistance line joining 2 or more tops
Draw a support line joining 2 or more backgrounds
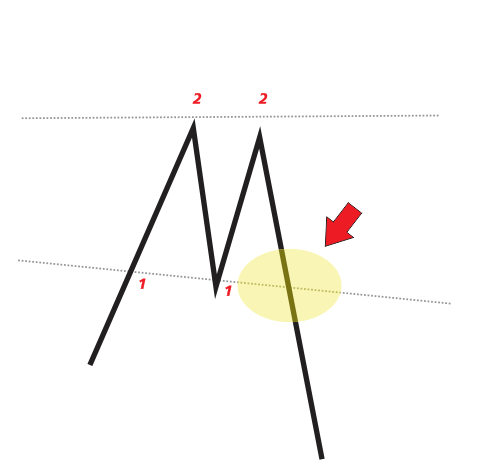
After the chart touches (without breaking) at least 2 x the support line and the resistance line should trigger the buy / sell trigger as follows:
Support line break = Sale
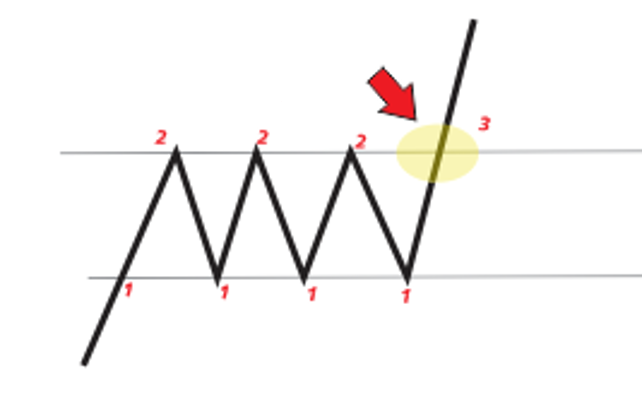
Breaking the resistance line = Purchase
Both the PURCHASE and the SELL must be triggered exactly at the breaking point.
Only fire the buy or sell trigger at the break if the chart has already touched the support and resistance lines at least 2 times without breaking
As an input parameter it must have:
Lots
Take profit%
Stop Loss%
Important: It is essential that the definition of Take Profit and Stop Loss are made in percentage terms%
응답함
1
등급
프로젝트
7
0%
중재
0
기한 초과
0
무료
2
등급
프로젝트
17
59%
중재
2
0%
/
100%
기한 초과
2
12%
무료
3
등급
프로젝트
3
0%
중재
3
67%
/
33%
기한 초과
0
무료
프로젝트 정보
예산
30 - 45 USD
기한
로 5 일