仕事が完了した
指定
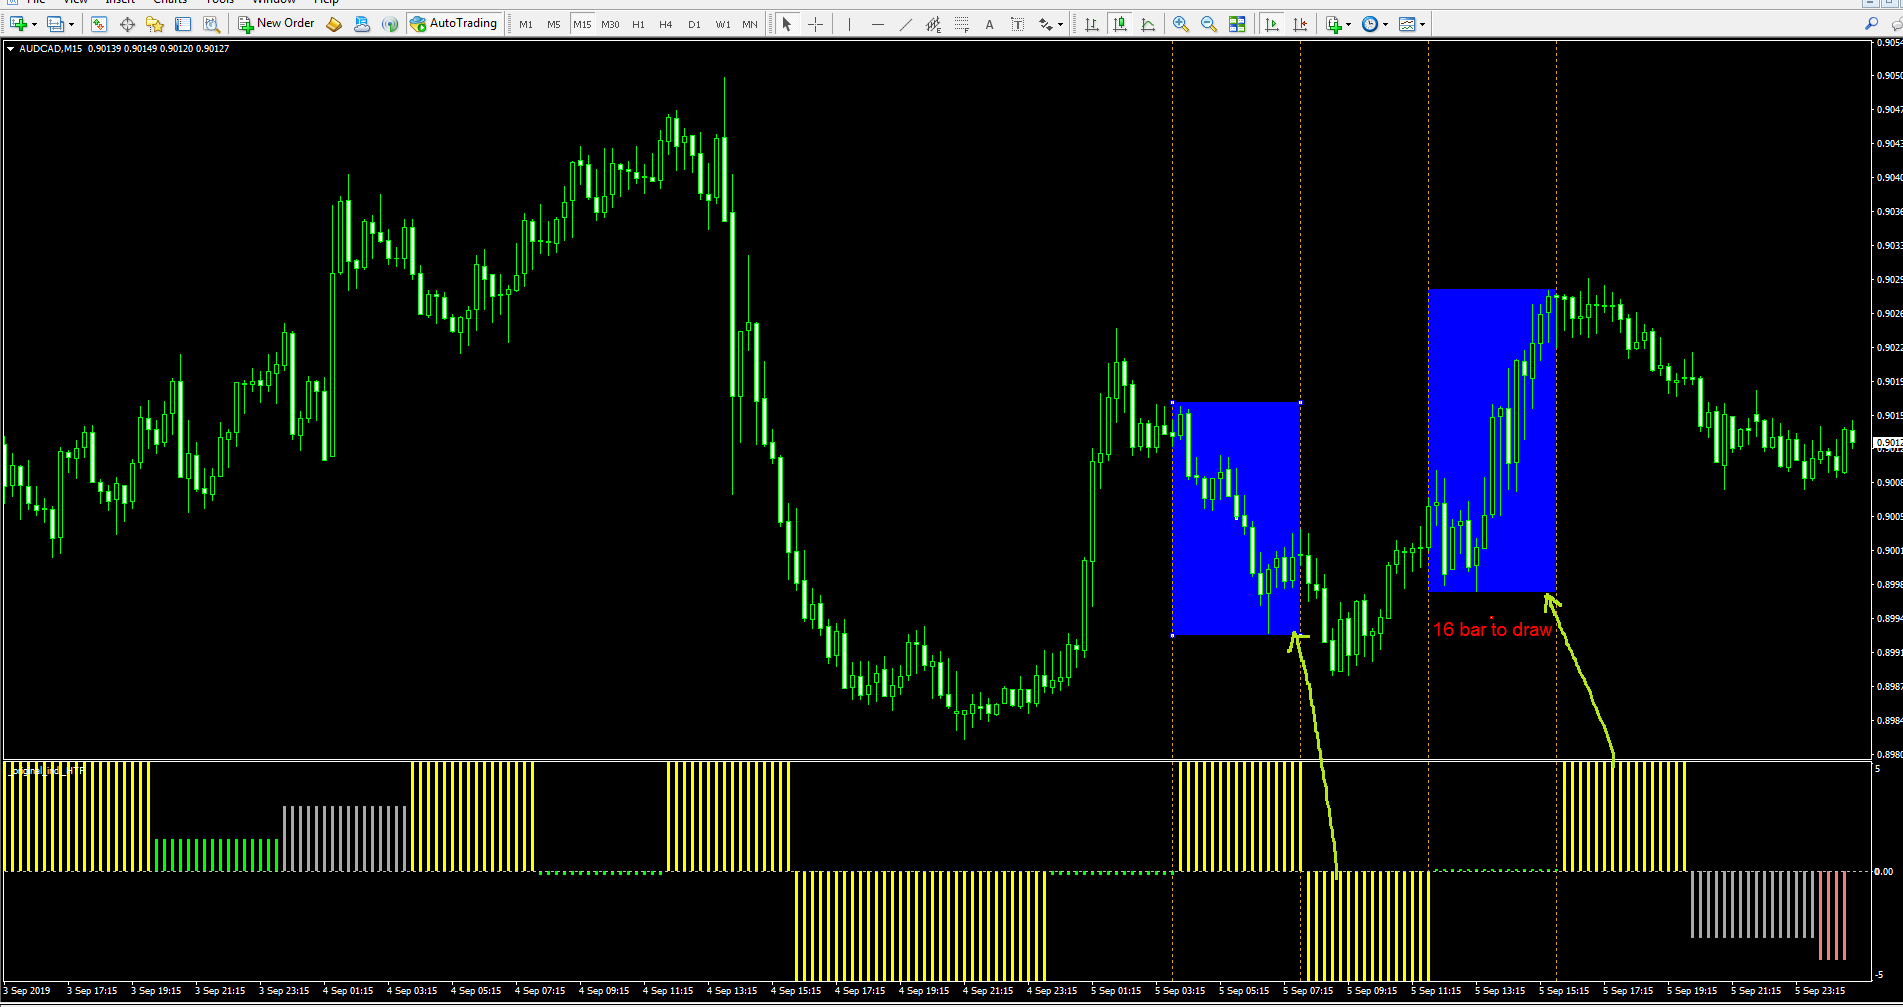
Hi,
I have 1 original indicator and 1 Higher TimeFrame for this indicator.
This indicator draw value when bar closed.
This indicator take value +/-5, 4, 3, 1.5, 0.1
In the picture, I put:
- H4 for Higher Time Frame on M15 for current time frame à 16 bar
- Value to draw: 5
Any time the HTF indicator turn to value 5 or -5, I want to draw a box that cover the High and Low for bar[i+1] to bar[i+16]. 16 is because H4 on M15 has 16 bar.
So the script(?) I need allow me to:
1. Put HTF of any window (D1, H4…) into any lower time frame. If D1 put on H1, the script will draw box based on 24 bar of H1.
2. Change the value to draw. If value to draw is 3, the script will draw anytime HTF indicator3, 4,5 or -3, -4, -5
The logic can be found in the draft below. Might be it helpful.
Thank you.
HHC
Input Value_to_draw=5;
If( MathAbs(HTF_indicator(i)) >= Value_to_draw && HTF_indicator(i+1) != HTF_indicator(i))
{ for( int j=i+1; j<=i+16; j++)
{ get_highest=
get_lowest =
}
}
Based on highest and lowest, draw box from bar[i+1] to bar[i+16]