Hi, I’m looking for an experienced developer to build an MT5 indicator based on the strategy outlined below. The indicator should: Identify and display entry points Plot TP1, TP2, TP3 , and Stop Loss (SL) using ATR-based calculations Run on my MT5 desktop platform Send real-time trade signals/alerts to my Telegram account If Telegram integration is not feasible, please suggest alternative methods (e.g. push
This robot is going to help me to assist my parents about their needs, it also going help me build a house and purchase my own car. Additionally, it is going to play an essential role upon my life as I will not struggle with the foods and transport for taking the trips
I am looking for a serious marketer with experience in promoting trading tools or Expert Advisors for MetaTrader 5. The product is an automated MT5 trading EA focused on Gold trading, with risk-management tools and trading filters designed to improve trade quality. For credibility, I will provide: An Investor Account for a live/demo account where the EA has been running for a while Backtest reports for the EA Clear
I want the indicator to be built professionally and carefully because the strategy is strong, but it requires advanced and clean programming. The indicator should work mainly on XAUUSD M15 and should generate more than 2 high-quality signals per day, ideally around 2 to 4 signals maximum, without flooding the chart. The logic must not be random. Each signal must be based on: HTF Bias from H1/H4, Liquidity Sweep
Good day, I would like to have an expert advisor for my MT4 indicator (Major key alert) that can scan and provide push notification messages for entry opportunities across different time frames when a when a signal is identified
This is to modify my Semi Auto EA -Looking for developer modify my existing EA to Pending Order EA (BS/BL/SL/SS). Relevent with Heiken Ashi Smooth ,Moving Average , Acceleration. Concept MAster and Slave. Ready to give previous soucre code as guide. Work to do - 1)To modify this EA to Pending Order. 2) to add new feature - Risk Management/moneymanagement 3) To modify 4 slave to 7 slave will give the previous to
I have a indicator working good but have some bug for arrow placement . budget is fixed 30 used . only experience developer apply. i want to arrow get put on just above the candle high and candle low
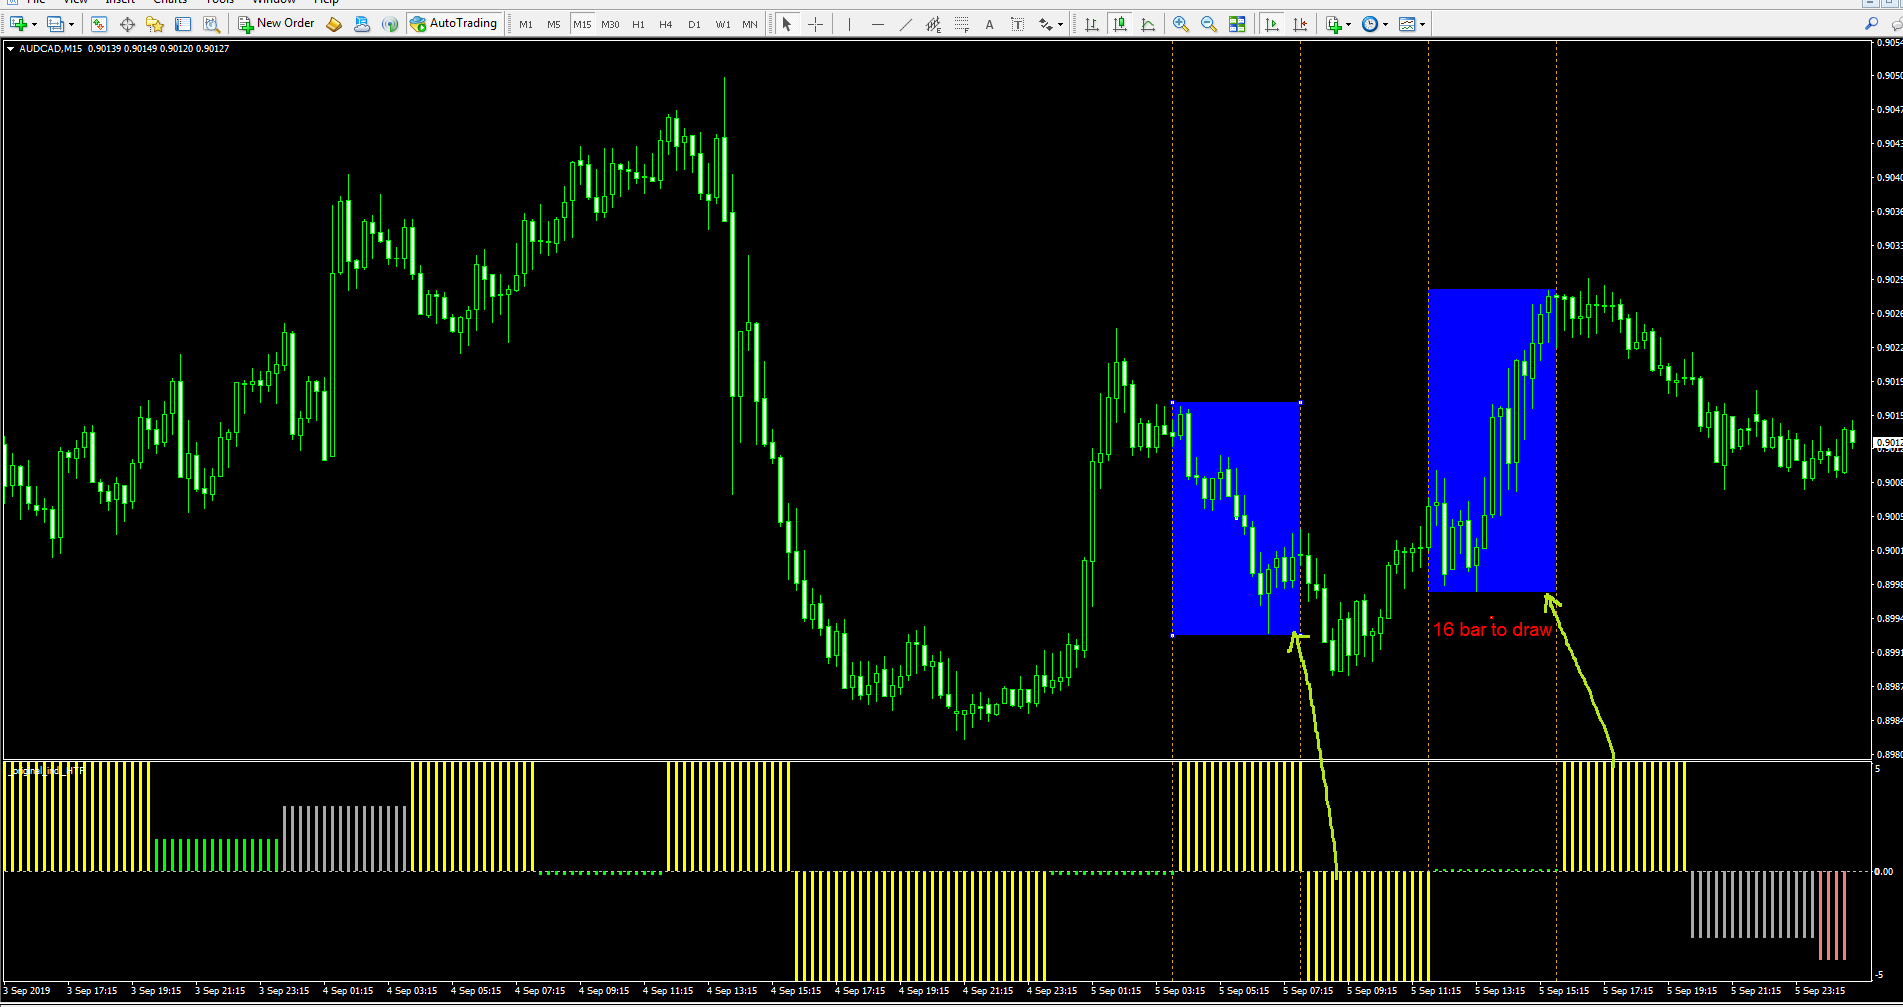
I am looking to get this Indicator but i don't know which indicator is it , if anyone know about it let me know , images are attached , this is used for Binary Pairs
i want a trading bot that is aleast 98% sure,and cam also do scalping 99% correct using smart money concept, ICT, ALL technical analysis on it and also put risk management on it
Greetings I need MT5 developer that has expertise in developing a custom indicator for mt5 boom and crash based on my exact details and requirements which would be discuss later. Kindly bid for this project if it is something you can handle for me