記事「MQL5におけるタイムギャップ分析(第2回):時間経過に伴う流動性分布のヒートマップ作成」についてのディスカッション
ふと思い出した:ずいぶん昔、こんなことをやったことがあった。
私の見解では、あなたのものはほんの少しだけ未完成です――規則的な構造を明らかにする(あるいはそれが存在しないことを示す)ことが残っています。
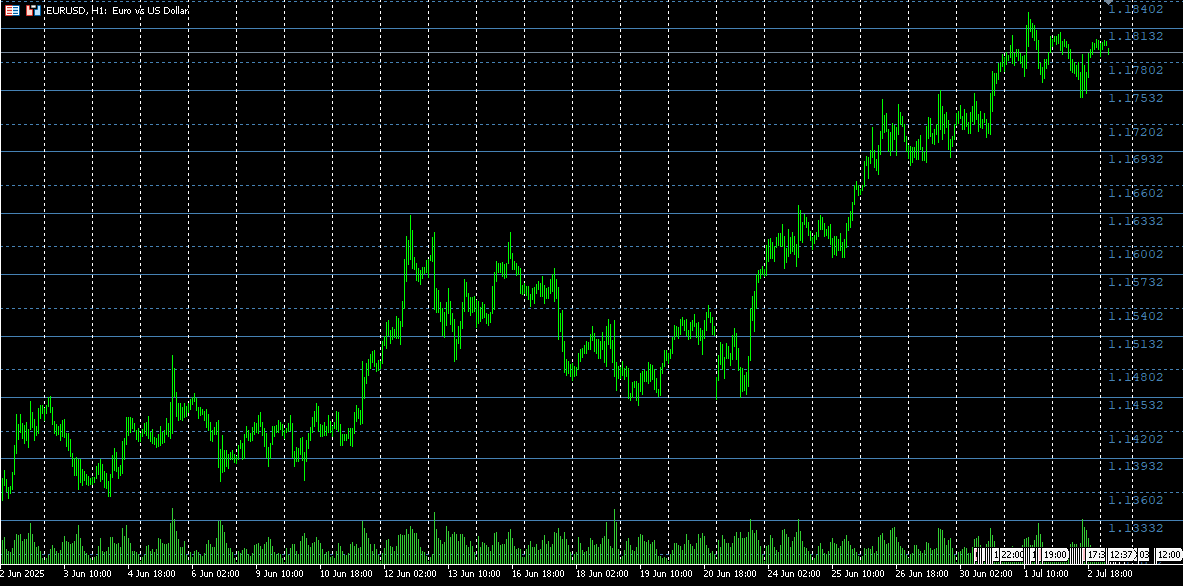
もちろんこれはヒートマップではありません。単に、このような温度分布図の規則的な部分における極値を出力しただけです。
これは、広く知られている「市場プロファイル」と(色の塗り分けを除いて)どのような点が異なるのでしょうか?
ChatGPTを使って、いくつか「改良」を加えて自分にとって役立つものを作ってみようと思い、実験してみたところ、こんなものが出来上がりました。 コメントアウトされている部分は、価格が色分けされたゾーンのいずれかに入ったタイミングを特定し、その反応を視覚的に示そうとした試みです。 しかし、本来の意図は、これらの色のニュアンスを捉えることでした。例えば、ゾーンがほんの少し明るいオレンジ色になると、私の観察では価格が横ばいになる傾向があります。
//+------------------------------------------------------------------+
//|             Heat Map Plus — v3.00 改変版                     |
//|   バッファ/アラートを維持し、ADX、統計情報、ランキングを追加する     |
//+------------------------------------------------------------------+
#property copyright "Chart Coloring by Time and Volume Distribution"
#property link      "https://www.mql5.com"
#property version   "3.00"
#property indicator_chart_window
#property strict

#include <Math\Stat\Math.mqh>    // MathMean、MathStdDev
#include <Indicators\Trend.mqh>     // トレンドをフィルタリングするためのADX

// EA用バッファ
#property indicator_buffers 3
#property indicator_plots   0
double LevelPriceBuffer[];
double LevelStrengthBuffer[];
double LevelTypeBuffer[];

//--- 入力パラメータ
sinput group "=== Heat Map Settings ==="
input int      AnalysisPeriod   = 500;
input int      MaxHistory       = 10000;
input double   TickSize         = 0;
input bool     UseTickVolume    = true;
input double   VolumeWeight     = 0.5;
input int      SessStartHour    = 8;
input int      SessEndHour      = 17;
input double   MinBarRange      = 10;
input bool     EnableAlerts     = true;

//+------------------------------------------------------------------+
//|                                                                  |
//+------------------------------------------------------------------+
sinput group "=== 色 (1%→100%) ==="
input color    Color1Percent    = clrRed;
input color    Color25Percent   = clrOrange;
input color    Color50Percent   = clrYellow;
input color    Color75Percent   = clrAqua;
input color    Color100Percent  = clrBlue;
input int      Transparency     = 70;

//--- グローバル変数
struct PriceLevel {
 double price, price_high, price_low;
 long   time_spent;
 long   volume;
 double presence_percent;
 color  level_color;
 string object_name; };
PriceLevel      levels[];
datetime        startTime, endTime, lastUpdate;
int             totalPriceLevels = 0;
long            maxTimeSpent = 0, minTimeSpent = LONG_MAX;
long            maxVolume = 0,    minVolume    = LONG_MAX;
bool            calculated = false;

//--- ADXハンドル
CiADX   adx;

//+------------------------------------------------------------------+
//| 初期化                                                  |
//+------------------------------------------------------------------+
int OnInit() {
// EA用バッファ
 SetIndexBuffer(0, LevelPriceBuffer);
 SetIndexBuffer(1, LevelStrengthBuffer);
 SetIndexBuffer(2, LevelTypeBuffer);
 if(AnalysisPeriod < 50 || MaxHistory < AnalysisPeriod) {
  Print(「不正なパラメータ:50 <= AnalysisPeriod <= MaxHistory」);
  return(INIT_PARAMETERS_INCORRECT); }
 if(VolumeWeight < 0 || VolumeWeight > 1) {
  Print("VolumeWeight deve estar em [0,1]");
  return(INIT_PARAMETERS_INCORRECT); }
// ADX(14)
 if(!adx.Create(_Symbol, _Period, 14)) {
  Print("Erro ao criar ADX");
  return(INIT_FAILED); }
 ArrayResize(levels, 0);
 lastUpdate = 0;
 calculated = false;
 totalPriceLevels = 0;
 return(INIT_SUCCEEDED); }

//+------------------------------------------------------------------+
//| 計算                                                     |
//+------------------------------------------------------------------+
int OnCalculate(const int rates_total,
                const int prev_calculated,
                const datetime &time[],
                const double &/*open*/[],
                const double &high[],
                const double &low[],
                const double &/*close*/[],
                const long &tick_volume[],
                const long &volume[],
                const int &/*spread*/[]) {
 if(rates_total < AnalysisPeriod) return(0);
// 新しいローソク足でのみ再計算する
 if(lastUpdate == time[rates_total - 1]) return(rates_total);
 lastUpdate = time[rates_total - 1];
 calculated = false;
 if(!calculated) {
  // ADXを更新する
  adx.Refresh(1);
  // 主な計算
  CalculateTimeDistribution(time, high, low, tick_volume, volume, rates_total);
  ColorChart();
  ExportBuffers(rates_total);
  calculated = true; }
 return(rates_total); }

//+------------------------------------------------------------------+
//| スライディング・ウィンドウ + セッションおよびボラティリティフィルター               |
//+------------------------------------------------------------------+
void CalculateTimeDistribution(const datetime &time[],
                               const double &high[],
                               const double &low[],
                               const long &tick_volume[],
                               const long &volume[],
                               int rates_total) {
 ArrayResize(levels, 0);
 int historyStart = MathMax(0, rates_total - MaxHistory);
 startTime = time[historyStart];
 endTime   = time[rates_total - 1];
// 価格帯
 double maxP = high[ArrayMaximum(high, historyStart, MaxHistory)];
 double minP = low [ArrayMinimum(low,  historyStart, MaxHistory)];
 double priceRange = maxP - minP;
 if(priceRange <= 0) return;
// ティックサイズ
 double tk = (TickSize > 0 ? TickSize : Point());
 totalPriceLevels = (int)(priceRange / tk);
 totalPriceLevels = MathMin(1000, MathMax(50, totalPriceLevels));
 double realTick = priceRange / totalPriceLevels;
// レベルの初期化
 ArrayResize(levels, totalPriceLevels);
 for(int i = 0; i < totalPriceLevels; i++) {
  levels[i].price       = minP + i * realTick;
  levels[i].price_high  = levels[i].price + realTick / 2;
  levels[i].price_low   = levels[i].price - realTick / 2;
  levels[i].time_spent  = 0;
  levels[i].volume      = 0;
  levels[i].object_name = "HeatLevel_" + IntegerToString(i); }
// バーを移動する
 for(int bar = historyStart; bar < rates_total; bar++) {
  // セッションフィルター
  int hr = TimeHour(time[bar]);
  if(hr < SessStartHour || hr > SessEndHour) continue;
  // ボラティリティフィルター
  double amp = (high[bar] - low[bar]) / Point();
  if(amp < MinBarRange) continue;
  long barVol = UseTickVolume ? tick_volume[bar] : volume[bar];
  // 影響を受けたレベルを特定する
  int st = MathMax(0, (int)((low[bar]  - minP) / realTick));
  int en = MathMin(totalPriceLevels - 1,
                   (int)((high[bar] - minP) / realTick));
  for(int li = st; li <= en; li++) {
   if(DoesBarTouchLevel(high[bar], low[bar], levels[li])) {
    levels[li].time_spent++;
    levels[li].volume    += barVol; } } }
// acha 最小値・最大値
 maxTimeSpent = 0; minTimeSpent = LONG_MAX;
 maxVolume    = 0; minVolume    = LONG_MAX;
 for(int i = 0; i < totalPriceLevels; i++) {
  long t = levels[i].time_spent;
  long v = levels[i].volume;
  if(t > maxTimeSpent) maxTimeSpent = t;
  if(t > 0 && t < minTimeSpent) minTimeSpent = t;
  if(v > maxVolume)    maxVolume    = v;
  if(v > 0 && v < minVolume)    minVolume    = v; }
 if(minTimeSpent == LONG_MAX) minTimeSpent = 0;
 if(minVolume   == LONG_MAX) minVolume   = 0;
// パーセンテージと色
 CalculatePercentsAndColors(); }

//+------------------------------------------------------------------+
//| パーセントとコア数                                                |
//+------------------------------------------------------------------+
void CalculatePercentsAndColors() {
 long tr = maxTimeSpent - minTimeSpent;  if(tr <= 0) tr = 1;
 long vr = maxVolume    - minVolume;     if(vr <= 0) vr = 1;
 for(int i = 0; i < totalPriceLevels; i++) {
  double tp = levels[i].time_spent > 0 ?
              ((levels[i].time_spent - minTimeSpent) / (double)tr) * 100.0 : 0;
  double vp = levels[i].volume > 0 ?
              ((levels[i].volume - minVolume) / (double)vr) * 100.0 : 0;
  double comb = (1.0 - VolumeWeight) * tp + VolumeWeight * vp;
  levels[i].presence_percent =
   MathMax(1.0, MathMin(100.0, comb));
  levels[i].level_color =
   GetPercentageColor(levels[i].presence_percent); } }

//+------------------------------------------------------------------+
//| チャートの色付けとアラート                                         |
//+------------------------------------------------------------------+

//+------------------------------------------------------------------+
//|                                                                  |
//+------------------------------------------------------------------+
void ColorChart() {
 ClearPreviousObjects();
 datetime nowTime = TimeCurrent();
 double lastBid = SymbolInfoDouble(_Symbol, SYMBOL_BID);
// ゾーン名の配列
 string zoneNames[5] = {"", 「Reversão」, 「トレンド」, 「ラテラリザシオン」, "Barreira" };
// 1) ztypeの平均価格を保存する
 int    types[]; ArrayResize(types, totalPriceLevels);
 double mids[];  ArrayResize(mids,  totalPriceLevels);
 for(int i = 0; i < totalPriceLevels; i++) {
  types[i] = (int)LevelTypeBuffer[ArraySize(LevelTypeBuffer) - 1 - i];
  if(types[i] < 1 || types[i] > 4)
   types[i] = 4;
  mids[i] = (levels[i].price_low + levels[i].price_high) / 2.0; }
// 2) ゾーンオブジェクト(色付きの四角形)を作成する
 for(int i = 0; i < totalPriceLevels; i++) {
  string nm = levels[i].object_name;
  // ゾーンの矩形
  if(ObjectCreate(ChartID(), nm, OBJ_RECTANGLE, 0,
                  startTime, levels[i].price_low,
                  nowTime,   levels[i].price_high)) {
   ObjectSetInteger(ChartID(), nm, OBJPROP_COLOR, levels[i].level_color);
   ObjectSetInteger(ChartID(), nm, OBJPROP_BACK, true);
   ObjectSetInteger(ChartID(), nm, OBJPROP_FILL, true);
   ENUM_LINE_STYLE style = (Transparency > 50) ? STYLE_DOT : STYLE_SOLID;
   ObjectSetInteger(ChartID(), nm, OBJPROP_STYLE, style);
   ObjectSetInteger(ChartID(), nm, OBJPROP_WIDTH, 1); }
  // アラート
  if(EnableAlerts) {
   static double lastPrice = 0;
   bool cross = ((lastPrice < levels[i].price && lastBid >= levels[i].price) ||
                 (lastPrice > levels[i].price && lastBid <= levels[i].price));
   if(cross) {
    Alert(「ヒートマップ:価格が水準を突破」,
          DoubleToString(levels[i].price, _Digits),
          " [", zoneNames[types[i]], "]"); }
   lastPrice = lastBid; } }
//// 3) 隣接するタイプごとにグループ分けし、グループごとに線を引く
// struct Segment {
//  int type;
//  int start;
//  int end; };
// セグメント segs[];
// ArrayResize(segs, 0);
// int currentType = types[0];
// int segStart = 0;
// for(int i = 1; i < totalPriceLevels; i++) {
//  if(types[i] != currentType) {
//   セグメント seg;
//   seg.type  = currentType;
//   seg.start = segStart;
//   seg.end   = i - 1;
//   ArrayResize(segs, ArraySize(segs) + 1);
//   segs[ArraySize(segs) - 1] = seg;
//   currentType = types[i];
//   segStart    = i; } }
//// 最後のセグメント
// セグメント lastSeg;
// lastSeg.type  = currentType;
// lastSeg.start = segStart;
// lastSeg.end   = totalPriceLevels - 1;
// ArrayResize(segs, ArraySize(segs) + 1);
// segs[ArraySize(segs) - 1] = lastSeg;
//// 4) セグメントごとに中央の水平線を引く
// for(int j = 0; j < ArraySize(segs); j++) {
//  int s = segs[j].start;
//  int e = segs[j].end;
//  int type = segs[j].type;
//  // 平均価格の範囲
//  double avgPrice = 0;
//  for(int k = s; k <= e; k++)
//   avgPrice += mids[k];
//  avgPrice /= (e - s + 1);
//// 水平線を引く
//  string lineName = StringFormat(zoneNames[types[s]] + "linha", s, e);
//  if(ObjectCreate(ChartID(), lineName, OBJ_HLINE, 0, 0, avgPrice)) {
//   ObjectSetInteger(ChartID(), lineName, OBJPROP_COLOR, clrWhite);
//   ObjectSetInteger(ChartID(), lineName, OBJPROP_WIDTH, 4);
//   ObjectSetInteger(ChartID(), lineName, OBJPROP_STYLE, STYLE_SOLID);  }
//// 右側にテキストを作成(表示されている最新のローソク足)
//  double textOffset = SymbolInfoDouble(_Symbol, SYMBOL_POINT) * 100; // 行の上方への垂直オフセット
//  double textPrice = avgPrice + textOffset;
//  datetime timeRight = iTime(_Symbol, _Period, 0);  // 直近のローソク足の時間
//  string textName = StringFormat(zoneNames[types[s]] + "texto", s, e);
//  if(ObjectCreate(ChartID(), textName, OBJ_TEXT, 0, timeRight, textPrice)) {
//   ObjectSetInteger(ChartID(), textName, OBJPROP_COLOR, clrBlack);
//   ObjectSetInteger(ChartID(), textName, OBJPROP_FONTSIZE, 10);
//   ObjectSetInteger(ChartID(), textName, OBJPROP_CORNER, CORNER_RIGHT_LOWER); // ピクセル単位で指定したい場合はオプション
//   ObjectSetString(ChartID(), textName, OBJPROP_TEXT, zoneNames[types[s]]);
//   ObjectSetInteger(ChartID(), textName, OBJPROP_ANCHOR, ANCHOR_RIGHT);       // ポイントの右側にアンカー
//  } }
}
//+------------------------------------------------------------------+
//|                                                                  |
//+------------------------------------------------------------------+
int CountZLineObjects() {
 int total = ObjectsTotal(ChartID());
 int count = 0;
 for(int i = 0; i < total; i++) {
  string name = ObjectName(ChartID(), i);
  if(StringFind(name, "ZLine_") == 0) // 「ZLine_」で始まるかどうかを確認する
   count++; }
 return count; }
//+------------------------------------------------------------------+
//| EAへのバッファのエクスポート + ゾーン分類                 |
//+------------------------------------------------------------------+
void ExportBuffers(int rates_total) {
// 統計データの配列を作成する
 double stats[]; ArrayResize(stats, totalPriceLevels);
 for(int i = 0; i < totalPriceLevels; i++)
  stats[i] = levels[i].presence_percent;
 double mean = MathMean(stats);
 double sd   = MathStdDev(stats, mean);
 if(sd <= 0) sd = mean * 0.1;
 double adxValue = adx.Main(0);
 int cnt = MathMin(totalPriceLevels,
                   ArraySize(LevelPriceBuffer));
 for(int i = 0; i < cnt; i++) {
  // ゾーンの種類
  double p = levels[i].presence_percent;
  int ztype = 4; // デフォルトはBARREIRA
  if(p < mean - sd)                                 ztype = 1; // 改訂版
  else if(p > mean + sd && adxValue >= 25.0)        ztype = 2; // トレンド
  else if(adxValue < 20.0)                          ztype = 3; // 側性化
  LevelPriceBuffer   [rates_total - 1 - i] = levels[i].price;
  LevelStrengthBuffer[rates_total - 1 - i] = p;
  LevelTypeBuffer    [rates_total - 1 - i] = ztype; } }

//+------------------------------------------------------------------+
//| ヘルパー                                                         |
//+------------------------------------------------------------------+
bool DoesBarTouchLevel(double high, double low,
                       const PriceLevel &L) {
 return(high >= L.price_low && low <= L.price_high); }

//+------------------------------------------------------------------+
//|                                                                  |
//+------------------------------------------------------------------+
void ClearPreviousObjects() {
 int tot = ObjectsTotal(ChartID());
 for(int i = tot - 1; i >= 0; i--) {
  string nm = ObjectName(ChartID(), i);
  if(StringFind(nm, "HeatLevel_") == 0)
   ObjectDelete(ChartID(), nm); } }

//+------------------------------------------------------------------+
//|                                                                  |
//+------------------------------------------------------------------+
color GetPercentageColor(double p) {
 if(p <= 1.0)      return Color1Percent;
 else if(p <= 25.) return InterpolateColor(
                            Color1Percent,
                            Color25Percent,
                            (p - 1) / 24);
 else if(p <= 50.) return InterpolateColor(
                            Color25Percent,
                            Color50Percent,
                            (p - 25) / 25);
 else if(p <= 75.) return InterpolateColor(
                            Color50Percent,
                            Color75Percent,
                            (p - 50) / 25);
 else              return InterpolateColor(
                            Color75Percent,
                            Color100Percent,
                            (p - 75) / 25); }

//+------------------------------------------------------------------+
//|                                                                  |
//+------------------------------------------------------------------+
color InterpolateColor(color c1, color c2, double f) {
 int r1 = (c1 >> 16) & 0xFF, g1 = (c1 >> 8) & 0xFF,
     b1 = c1 & 0xFF;
 int r2 = (c2 >> 16) & 0xFF, g2 = (c2 >> 8) & 0xFF,
     b2 = c2 & 0xFF;
 int r = int(r1 + (r2 - r1) * f),
     g = int(g1 + (g2 - g1) * f),
     b = int(b1 + (b2 - b1) * f);
 return (r << 16) | (g << 8) | b; }

//+------------------------------------------------------------------+
//|                                                                  |
//+------------------------------------------------------------------+
int TimeHour(const datetime time) {
 MqlDateTime dt;
 TimeToStruct(time, dt);
 return dt.hour; }
//+------------------------------------------------------------------+
//+------------------------------------------------------------------+
//| DrawAndExport                                                    |
//+------------------------------------------------------------------+
//+------------------------------------------------------------------+
//| double型の配列の平均を計算する                            |
//+------------------------------------------------------------------+
double MathMean(const double &a[], const int count) {
 if(count <= 0) return 0.0;
 double sum = 0.0;
 for(int i = 0; i < count; i++)
  sum += a[i];
 return sum / count; }
//+------------------------------------------------------------------+
//| double型の配列の標本標準偏差を計算する           |
//+------------------------------------------------------------------+
double MathStdDev(const double &a[], const int count) {
 if(count < 2) return 0.0;
 double mean = MathMean(a, count);
 double sumSq = 0.0;
 for(int i = 0; i < count; i++)
  sumSq += MathPow(a[i] - mean, 2);
 return MathSqrt(sumSq / (count - 1));  // 標本標準偏差
}
//+------------------------------------------------------------------+

Discover new MetaTrader 5 opportunities with MQL5 community and services
- 2025.07.15
- www.mql5.com
MQL5: language of trade strategies built-in the MetaTrader 5 Trading Platform, allows writing your own trading robots, technical indicators, scripts and libraries of functions

取引の機会を逃しています。
- 無料取引アプリ
- 8千を超えるシグナルをコピー
- 金融ニュースで金融マーケットを探索
新しい記事「MQL5におけるタイムギャップ分析(第2回):時間経過に伴う流動性分布のヒートマップ作成」はパブリッシュされました:
第1回では、タイムギャップの概念と、それが機関投資家の取引活動とどのように関係しているかを考察しました。しかし、こうしたギャップを検出することは課題の半分に過ぎません。実際のトレードでは、価格がどこに長く滞在し、どこを素早く通過し、それらの領域がどのように相互作用しているかという、全体像を把握することが重要です。
そこで登場するのが、本記事で紹介するインジケータです。このツールは、目には見えない時間的なパターンを、直感的に理解できるヒートマップへと変換します。第1回では「異常(ギャップ)」の検出に焦点を当てましたが、今回は市場における通常の価格挙動全体の地図を構築します。
基本的な考え方は非常にシンプルです。価格帯全体を多数の細かなゾーン(マイクロゾーン)に分割し、それぞれのゾーンに価格がどれだけ長く滞在したかを集計します。滞在時間が長いほど、そのゾーンはより「熱く」なり、市場にとって重要度が高いと見なされます。最終的な結果は、低密度を示す赤から高密度を示す青までのカラーグラデーションで表示されます。
作者: Yevgeniy Koshtenko