Issam Kassas
Issam Kassas
4.6 (1197)
  • Informazioni
4 anni
esperienza
36
prodotti
1268
versioni demo
0
lavori
0
segnali
0
iscritti
I’m Issam Kassas, the developer behind Issam Algo. I build MetaTrader 5 indicators and Expert Advisors for chart analysis and trading automation.

Current OFFER: Buy Smart Trend Trading System MT5 and receive Smart Universal Expert Adviser MT5 as a free bonus.

Smart Trend Trading System MT5:
https://www.mql5.com/en/market/product/103515

Smart Universal Expert Adviser MT5:
https://www.mql5.com/en/market/product/104039

After purchasing Smart Trend Trading System, message me here on MQL5 to claim your bonus.

For product questions, setup guidance, or technical support, contact me directly through MQL5 messages.
Issam Kassas
Issam Kassas
Early Black Friday: Smart Universal Expert Adviser for MT5 is $49 on MQL5 Market through November 30. Configure compatible indicator signals and trade management in one tool. Test your setup on a demo account first.

https://www.mql5.com/en/market/product/104039
Issam Kassas
Issam Kassas
Early Black Friday: Smart Harmonic Patterns for MT5 is $39 on MQL5 Market through November 30. Use the chart panel to choose which harmonic patterns and reference levels to display.

https://www.mql5.com/en/market/product/199729
Issam Kassas
Issam Kassas
Early Black Friday: Smart Elliott Waves for MT5 is $39 on MQL5 Market through November 30. Use the chart panel to compare potential wave structures and browse earlier patterns.

https://www.mql5.com/en/market/product/200497
Issam Kassas
Issam Kassas
Early Black Friday: Smart Price Action Concepts for MT4 is $30 on MQL5 Market through November 30. Use the indicator to review market structure on your chart.

https://www.mql5.com/en/market/product/103104
Issam Kassas
Issam Kassas
Early Black Friday: Atomic Analyst for MT5 is $39 on MQL5 Market through November 30. Review trend direction, entry and exit signals, and stop-loss and take-profit levels on one chart.

https://www.mql5.com/en/market/product/114662
Issam Kassas
Issam Kassas
Early Black Friday: Smart Trend Trading System for MT5 is $49 on MQL5 Market through November 30. Review trend signals and key trade levels on your chart.

https://www.mql5.com/en/market/product/103515
Issam Kassas
Issam Kassas
Early Black Friday: Axiom Matrix for MT5 is $30 on MQL5 Market through November 30. Compare symbols and timeframes from one dashboard to find which charts to review.

https://www.mql5.com/en/market/product/182954
Issam Kassas
Issam Kassas
Early Black Friday: Gold Notch for MT5 is $49 on MQL5 Market through November 30. The EA automates XAUUSD entries and trade management from an on-chart panel.

https://www.mql5.com/en/market/product/194809
Issam Kassas
Issam Kassas
Early Black Friday: Unix Scalper MT5 is $39 on MQL5 Market through November 30. Use its chart panel to review signals and compare readings across timeframes.

https://www.mql5.com/en/market/product/190882
Issam Kassas
Issam Kassas
Early Black Friday: Atomic Analyst MT5 is $39 on MQL5 Market through November 30. Its trend filters and multi-timeframe panel help you review chart signals in context.

https://www.mql5.com/en/market/product/114662
Issam Kassas
Issam Kassas
Read the target map alongside momentum and volatility. This historical 10-15 September 2026 EURUSDm M10 Atomic Analyst V58 example shows a broad decline with sell annotations, SL -1R zones and targets from TP1 1R to TP4 4R. The panel reads Bearish Trend and SELL ONLY, with MTF Bias BEARISH and the MTF summary Bullish 2 / Bearish 17, while momentum is WEAK SELL, volume NORMAL and volatility LOW. A bearish backdrop does not guarantee that the next entry reaches its targets. Check entry timing, stop distance, spread and position risk before acting. Quality, sentiment, point labels and performance figures are interface readings, not verified live returns or guarantees. Test settings on demo first.

https://www.mql5.com/en/market/product/114662
Issam Kassas
Issam Kassas
Early Black Friday: Smart Trend Trading System MT5 is $49 on MQL5 Market through November 30. It brings trend, reversal, scalping, and volume views into one MT5 indicator.

https://www.mql5.com/en/market/product/103515
Issam Kassas
Issam Kassas
Separate earlier target examples from the current panel reading. This historical 31 July-14 August 2026 XAUUSDm H1 Atomic Analyst V58 chart shows earlier buy annotations and zones labelled TP1 1R through TP4 4R, while the panel reads Bearish Trend and SELL ONLY. Momentum is WEAK SELL, volume and volatility HIGH, and the MTF summary shows Bullish 4 / Bearish 13. Earlier upward moves do not establish the direction or outcome of the next setup. Check signal timing, spread and invalidation before sizing a position. Quality, sentiment, point labels and performance figures are interface readings, not probabilities or verified live returns. Test settings on demo first.

https://www.mql5.com/en/market/product/114662
Issam Kassas
Issam Kassas
Compare the current decision with the wider timeframe picture. This historical August 2026 XAUUSDm H1 Atomic Analyst V58 example shows Bullish Trend and BUY ONLY, with strong-buy momentum and high volume, while MTF Bias reads BEARISH. The MTF summary shows Bullish 7 / Bearish 12. Price rises across the later chart, but several buy examples are labelled SL reached beside target zones from TP1 1R to TP4 4R and SL -1R. A later rally does not prove every earlier entry survived its stop. Review signal timing, invalidation and position risk before acting. Quality, sentiment and performance figures are interface readings, not verified live returns or guarantees. Test settings on demo first.

https://www.mql5.com/en/market/product/114662
Issam Kassas
Issam Kassas
WAIT is useful information when the filters disagree. This historical 15 September 2026 XAUUSDm M1 Atomic Analyst V58 example shows Waiting for Alignment and WAIT, with Trend Bias and Trend Strength MIXED, MTF Bias BEARISH, Pair Strength BULLISH and momentum WEAK BUY. The MTF summary shows Bullish 5 / Bearish 14. A wider decline is followed by a late bounce; nearby buy and sell examples are marked SL reached beside risk and target zones. A directional bias does not remove stop-loss risk. Check alignment, signal timing and position size before acting. Quality, sentiment and performance figures are interface readings, not probabilities or verified live returns. Test settings on demo first.

https://www.mql5.com/en/market/product/114662
Issam Kassas
Issam Kassas
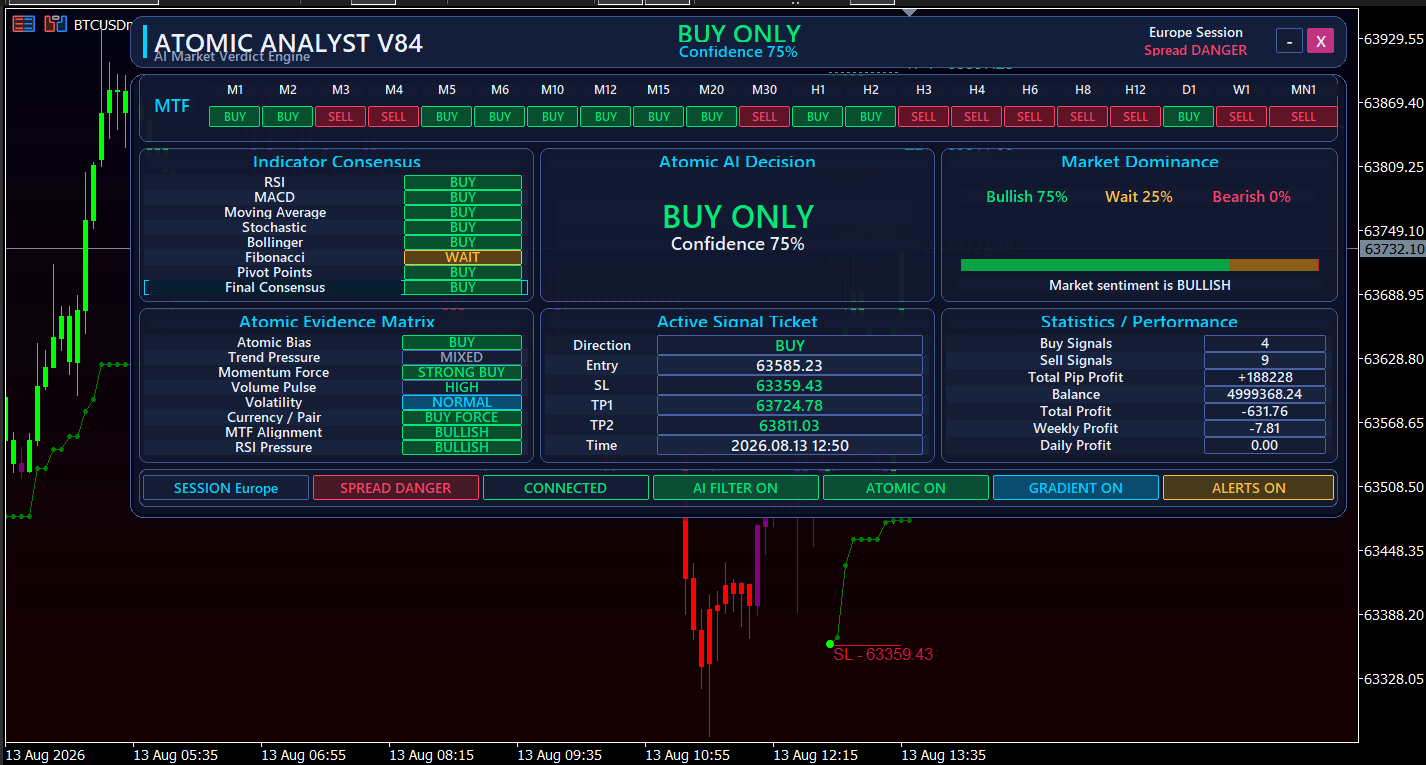
A bullish headline still needs an execution check. This historical 13 August 2026 Atomic Analyst V84 panel shows BUY ONLY with Confidence 75%, while Trend Pressure reads MIXED and the Europe-session spread warning reads DANGER. Its Active Signal Ticket lists a BUY entry at 63585.23, SL at 63359.43, TP1 at 63724.78 and TP2 at 63811.03, timestamped 12:50. These are historical displayed levels, not a current trade recommendation. Compare signal timing, spread and price structure before defining position risk. Confidence, market-dominance percentages and performance figures are interface readings, not probabilities of profit or verified live returns. Test settings on demo first.

https://www.mql5.com/en/market/product/114662
Issam Kassas
Issam Kassas
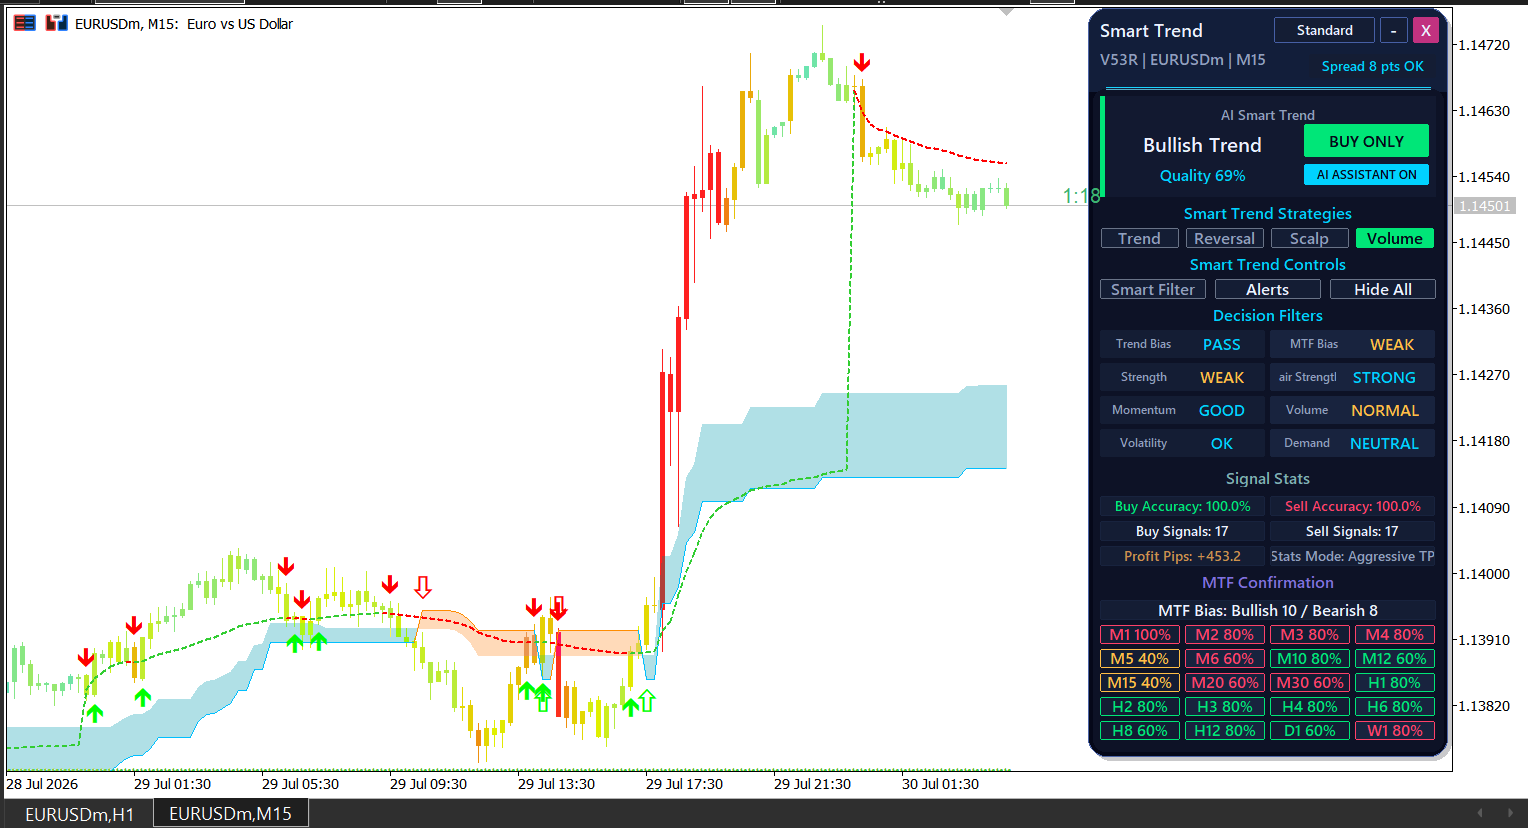
Compare the headline direction with the filters beneath it. This historical 28-30 July 2026 EURUSDm M15 Smart Trend example shows a sharp upward move followed by a pullback and pause above a blue cloud. Volume mode is selected; the panel reads Bullish Trend and BUY ONLY, while MTF Bias and Strength read WEAK. Momentum is GOOD, volume NORMAL and demand NEUTRAL; the MTF summary shows Bullish 10 / Bearish 8. Mixed confirmation calls for checking entry, invalidation and position risk before acting. Displayed quality, accuracy and pip figures are interface statistics, not verified live returns or guarantees. Test settings on demo first.

https://www.mql5.com/en/market/product/103515
Issam Kassas
Issam Kassas
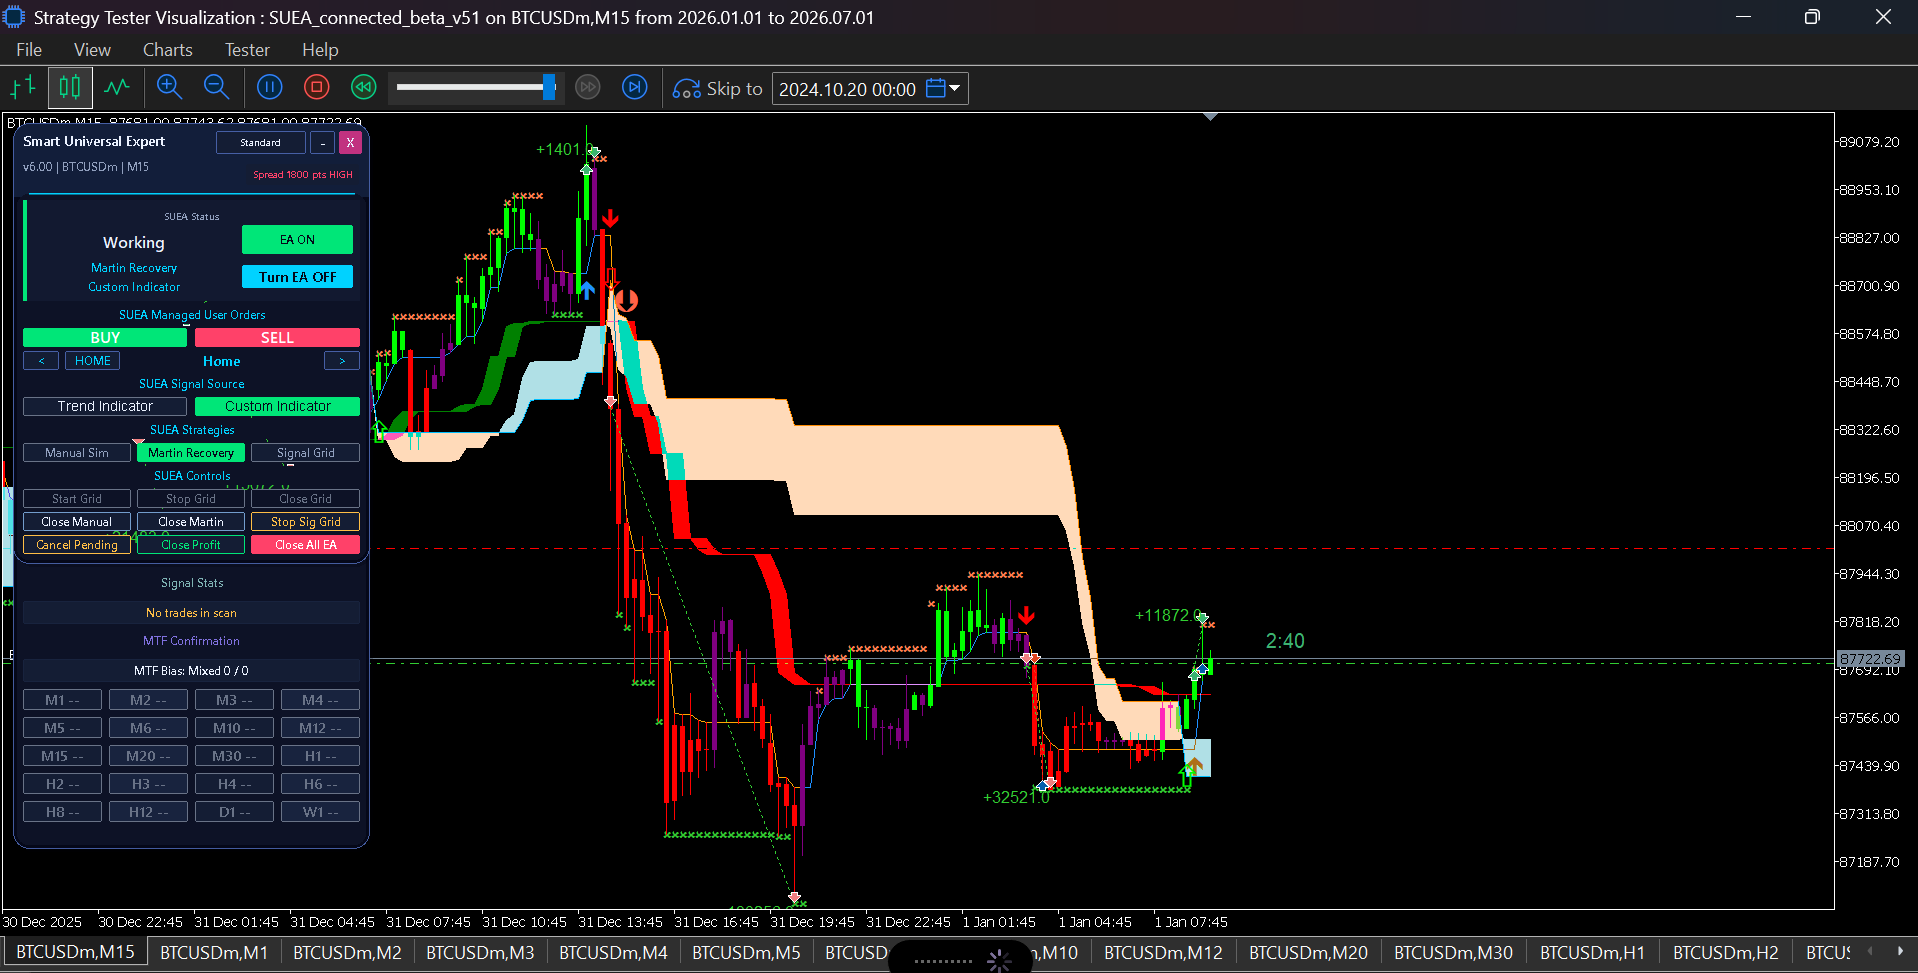
Separate strategy-tester examples from live execution. This historical BTCUSDm M15 Smart Universal Expert visualization shows a sharp decline followed by a rebound, with custom-indicator signals and colored trend bands. The panel reads Working and EA ON, with Martin Recovery and Custom Indicator selected, a HIGH spread warning and MTF Bias Mixed 0 / 0. Signal Stats reads No trades in scan. Review signal-buffer settings, spread limits and position exposure before enabling automation. Recovery modes can increase exposure and drawdown. Chart point annotations are tester readings, not verified live profits or guarantees. Test the complete setup on demo first.

https://www.mql5.com/en/market/product/104039
Issam Kassas
Issam Kassas
Read the latest direction separately from earlier marked setups. This historical 23 April-4 May 2026 USDCADm H1 Atomic Analyst example shows earlier sell arrows with Stop Loss and five Take Profit levels across two declines. The compact header now reads BUY ONLY with Confidence 84% and Spread Danger. Earlier target annotations do not establish the next trade or remove execution costs. Compare signal timing, nearby price structure and spread before defining entry, invalidation and position risk. Confidence and point annotations are interface statistics, not probabilities of profit or verified live returns. Test settings on demo first.

https://www.mql5.com/en/market/product/114662
Issam Kassas
Issam Kassas
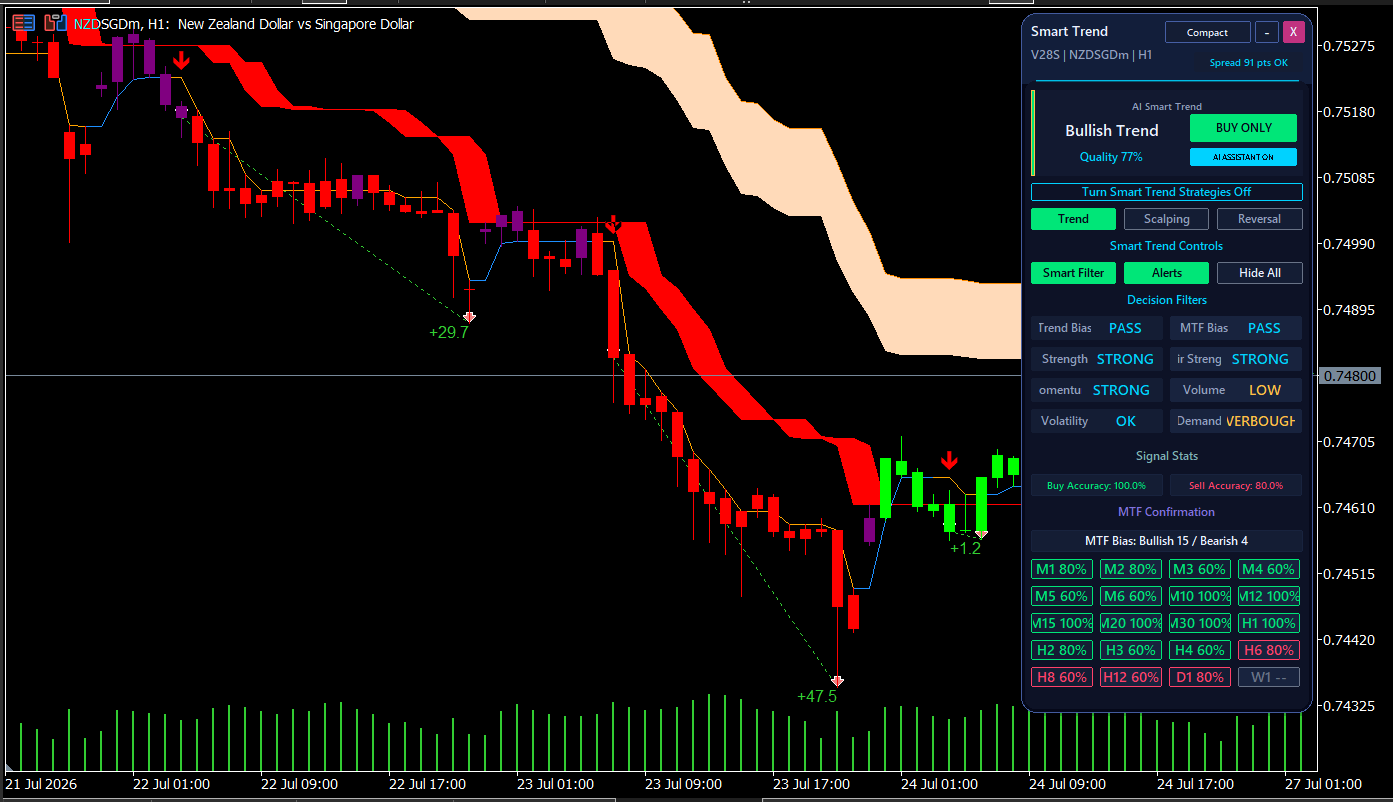
Check a bullish reading against the wider move. This historical 21-27 July 2026 NZDSGDm H1 Smart Trend example shows a substantial decline followed by a small rebound, while the panel reads Bullish Trend, BUY ONLY and Quality 77%, with Trend selected. Momentum reads STRONG, Volume LOW and Demand OVERBOUGHT; the MTF summary shows Bullish 15 / Bearish 4. A rebound and directional label do not by themselves establish a new sustained trend. Compare signal timing, nearby resistance and invalidation before defining position risk. Displayed accuracy and point annotations are interface statistics, not verified live returns or guarantees. Test settings on demo first.

https://www.mql5.com/en/market/product/103515