Follow Lines Follow Trend Discoloration lines
- Indicatori
- Kaijun Wang
- Versione: 1.50
- Aggiornato: 6 ottobre 2021
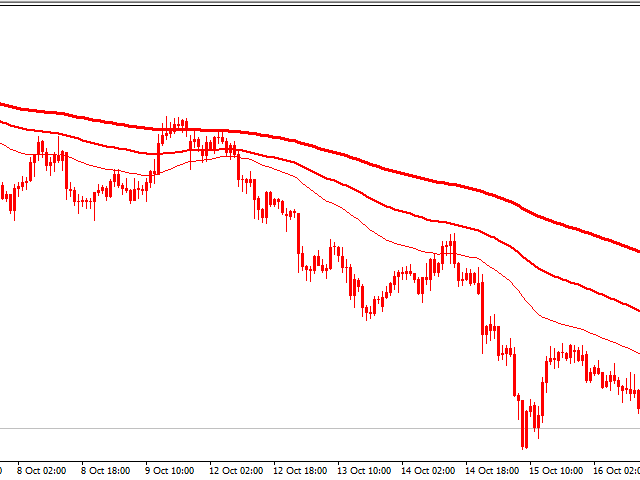
Indicators are for trend followers!
A trading system constructed by three moving averages. Trade with the trend and let profits run.
Strongly recommend trend indicators, automatic calculation of wave standard and MT5 version of automatic calculation of wave standard
Necessary for traders: tools and indicators
| Waves automatically calculate indicators, channel trend trading | Perfect trend-wave automatic calculation channel calculation , MT4 | Perfect trend-wave automatic calculation channel calculation , MT5 |
| Local Trading copying | Easy And Fast Copy , MT4 | Easy And Fast Copy , MT5 |
| Local Trading copying For DEMO | Easy And Fast Copy , MT4 DEMO | Easy And Fast Copy , MT5 DEMO |
Cooperation QQ:556024"
Cooperation wechat:556024"
Cooperation email:556024@qq.com"
Professional EA indicator writing.Mass angefertigt.
First of all, we have to understand that all moving averages are lagging indicators. They can only tell you afterwards that the market has turned, even if they provide valuable information and help you establish a position, they cannot help maximize profits. Therefore, it must be used in conjunction with the average value return area. The price can be in accordance with the instructions of the important support line, not lagging. When the market starts from the current tunnel and follows the trend, the transaction can continue to follow up, and finally a larger profit can be obtained. Firm your position in the trend, end the trend firmly end this round of trading and start the next trend following.
The essence of trading returns to simple and natural...


Useful indeed, thanks.