Fixed Range Inefficiency Profile
- Indicatori
-
Paolo Ruffini
 Sono un trader con oltre 15 anni di esperienza operativa sui mercati Forex e materie prime, con particolare focus su dinamiche di liquidità, pressione volumetrica e struttura del movimento direzionale.
- Versione: 1.1
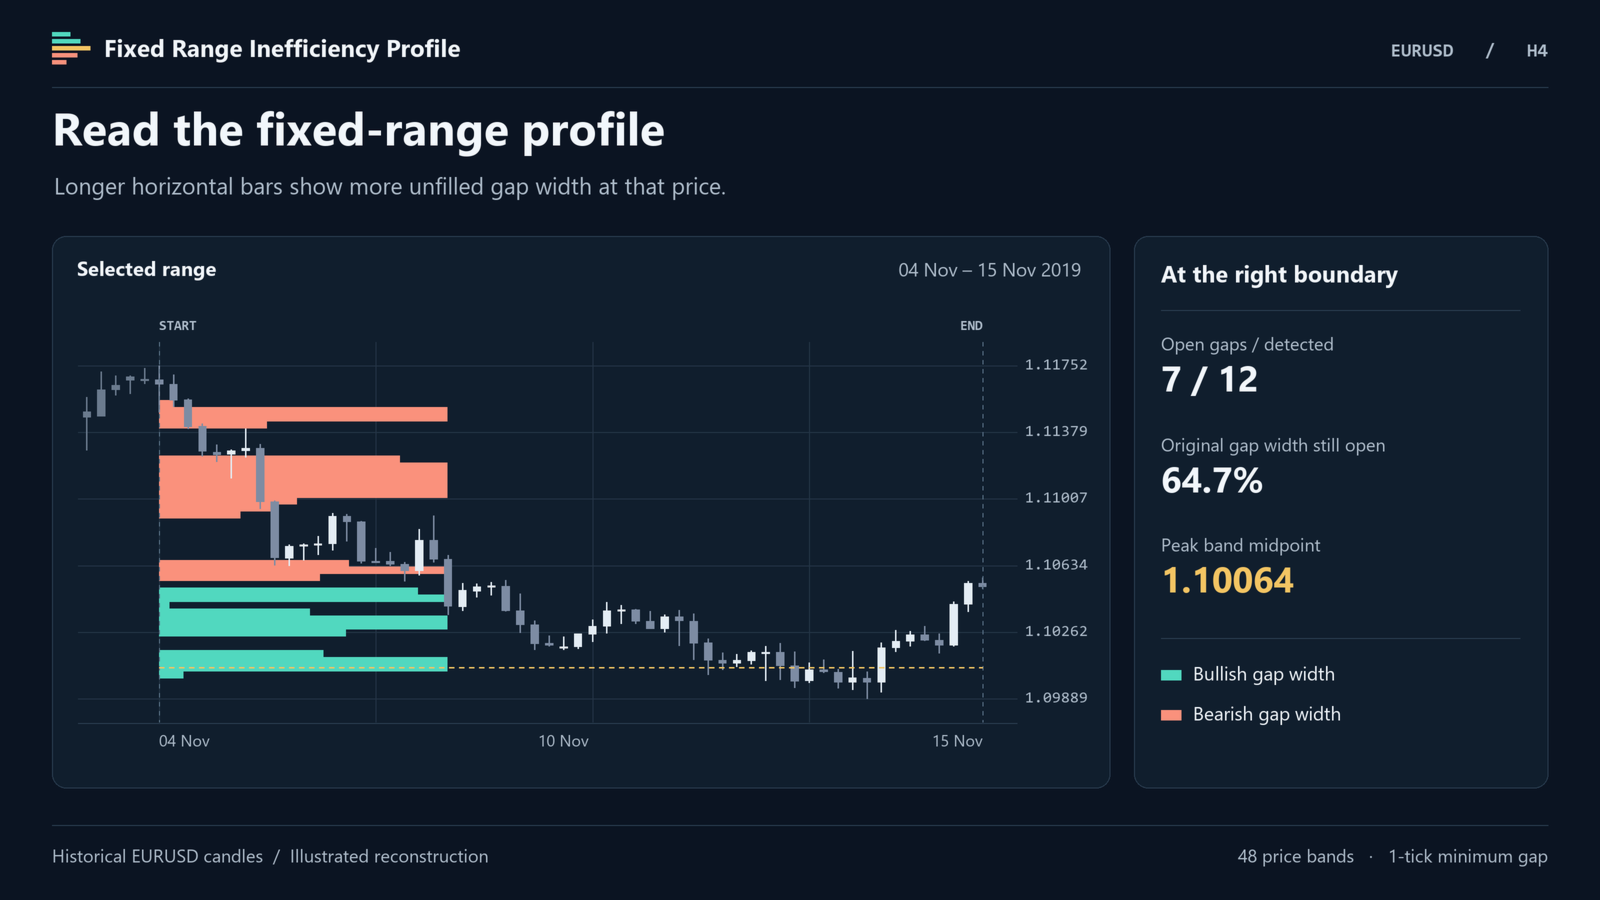
Fixed Range Inefficiency Profile shows where Fair Value Gaps (FVGs) remain open within a selected range on your MetaTrader 5 chart. Drag the two vertical lines to choose a move or session. The horizontal profile shows how much unfilled gap width remains in each price band at the end of that range.
How to read the profile
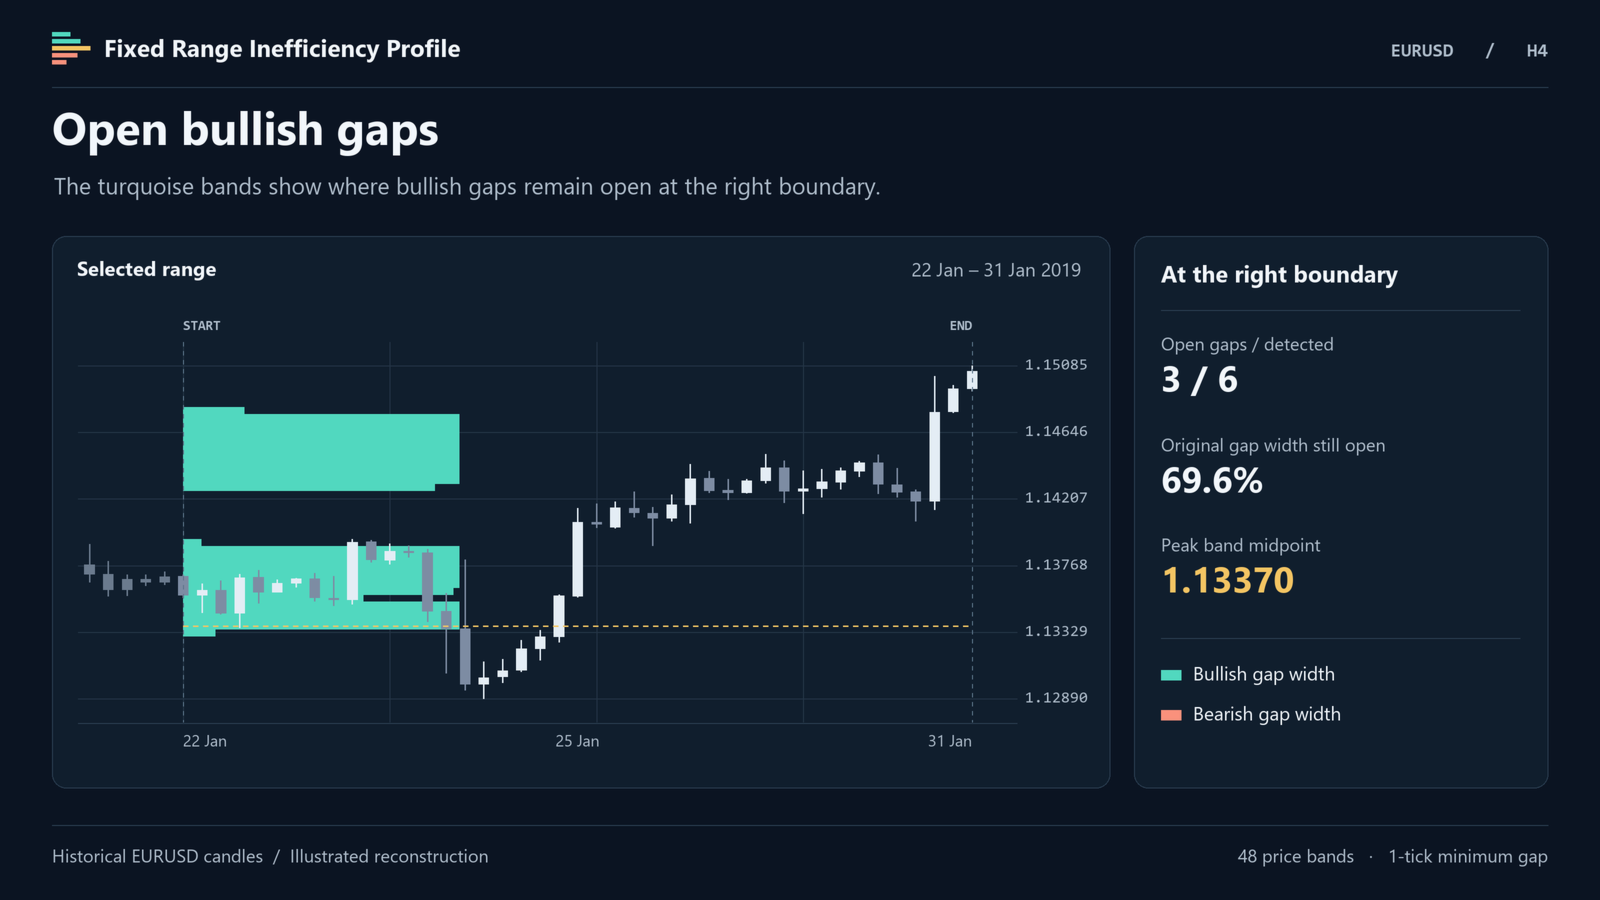
• Turquoise bars show the remaining width of bullish gaps.
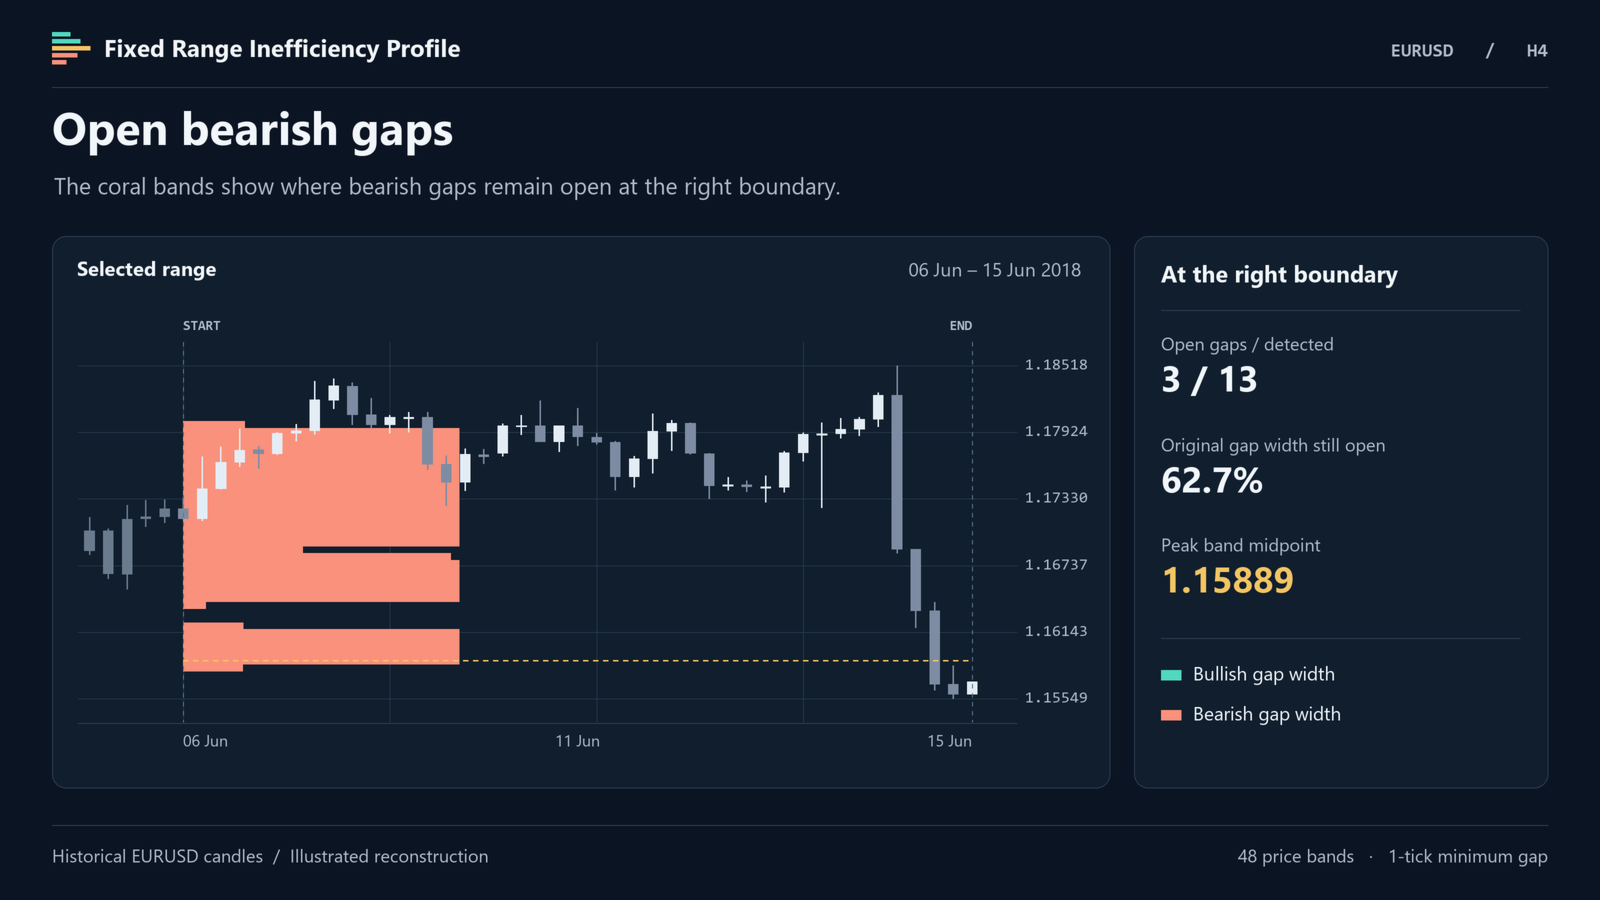
• Coral bars show the remaining width of bearish gaps.
• Longer bars indicate a greater total unfilled width at that price. When several gaps overlap, each contributes to the same band.
• The dotted gold line marks the centre of the band with the largest combined unfilled width.
• The chart label shows how many gaps are still open and what percentage of the original total gap width remains.
How gaps are measured
A bullish gap forms when the low of the third candle is above the high of the first. A bearish gap forms when the high of the third candle is below the low of the first. All three candles must fall within the selected range.
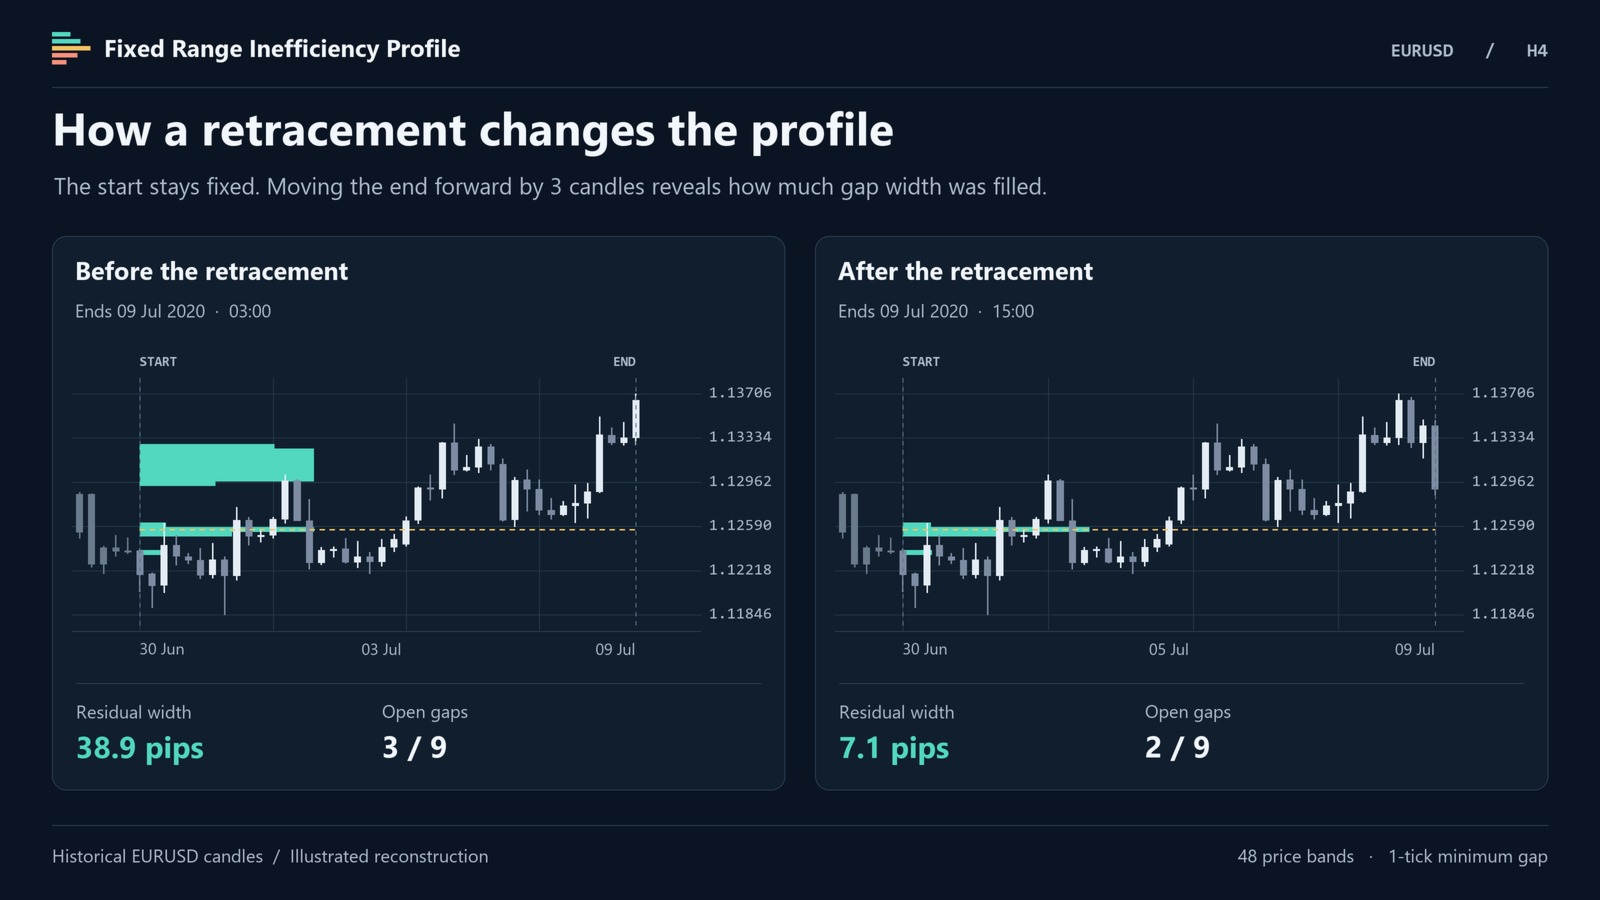
The indicator uses the highs and lows of subsequent closed candles to measure how far price has moved back into each gap. For example, if price retraces 8 pips into a 20-pip bullish gap, the remaining 12 pips contribute to the profile. A fully filled gap contributes zero. The profile measures price distance and requires no volume data.
How to use it
1. Attach the indicator to a chart. The initial range covers the last 150 closed candles.
2. Drag the vertical lines to select the period you want to examine.
3. To study a retracement, place the right boundary just before it, then move it forward. Each view uses only the closed candles within its boundaries.
Inputs and defaults
• BarreIniziali (150) — Number of closed candles in the initial range.
• FascePrezzo (48) — Number of horizontal price bands. A higher value shows finer price detail.
• GapMinimoTick (1) — Minimum gap width in price ticks, using the symbol's tick size.
• LarghezzaProfilo (35) — Width of the longest profile bar as a percentage of the selected chart range.
• ColoreRialzista, ColoreRibassista and ColorePicco — Colours of the bullish bars, bearish bars and peak line.